The optical retail industry is evolving faster than ever. Customers expect high-quality eyewear, advanced lenses, competitive pricing, and excellent service every time they walk into a store. For retailers, this means tracking hundreds of data points—sales, cost, profit, customer satisfaction, product categories, brand performance, and store-wise trends. Optical Retail Dashboard in Power BI When teams rely on manual reporting, mistakes increase, decisions slow down, and opportunities are often missed.
The Optical Retail Dashboard in Power BI solves this challenge instantly. It converts complex retail data into clean, interactive, and decision-ready visuals. With a fully automated structure, smart slicers, and highly intuitive pages, managers get a real-time view of performance across all stores, cities, brands, and product categories. You simply load your data, and Power BI brings everything to life with insights that drive revenue, efficiency, and customer satisfaction. 🚀
Optical Retail Dashboard in Power BI Whether you’re managing multiple stores, optimizing your pricing, evaluating brand performance, or improving product mix, this dashboard becomes your all-in-one retail intelligence powerhouse.
Key Features of the Optical Retail Dashboard in Power BI ✨
This powerful dashboard is designed to give teams everything they need in one place:
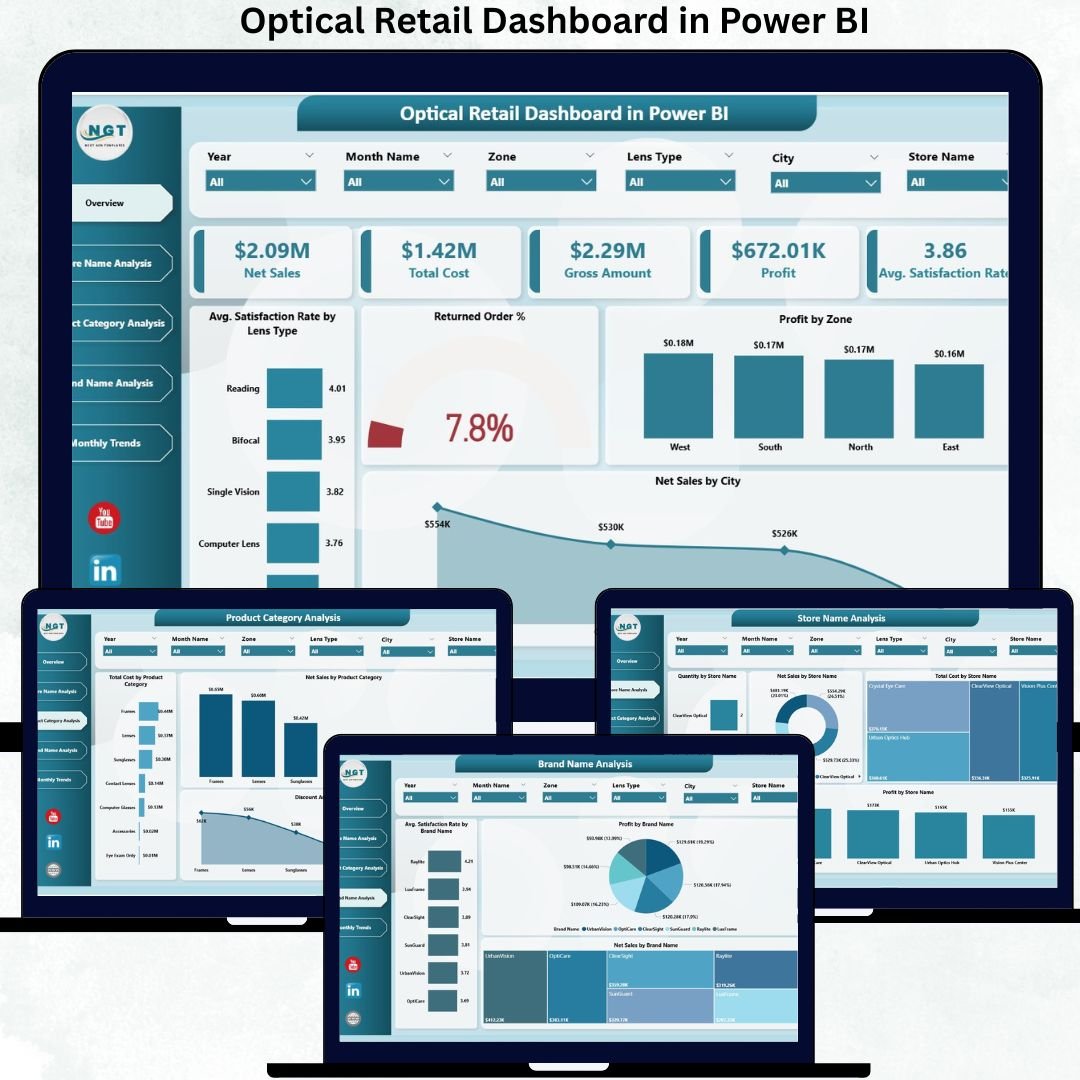
✨ 5 Insight-Rich Analytical Pages – Overview, Store Analysis, Category Analysis, Brand Analysis & Monthly Trends
📊 Interactive KPI Cards – Track net sales, gross amount, profit, cost & satisfaction rate instantly
🖥️ Dynamic Power BI Visuals – Easily compare stores, brands & regions
🎯 Slicers on Every Page – Filter by store, brand, category, city, or lens type
🔍 Deep Brand & Category Insights – Understand what sells and why
📈 Trend Tracking Tools – See seasonal changes, profit cycles & sales growth
📦 Fully Automated System – Just refresh your data; the dashboard updates itself
💡 Fast, Actionable Insights – No more manual reporting or complex analysis
With this dashboard, decision-making becomes faster, smarter, and data driven.
What’s Inside the Optical Retail Dashboard in Power BI 📂
You get a complete reporting ecosystem that includes:
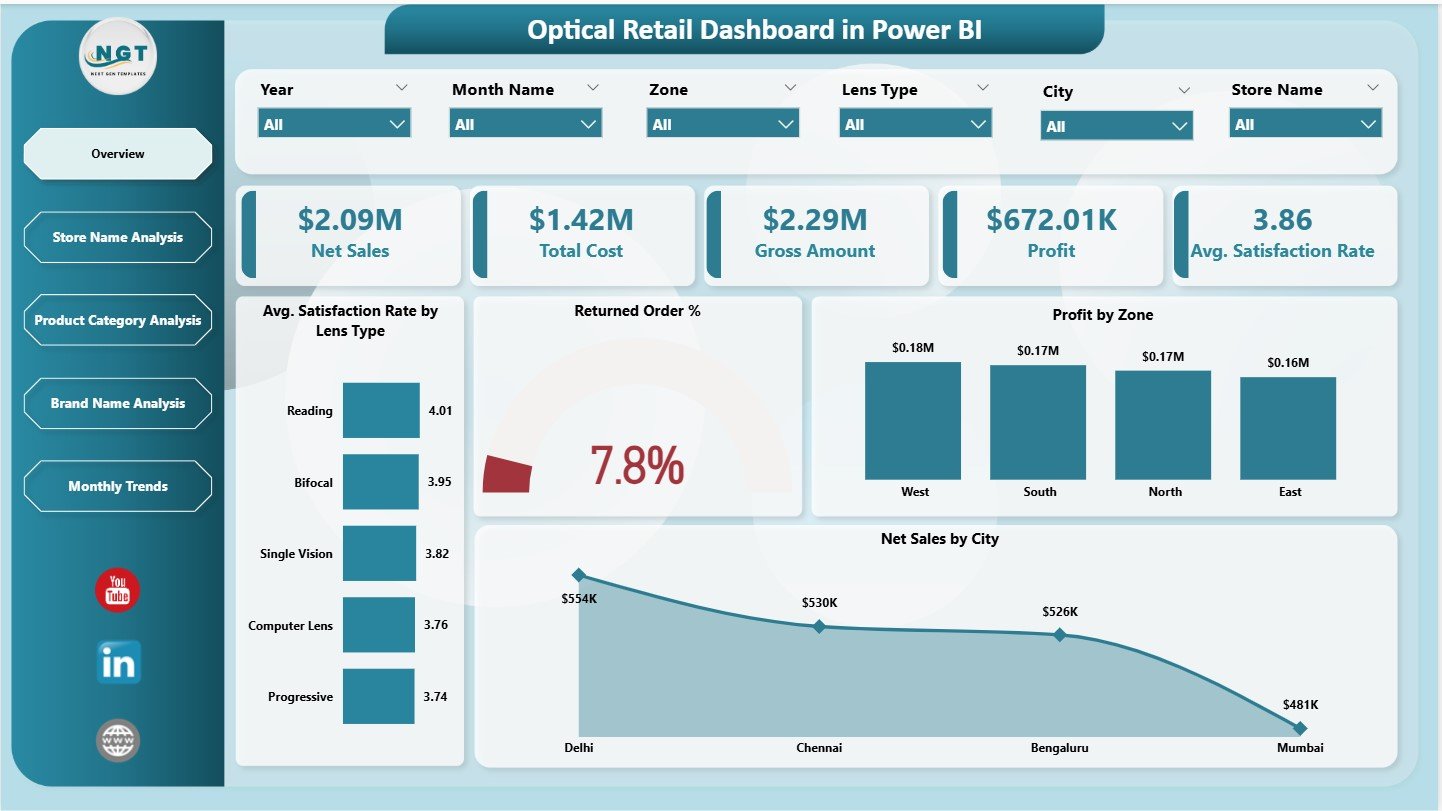
📌 Overview Page – A powerful snapshot of sales, profit, satisfaction & return trends
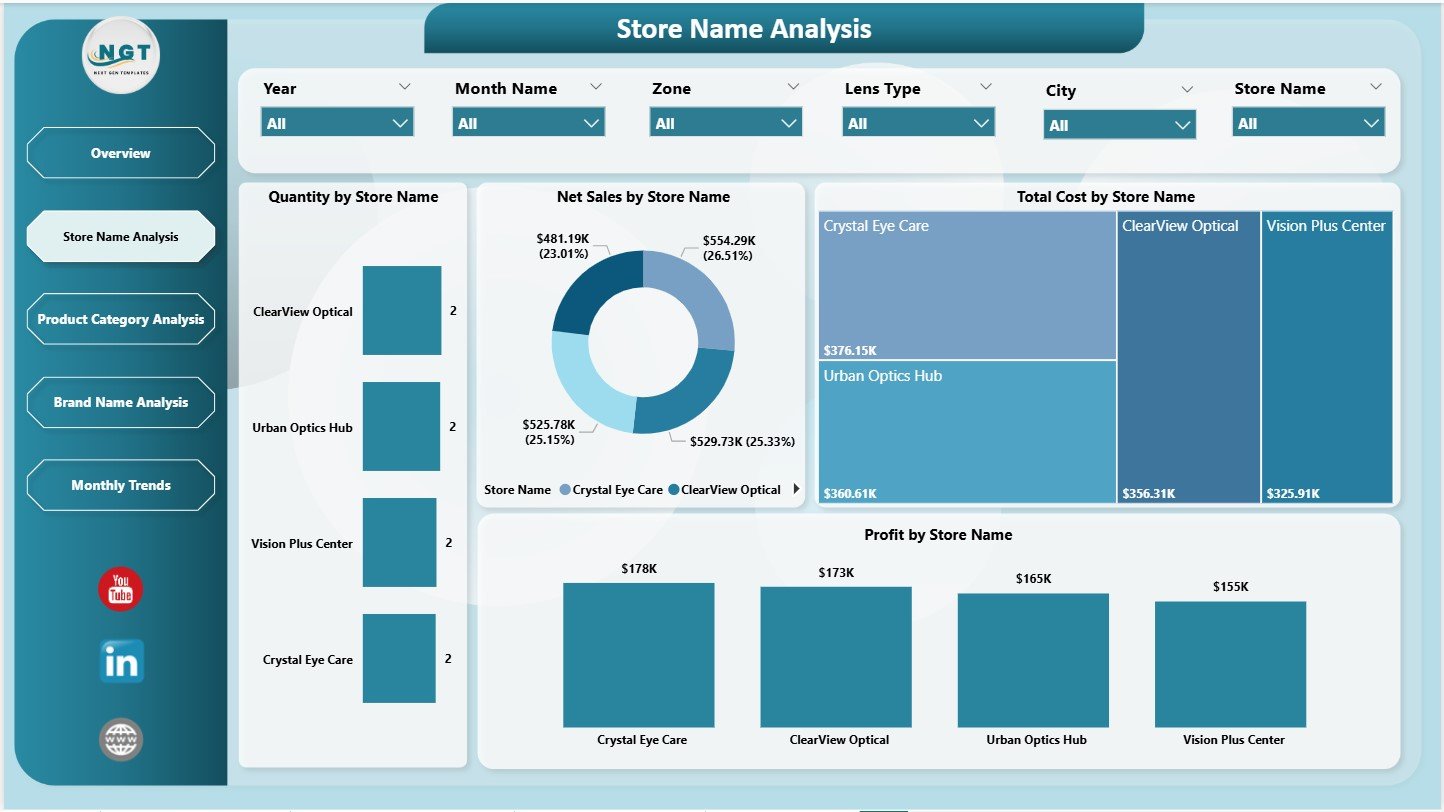
📌 Store Name Analysis – Compare store productivity, profitability & operating costs
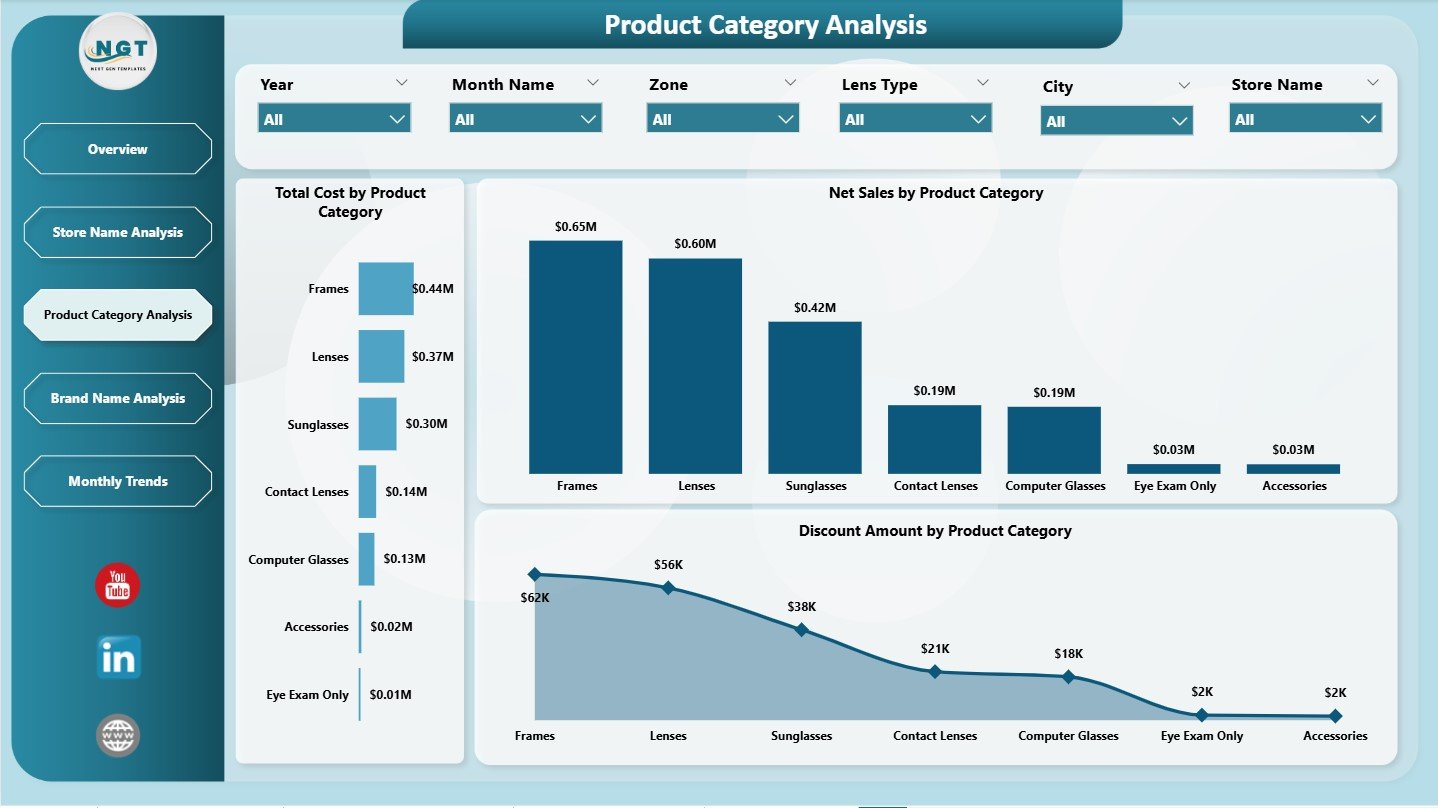
📌 Product Category Analysis – View performance of lenses, frames, sunglasses, accessories & more
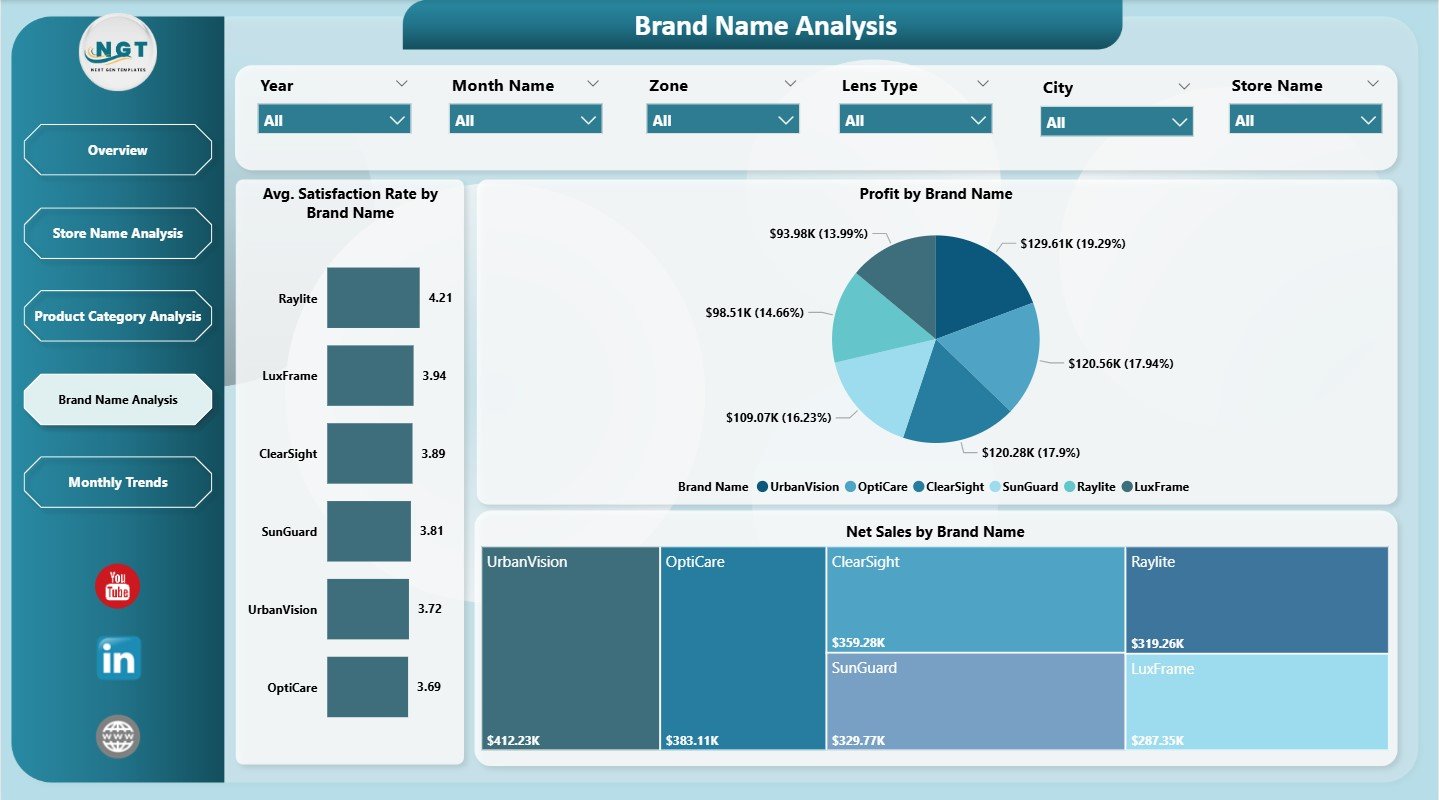
📌 Brand Name Analysis – Evaluate brand-wise satisfaction, net sales & profit
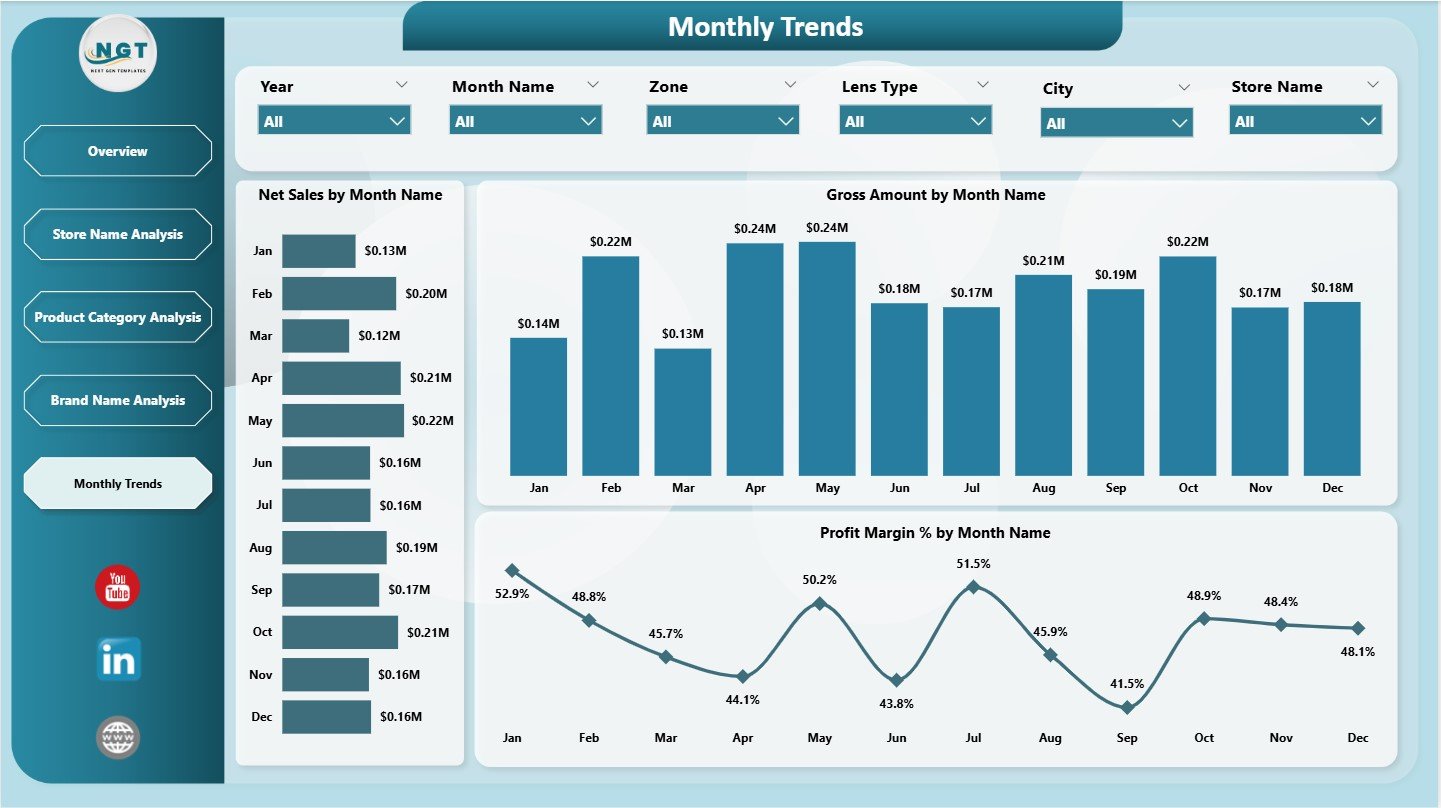
📌 Monthly Trends Page – Identify seasonality, growth opportunities & performance dips
📌 Data Model & Support Sheets – Fully structured for easy updates
Every page is optimized to help retailers improve planning, pricing, customer experience, and store performance.
How to Use the Optical Retail Dashboard in Power BI 🛠️
Using the dashboard is simple and beginner-friendly:
1️⃣ Load or connect your retail data
2️⃣ Refresh the Power BI report
3️⃣ Use slicers to filter by store, brand, lens type & more
4️⃣ Review KPIs and charts to understand performance
5️⃣ Export visuals for presentations or client reviews
Everything is automated—no coding, no formulas, no manual charts. Just plug in your data and get instant insights. ⚡
Who Can Benefit from This Optical Retail Dashboard? 👥
This dashboard is designed for every professional involved in retail performance and operations:
🎯 Optical Store Owners – Track performance across all outlets
📈 Retail Directors – Compare store, category & brand performance
🧿 Brand Managers – Understand customer satisfaction & brand contribution
🧮 Finance & Profitability Teams – Analyze cost, margin & return behavior
📊 Retail Data Analysts – Access clean visuals for instant reporting
👓 Store Managers – Identify improvement areas quickly
If you want deeper insights, faster decisions, and improved profitability—this dashboard is built for you.


Reviews
There are no reviews yet.