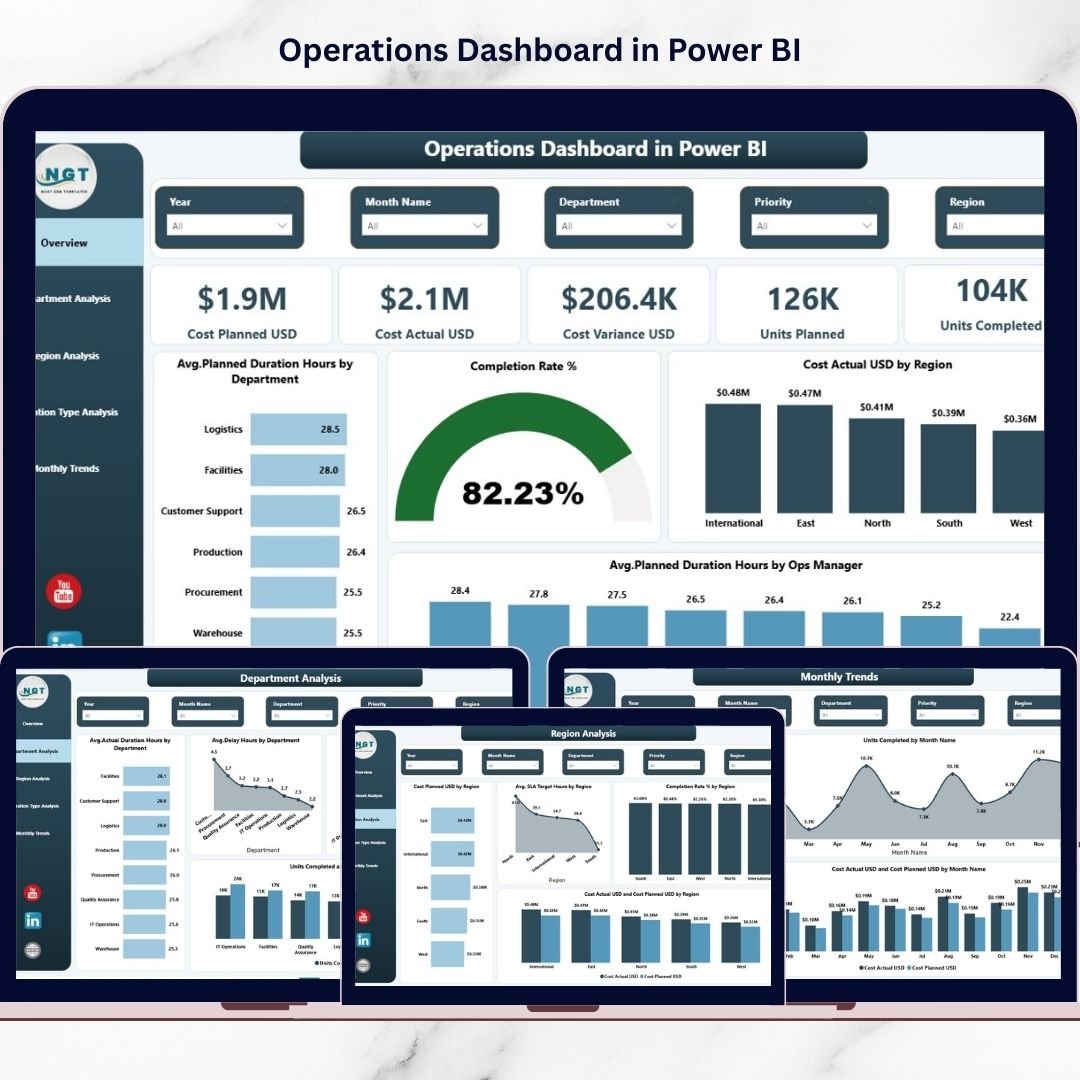
Managing operations efficiently is no longer optional — it is essential for business success. Modern organizations handle complex workflows, multiple departments, regional operations, and strict cost targets every day. However, many companies still depend on scattered spreadsheets and manual reporting, which leads to delays, poor visibility, and slow decision-making.What if you could monitor operational performance, costs, productivity, and efficiency from one centralized system?Introducing the Operations Dashboard in Power BI — a powerful, ready-to-use analytics solution designed to transform raw operational data into actionable insights.Instead of reviewing multiple reports, this interactive dashboard allows managers and executives to track performance instantly, identify delays, control costs, and optimize operations using dynamic visuals and real-time filtering.
Built using Microsoft Power BI, this dashboard delivers professional-level analytics without requiring complex technical expertise. As a result, organizations gain clarity, speed, and confidence in decision-making.
✨ Key Feature of Operations Dashboard in Power BI
🚀 Interactive Performance Monitoring – Analyze operational metrics using dynamic visuals and slicers for instant insights.
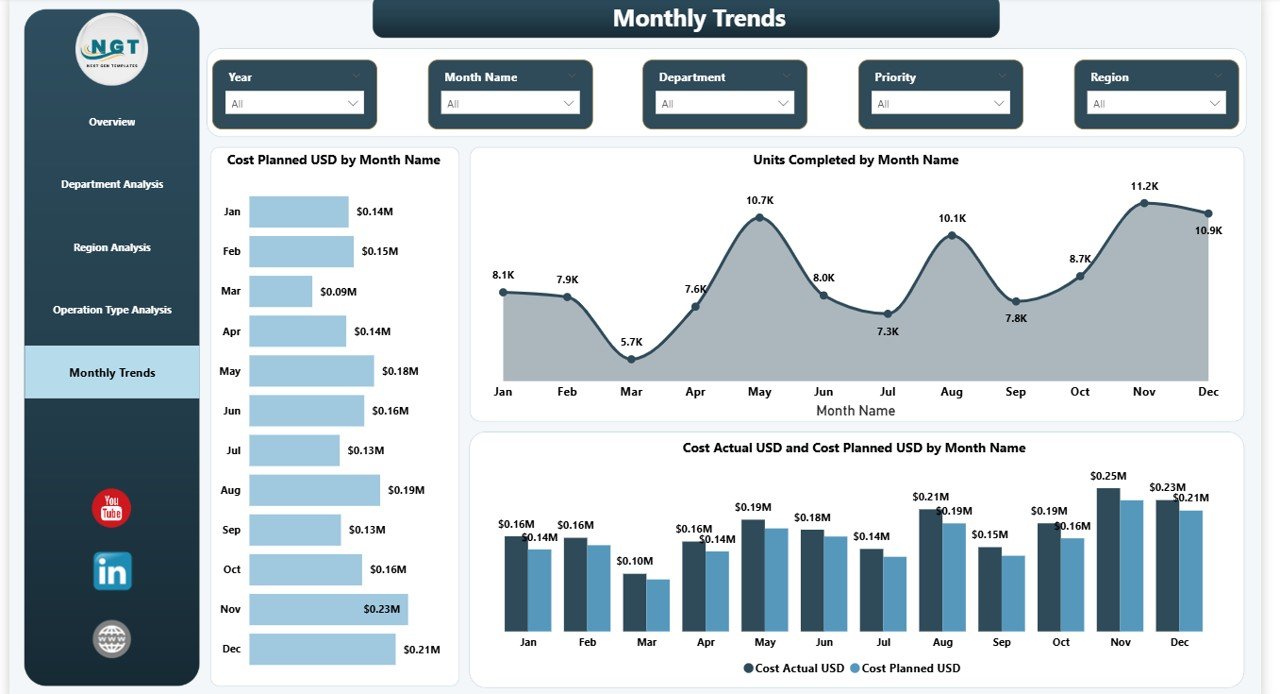
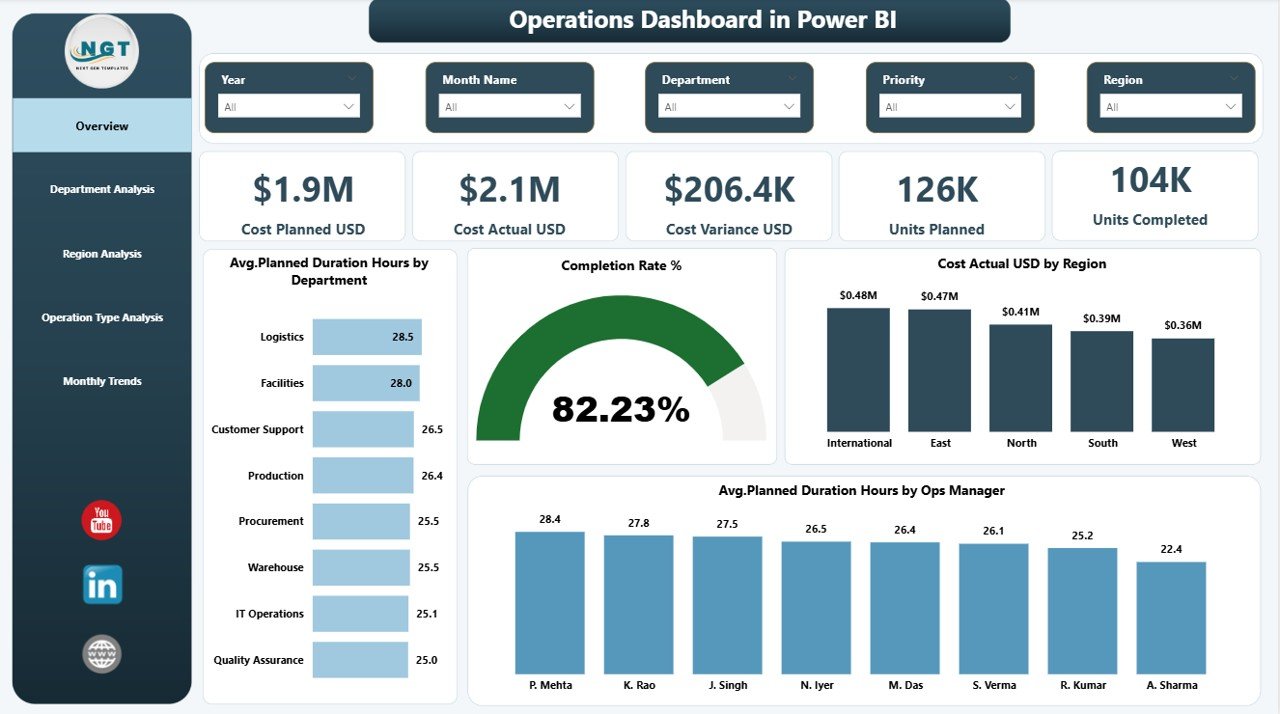
📊 Five Analytical Dashboard Pages – Overview, Department Analysis, Region Analysis, Operation Type Analysis, and Monthly Trends.
💰 Cost Tracking Intelligence – Compare planned vs actual costs to identify budget deviations quickly.
📈 Completion & Productivity Insights – Monitor units planned, completed, and completion rate percentages.
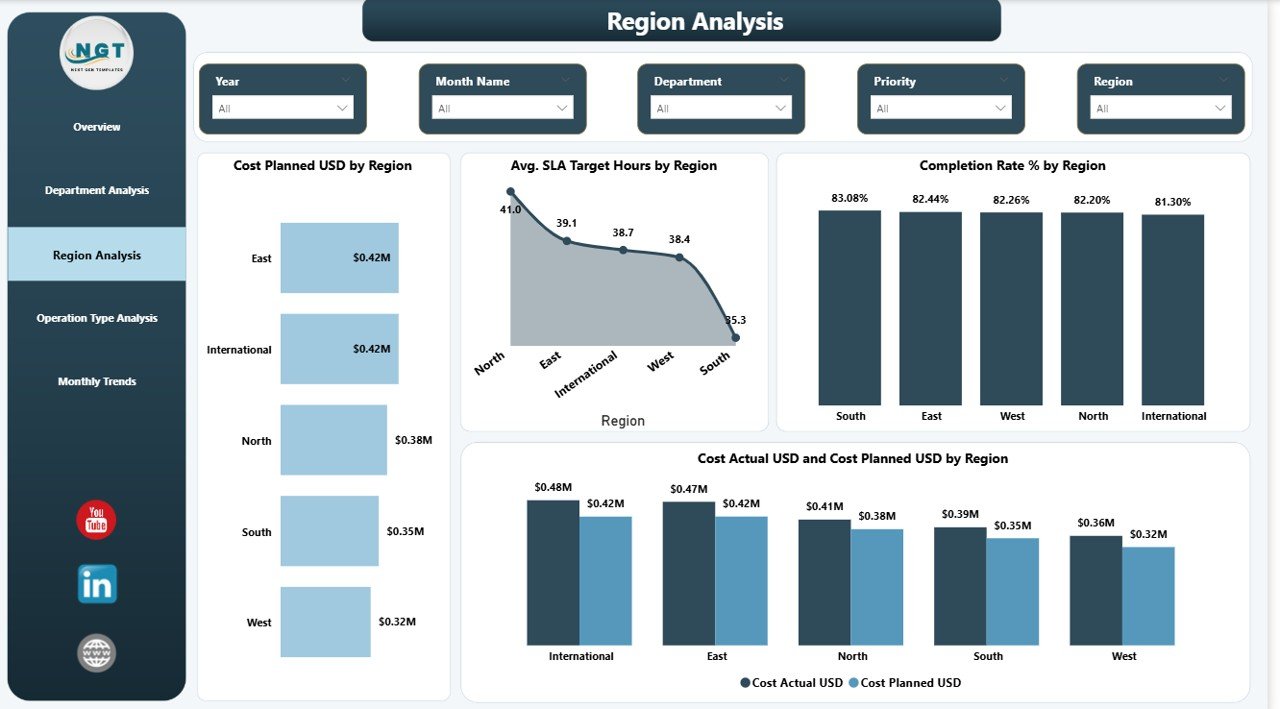
🌍 Regional Performance Analysis – Evaluate efficiency and spending across multiple locations.
⏱ Delay & Duration Tracking – Detect operational bottlenecks before they impact performance.
🔎 Drill-Down Analysis – Explore performance by department, manager, region, or operation type.
⚡ Real-Time Filtering – Instantly adjust views using Power BI slicers for faster analysis.
📦 What’s Inside the Operations Dashboard in Power BI
This ready-to-use dashboard includes five professionally designed analytical pages:
✅ Overview Page – High-level operational snapshot with KPI cards and performance charts.
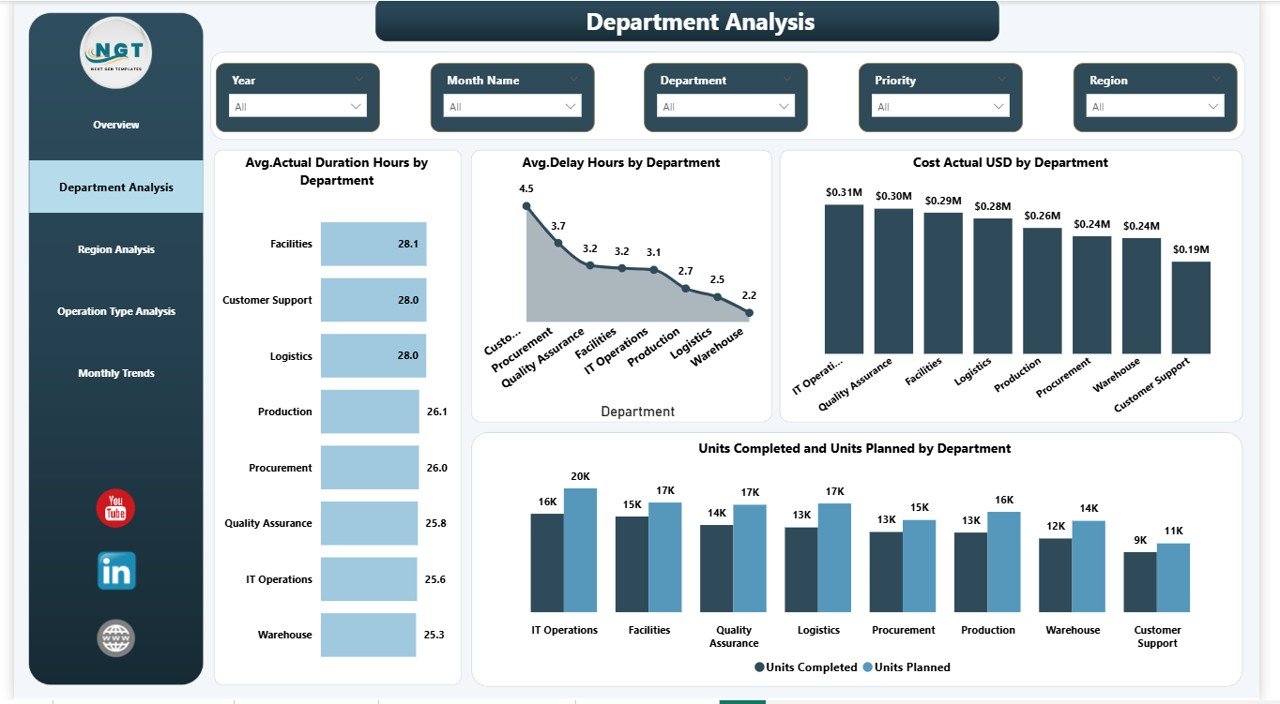
✅ Department Analysis – Compare departmental productivity, delays, and operational costs.
✅ Region Analysis – Evaluate efficiency and SLA performance across regions.
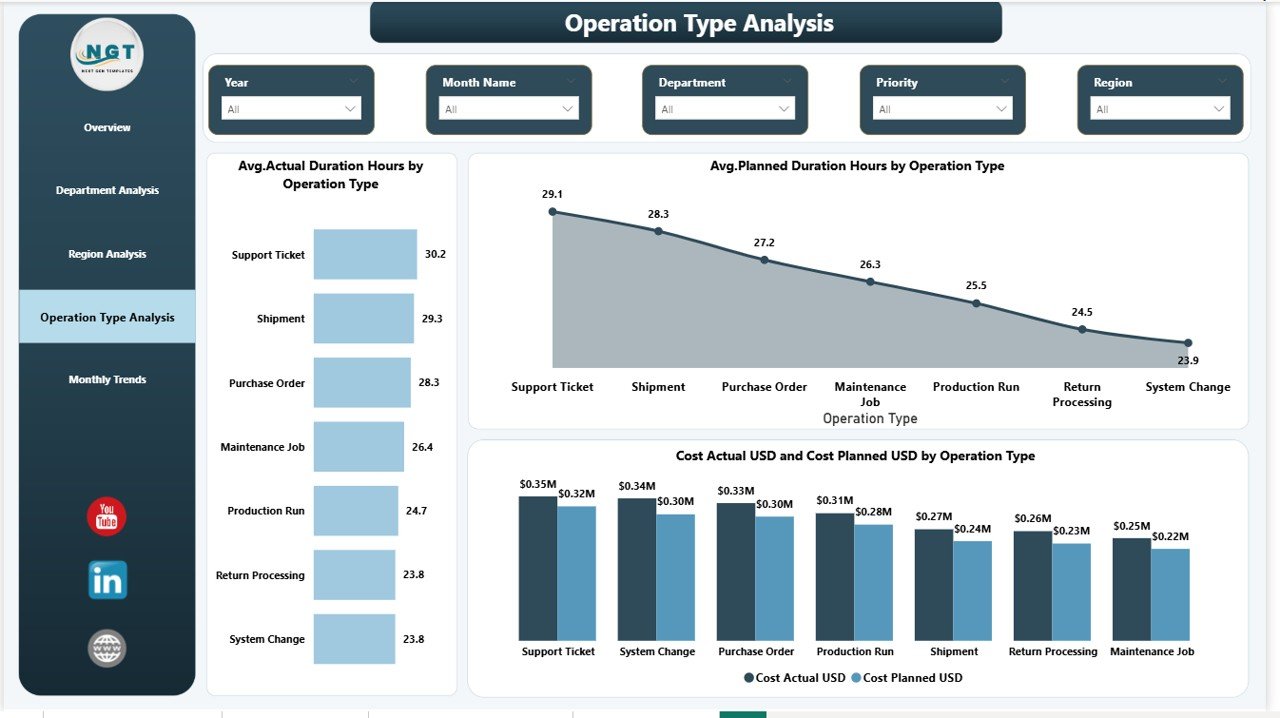
✅ Operation Type Analysis – Identify operations driving higher costs or delays.
✅ Monthly Trends Page – Monitor performance changes and long-term operational patterns.
The dashboard tracks essential KPIs such as:
-
Planned Cost vs Actual Cost
-
Cost Variance
-
Units Planned & Completed
-
Completion Rate %
-
Planned vs Actual Duration
-
Delay Hours
-
SLA Target Performance
Together, these metrics create a complete operational performance framework.
⚙️ How to Use the Operations Dashboard in Power BI
Using this dashboard is simple and user-friendly:
1️⃣ Import or connect your operational dataset into Power BI.
2️⃣ Refresh the dashboard to update visuals automatically.
3️⃣ Use slicers to filter by department, region, manager, or time period.
4️⃣ Analyze KPIs and charts to identify performance gaps.
5️⃣ Take data-driven actions to improve efficiency and cost control.
No advanced Power BI expertise is required — managers can explore insights with just a few clicks.
🎯 Who Can Benefit from This Operations Dashboard in Power BI
This dashboard is ideal for organizations that rely on operational performance tracking, including:
🏭 Manufacturing companies
🚚 Logistics & supply chain organizations
🏗 Construction and project teams
🏢 Facility management operations
📦 Service operations departments
👨💼 Operations managers and executives
📊 Business analysts and decision-makers
Because every organization runs operations, this dashboard adapts easily across industries.
By implementing this dashboard, organizations gain:
✅ Faster decision-making
✅ Improved cost control
✅ Higher operational efficiency
✅ Centralized reporting visibility
✅ Stronger accountability across teams
✅ Data-driven leadership culture
Instead of reacting to problems late, leaders can proactively manage performance and drive continuous improvement.
Click here to read the Detailed blog post
Watch the step-by-step video tutorial:


