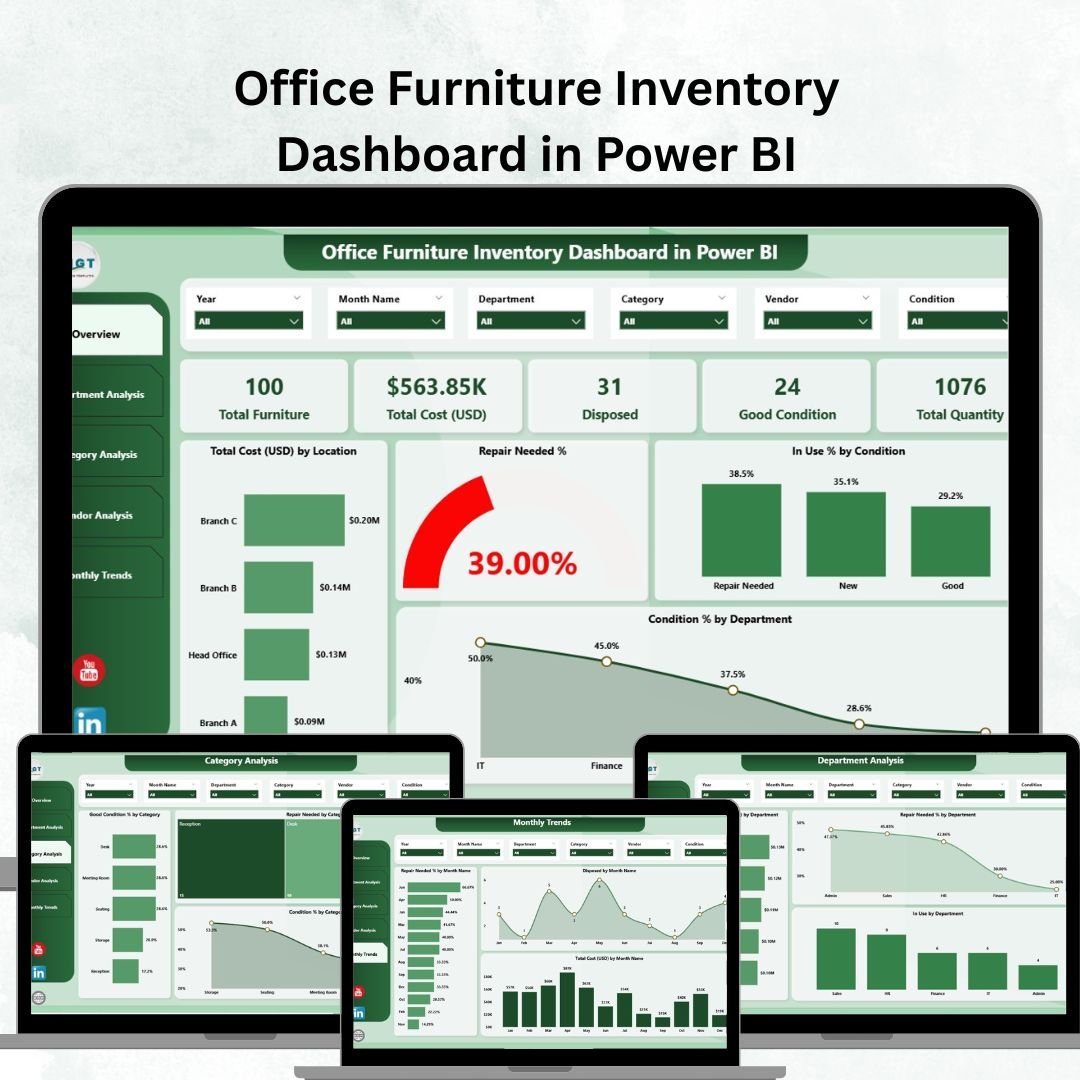
Managing office furniture may seem minor, but for organizations with hundreds or thousands of assets, it’s a major challenge. Without structured tracking, businesses risk overspending, underutilizing assets, and facing inefficiencies. That’s why the Office Furniture Inventory Dashboard in Power BI is a game-changer.
This ready-to-use dashboard gives facility managers, finance teams, and decision-makers real-time insights into asset costs, conditions, usage, repairs, and vendor performance. Built on top of an Excel dataset, the dashboard transforms static numbers into interactive KPIs, charts, and trends.
Whether you’re a corporate office, school, hospital, or government department, this tool helps you make data-driven decisions, optimize asset utilization, and cut unnecessary costs.
🔑 Key Features of Office Furniture Inventory Dashboard in Power BI
-
📊 Five Interactive Pages – Overview, Department, Category, Vendor, and Monthly Trends.
-
🎯 KPI Cards – Track total cost, repair needs, usage %, disposal %, and condition %.
-
🖥 Snapshot Analysis – Instantly view costs, utilization, and asset condition.
-
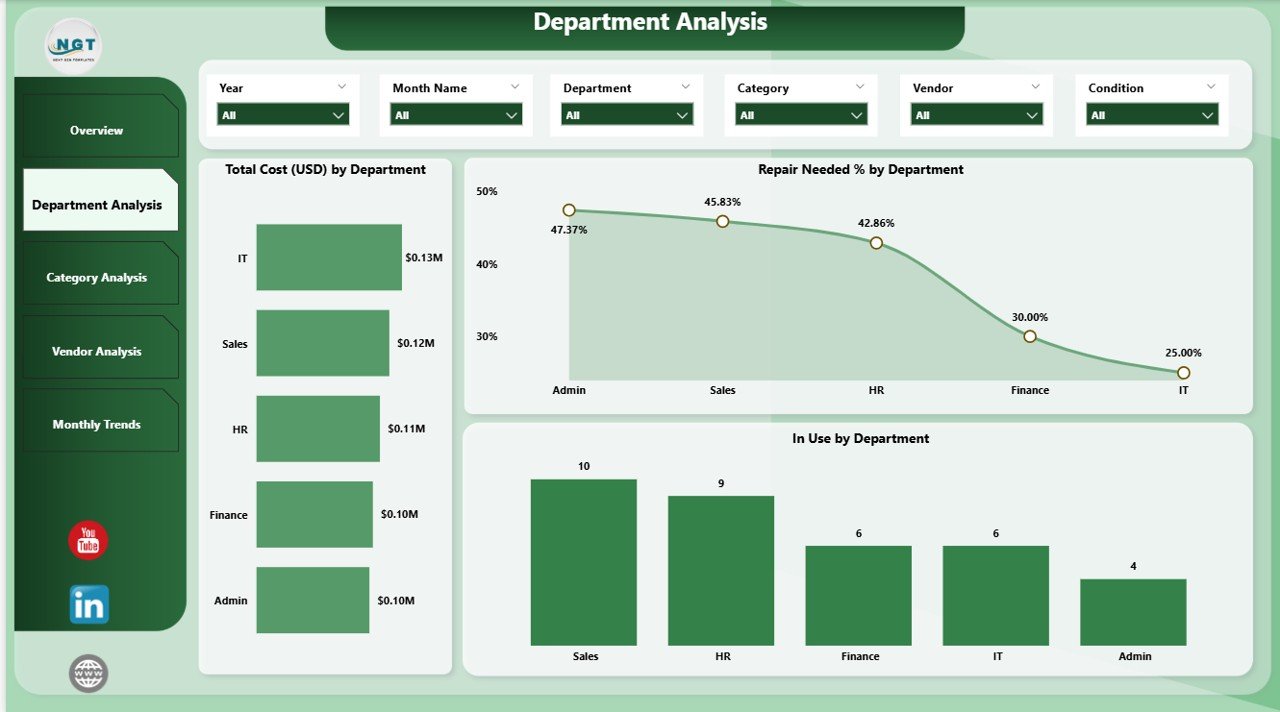
🛠 Department Analysis – Monitor costs, usage, and maintenance needs by department.
-
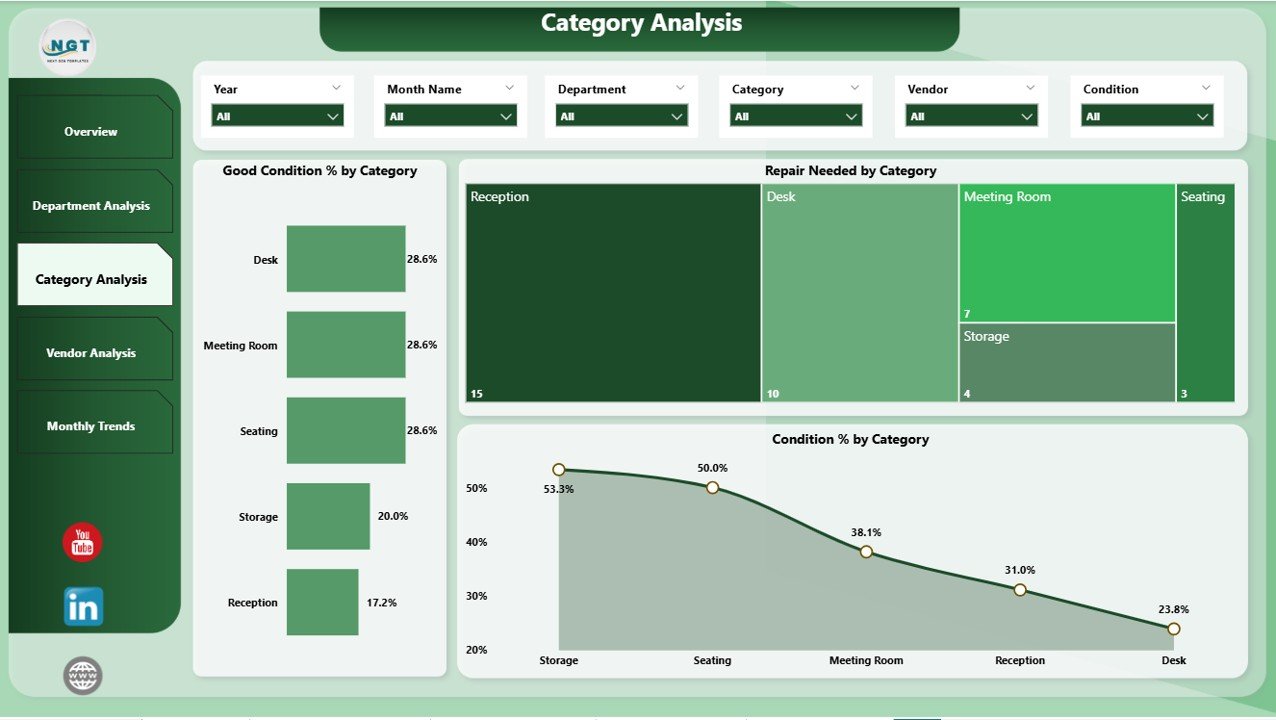
📂 Category Insights – Evaluate desks, chairs, storage, and other categories.
-
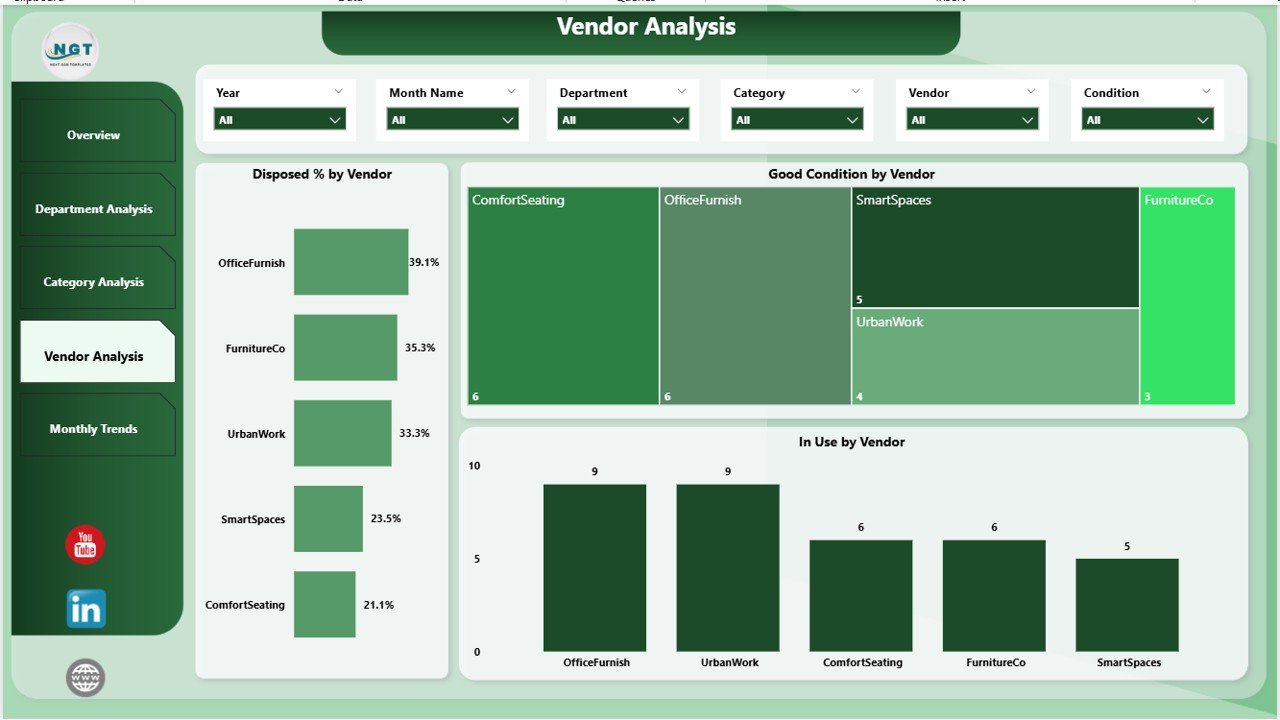
🤝 Vendor Evaluation – Compare vendor reliability, durability, and performance.
-
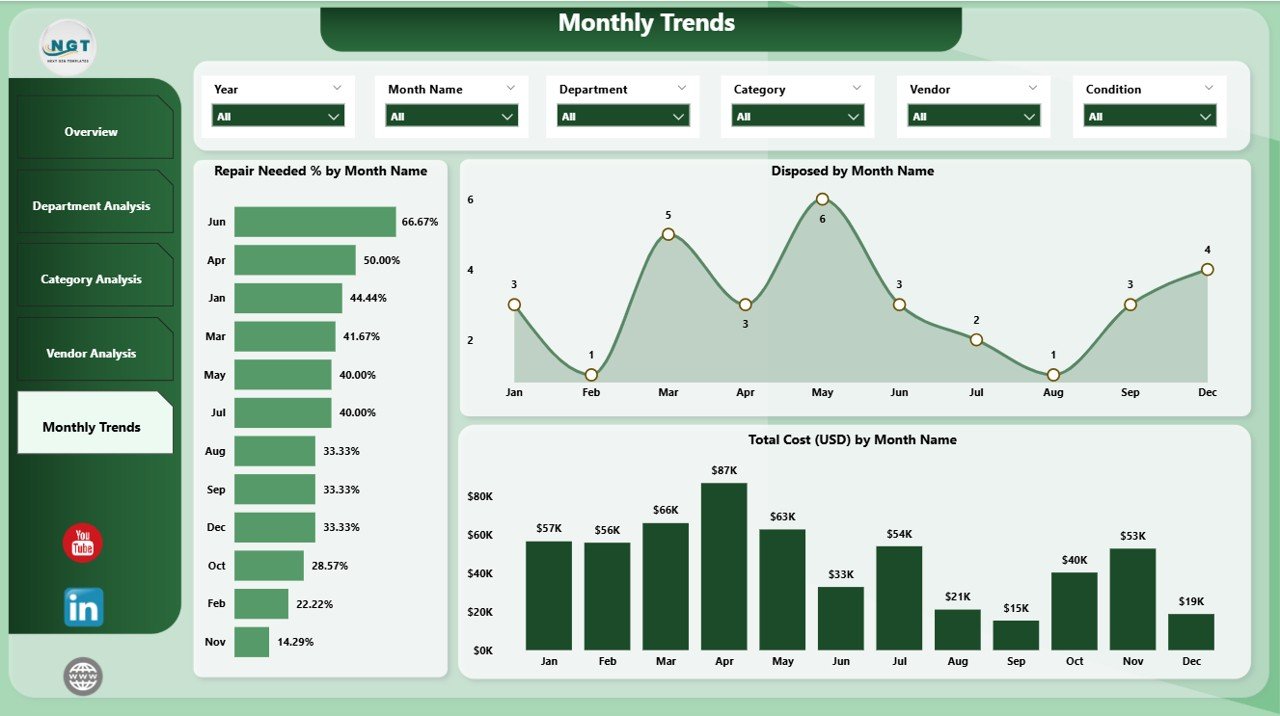
📈 Monthly Trends – Spot cost patterns, repair spikes, and disposal cycles.
-
✅ Excel-Powered Data Source – Easy to update and refresh each month.
-
🚀 Customizable – Add or adjust KPIs to fit organizational needs.
📂 What’s Inside the Office Furniture Inventory Dashboard
This dashboard consists of five analytical pages designed for comprehensive insights:
-
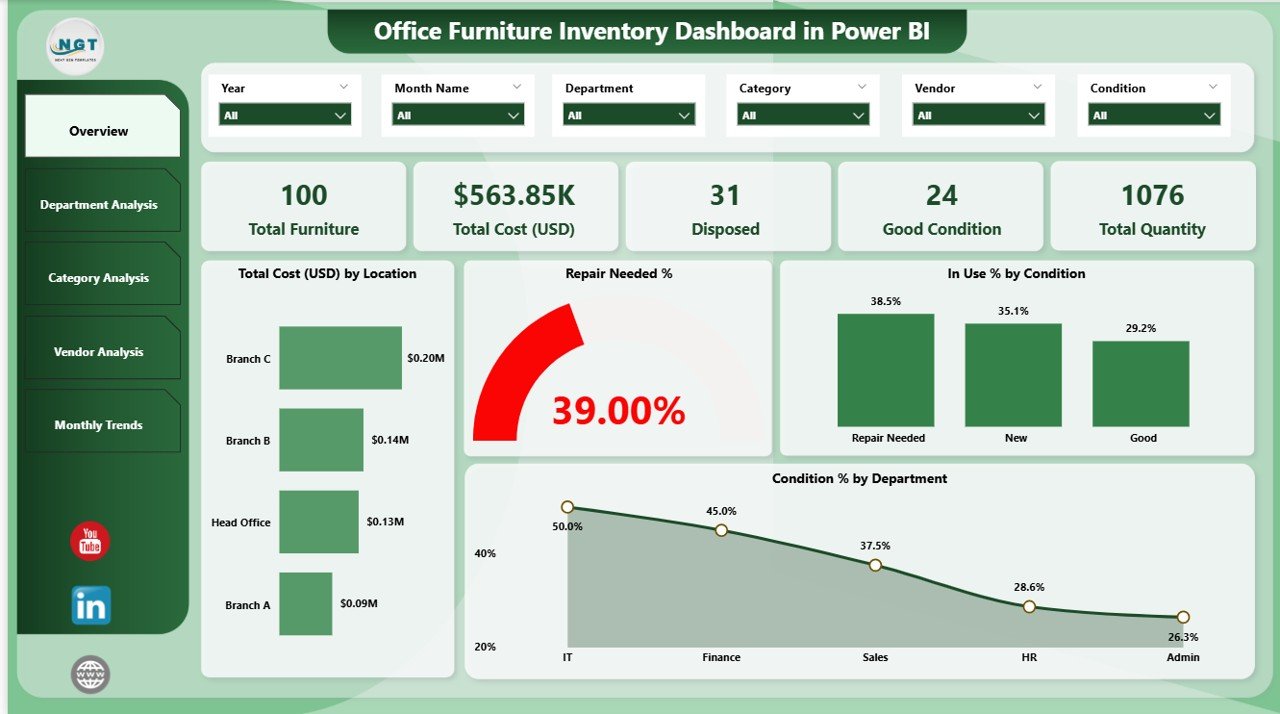
Overview Page
-
5 KPI Cards: Total Cost, Repair Needed %, In Use %, Disposed %, Good Condition %.
-
4 Charts: Costs by location, Repair %, In Use %, and Condition %.
-
-
Department Analysis
-
Total Cost by Department.
-
Repair Needs and Usage % comparisons.
-
Highlights high-cost or underperforming departments.
-
-
Category Analysis
-
Good Condition % by Category.
-
Repair Needed by Category.
-
Condition % distribution for each furniture type.
-
-
Vendor Analysis
-
Disposed % by Vendor.
-
Good Condition % by Vendor.
-
In Use % by Vendor for performance tracking.
-
-
Monthly Trends
-
Repair Needed %, Disposal %, and Cost over time.
-
Detect seasonal patterns and forecast budgets.
-
🛠 How to Use the Dashboard
-
Update Excel File – Enter monthly asset data in the source file.
-
Refresh Power BI – Dashboards auto-update with new insights.
-
Navigate Pages – Use slicers and filters for deep analysis.
-
Monitor KPIs – Keep an eye on repair %, usage %, and disposal rates.
-
Take Action – Reallocate budgets, plan maintenance, and negotiate with vendors.
👥 Who Can Benefit from the Office Furniture Inventory Dashboard?
-
🏢 Corporate Offices – Track assets across multiple branches.
-
🎓 Educational Institutions – Manage classroom & office furniture.
-
🏥 Healthcare Facilities – Monitor medical beds, chairs, and specialized assets.
-
🏛 Government Departments – Ensure accountability in public asset usage.
-
🚀 SMEs – Control purchases, extend asset life, and reduce waste.
✅ Why Choose This Dashboard?
Unlike static spreadsheets, this Power BI dashboard is interactive, automated, and visually powerful. It ensures decision-makers always have accurate, real-time insights on furniture costs, usage, repairs, and vendor performance. From forecasting budgets to cutting waste, this tool transforms asset management into a data-driven process.
Click here to read the Detailed blog post
👉 Visit our YouTube channel to learn step-by-step video tutorials


Reviews
There are no reviews yet.