Are you still managing nuclear plant performance with scattered spreadsheets and manual reports? Stop risking delays, missed targets, and safety blind spots. The Nuclear Energy Operations KPI Dashboard in Excel is your all-in-one performance command center designed to track safety, operations, maintenance, and financial KPIs with clarity and precision.
This ready-to-use Excel dashboard helps you monitor MTD and YTD performance, compare targets vs actuals, analyze historical trends, and improve regulatory compliance — all from one structured system. If you want better control, faster decisions, and stronger operational stability, this dashboard is built for you.
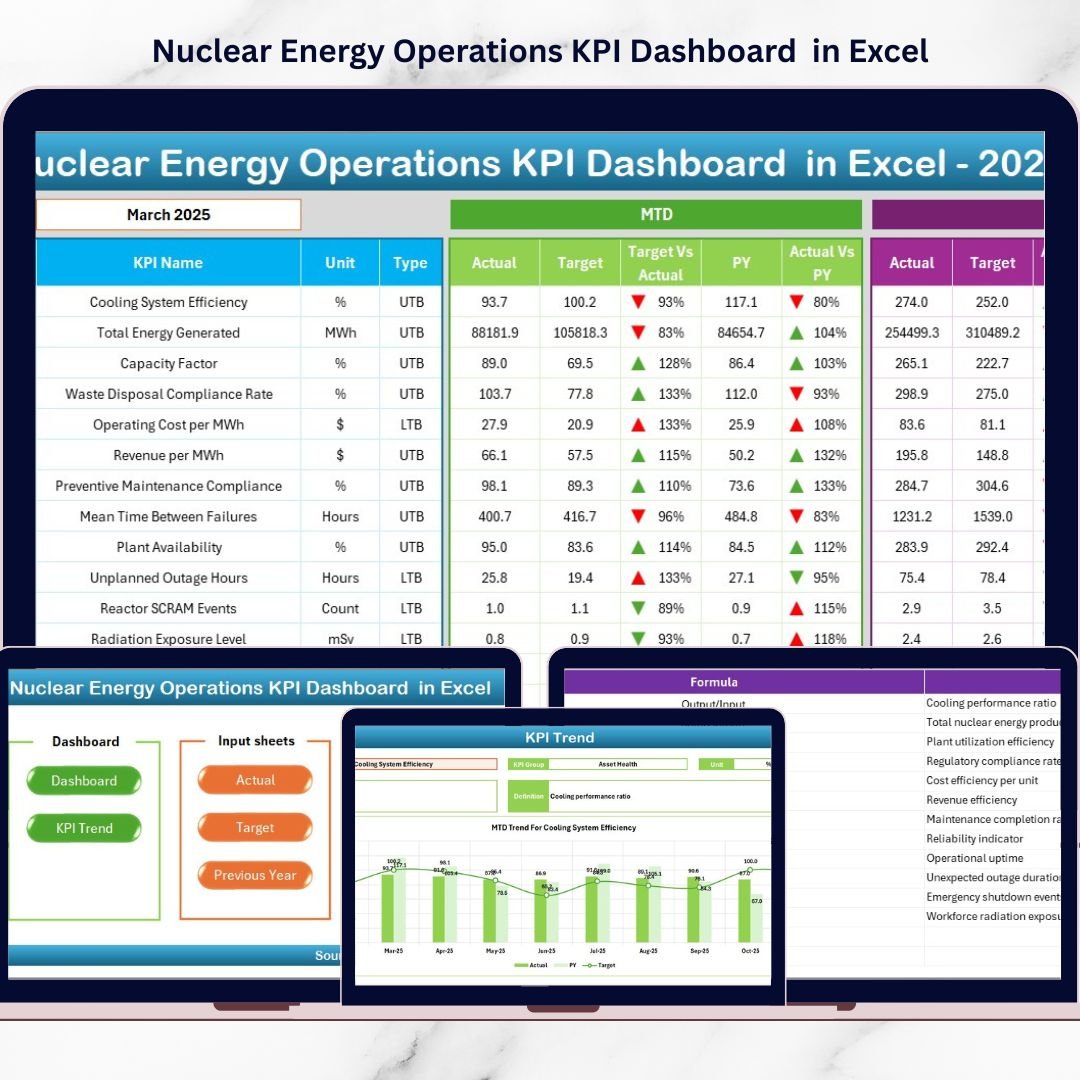
🚀 Key Feature of Nuclear Energy Operations KPI Dashboard in Excel
This powerful dashboard includes 7 fully structured worksheets designed for complete operational visibility:
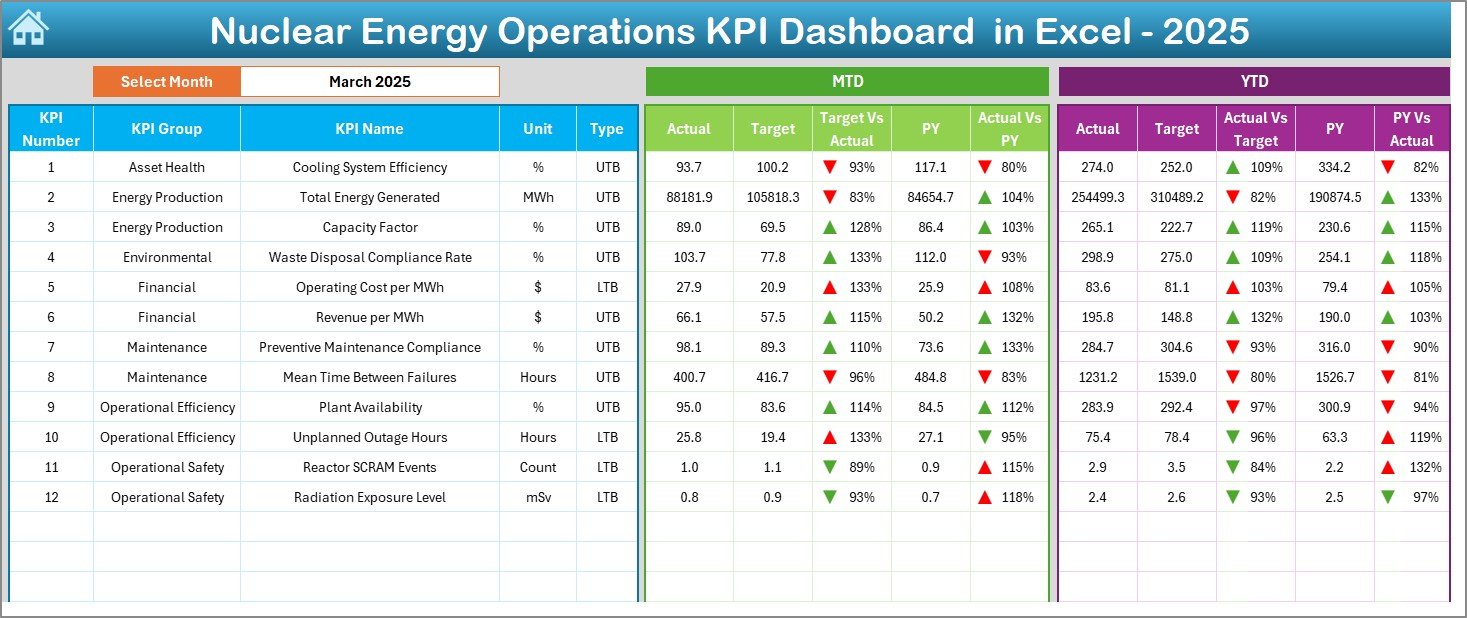
✅ Interactive Month Selection (Cell D3) – Instantly switch months and watch the entire dashboard update automatically.
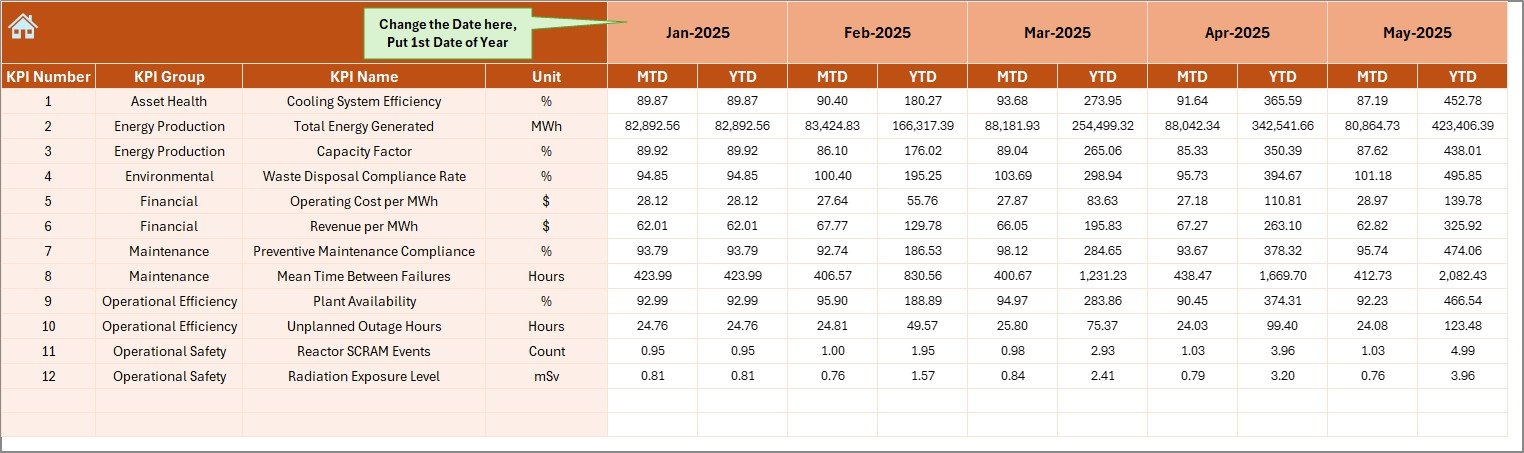
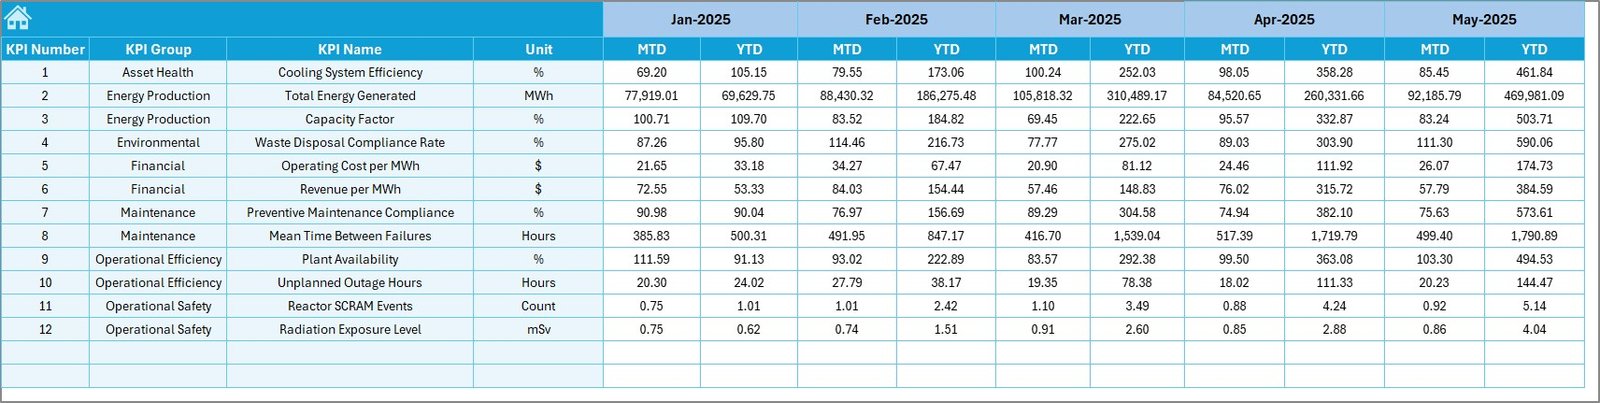
✅ MTD & YTD Tracking – Monitor Actual, Target, and Previous Year comparisons side by side.
✅ Conditional Formatting Indicators – Up and down arrows highlight performance trends immediately.
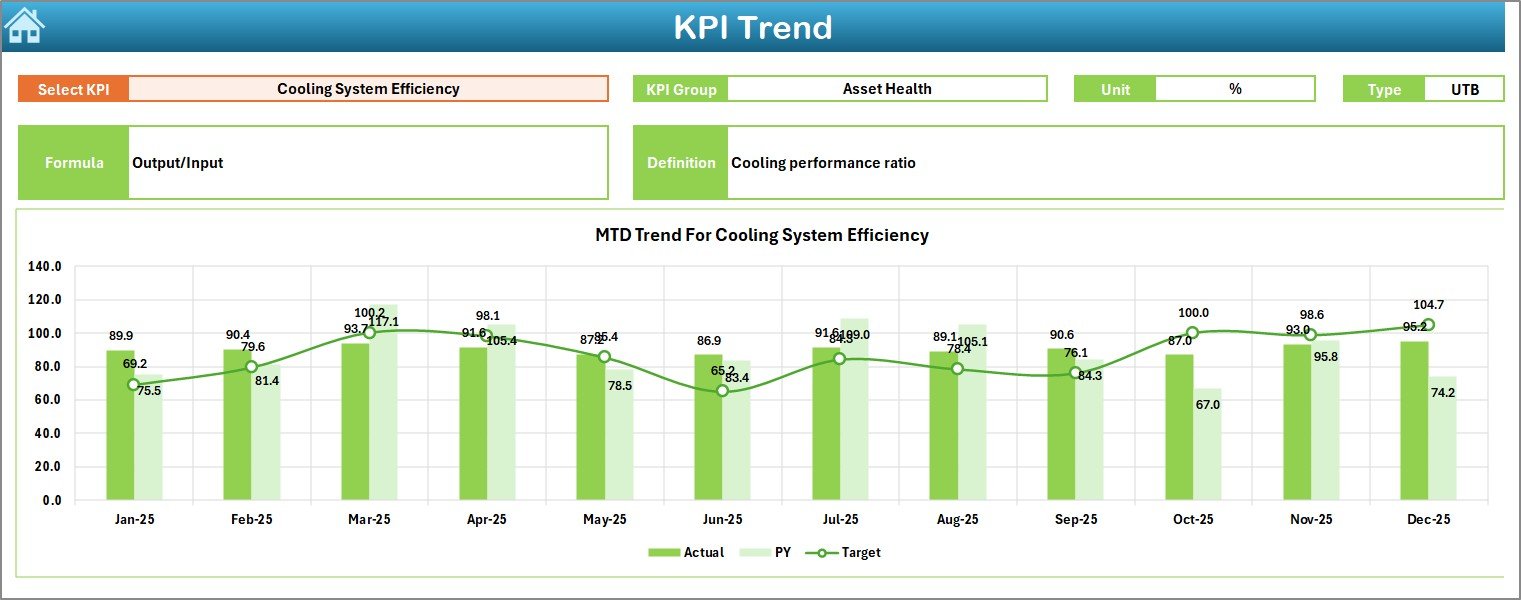
✅ Trend Analysis Sheet – Deep-dive into KPI performance with dynamic charts.
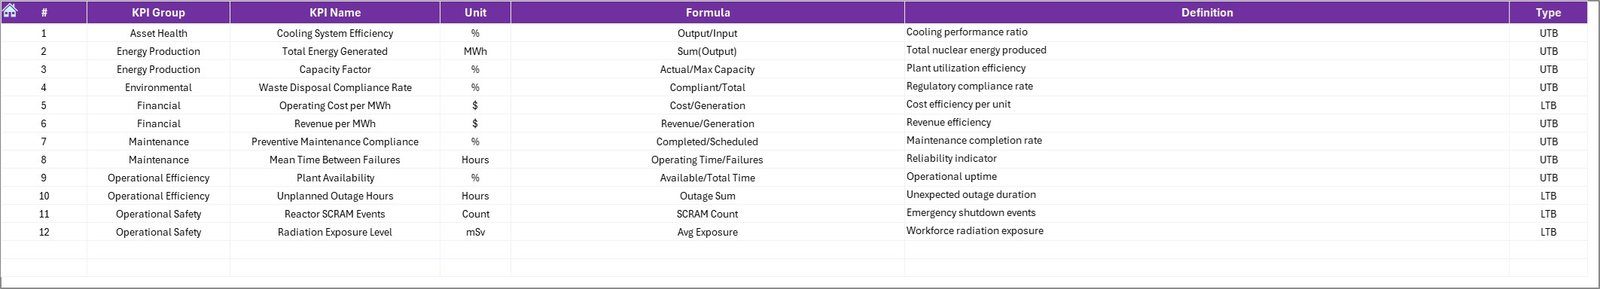
✅ KPI Definition & Formula Documentation – Clear KPI logic to avoid confusion.
✅ Separate Target & Actual Input Sheets – Organized and structured data entry system.
✅ Historical Comparison Module – Analyze long-term performance improvements or declines.
Every sheet works together to create a seamless and professional reporting system.
📦 What’s Inside the Nuclear Energy Operations KPI Dashboard in Excel
When you download this product, you receive a complete KPI monitoring framework:
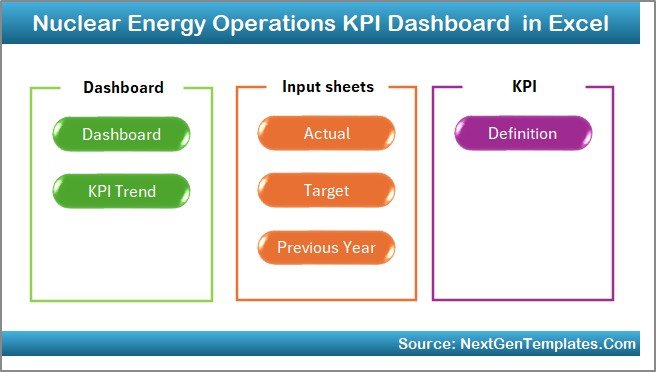
📊 Summary Page – Easy navigation with 6 smart buttons.
📊 Main Dashboard Sheet – Centralized KPI performance overview.
📊 Trend Analysis Sheet – MTD and YTD charts with dynamic comparisons.
📊 Actual Numbers Sheet – Monthly performance data entry panel.
📊 Target Sheet – Define your monthly and yearly goals.
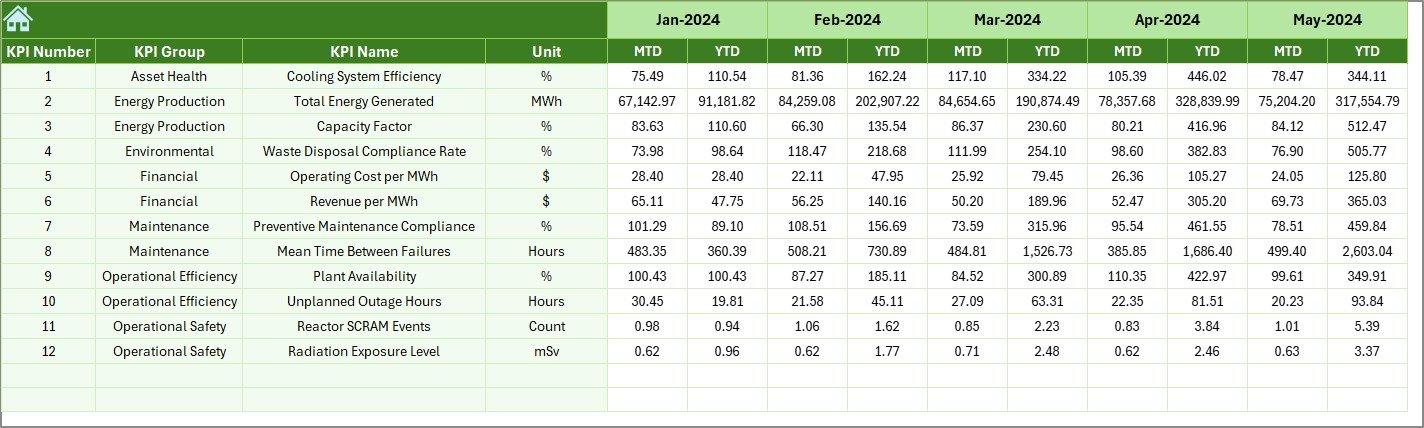
📊 Previous Year Sheet – Enter historical data for comparisons.
📊 KPI Definition Sheet – Store KPI groups, units, formulas, and descriptions.
You can customize KPIs such as:
🔹 Radiation Exposure Levels
🔹 Plant Capacity Factor
🔹 Energy Generation (MWh)
🔹 Unplanned Outage Hours
🔹 Preventive Maintenance Compliance
🔹 Cost per MWh
🔹 Regulatory Compliance Score
The dashboard adapts to your plant’s operational requirements.
⚙️ How to Use the Nuclear Energy Operations KPI Dashboard in Excel
Setting up this dashboard is simple and fast:
1️⃣ Enter KPI details in the KPI Definition Sheet.
2️⃣ Input monthly targets in the Target Sheet.
3️⃣ Enter actual performance numbers in the Actual Sheet.
4️⃣ Add previous year data for historical analysis.
5️⃣ Select the month from cell D3 in the Dashboard Sheet.
6️⃣ Review MTD and YTD comparisons instantly.
7️⃣ Use the Trend Sheet for deeper KPI insights.
Within minutes, you transform raw data into structured performance intelligence.
🎯 Who Can Benefit from This Nuclear Energy Operations KPI Dashboard?
This dashboard is ideal for:
👨💼 Nuclear Plant Managers
🛠 Operations Supervisors
🛡 Safety & Compliance Officers
🔧 Maintenance Heads
📈 Energy Sector Analysts
🏛 Regulatory Monitoring Teams
If your organization demands precision, safety monitoring, and performance transparency, this dashboard becomes your daily decision-support tool.
Why This Dashboard Is a Game-Changer
✔ Improves safety monitoring through clear KPI visibility
✔ Enhances decision-making with real-time comparisons
✔ Saves hours of manual reporting every month
✔ Increases accountability across departments
✔ Supports regulatory compliance tracking
✔ Provides meaningful historical performance insights
Instead of reacting to problems late, you detect risks early and act faster.
Click here to read the Detailed blog post
Watch the step-by-step video tutorial: