
🌍 Nonprofit Organizations Dashboard in Power BI – Empowering Data-Driven Social Impact
Managing a nonprofit organization means balancing purpose with accountability. From fundraising to field projects, every decision must be guided by data. The Nonprofit Organizations Dashboard in Power BI is your one-stop analytical solution — designed to help nonprofits visualize performance, track donations, and measure real-world impact through clear, interactive insights.
Built entirely in Microsoft Power BI, this ready-to-use dashboard integrates data from Excel or other systems to provide a 360° view of funds, beneficiaries, and program outcomes. With live visuals, slicers, and automated KPIs, it transforms complex reports into powerful, easy-to-read dashboards — perfect for executives, donors, and program managers alike.
⚙️ Key Features of the Nonprofit Organizations Dashboard in Power BI
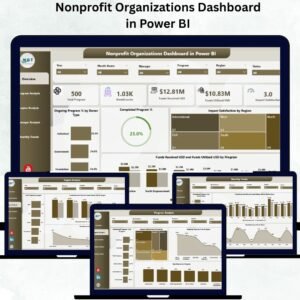
🏠 1️⃣ Overview Page – At-a-Glance Impact Summary
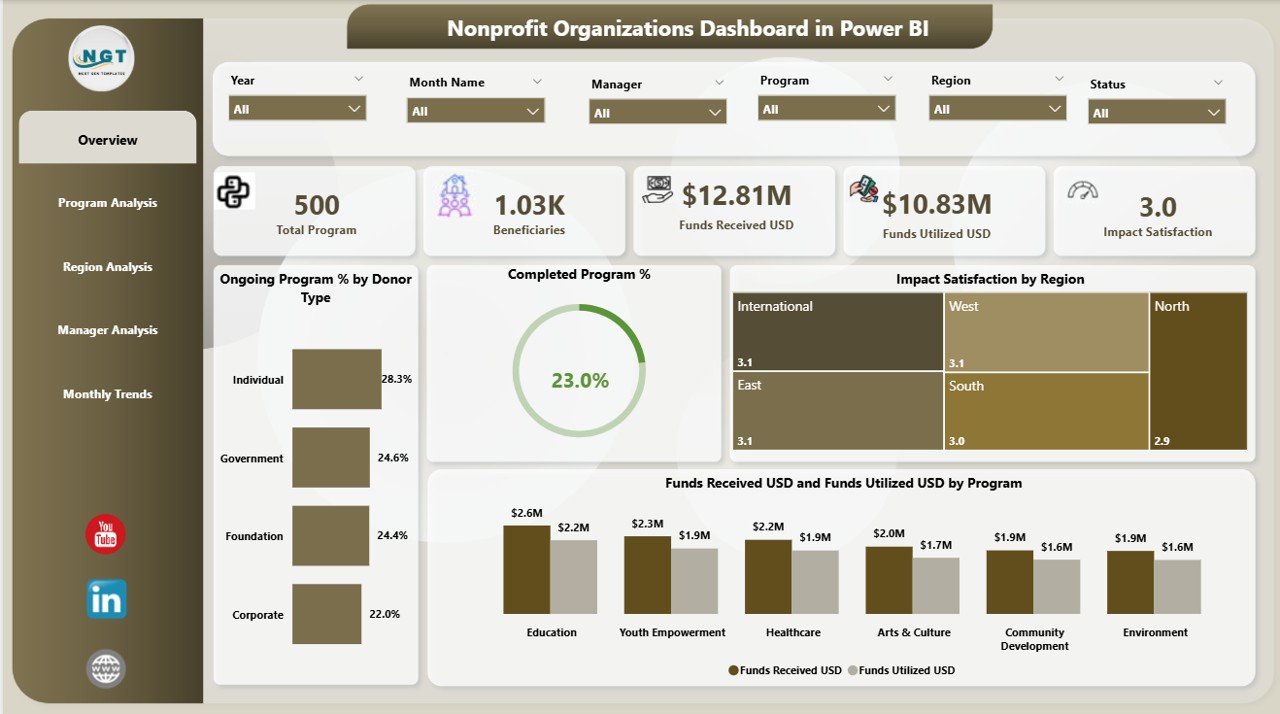
Your command center for nonprofit performance.
-
🎚️ Slicers: Filter by month, donor type, or program.
-
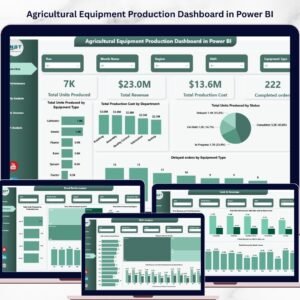
💳 KPI Cards: Total Programs, Funds Received (USD), Funds Utilized (USD), Ongoing Programs %, Completed Programs %.
-
📊 Charts:
-
Ongoing Program % by Donor Type
-
Completed Program %
-
Impact Satisfaction by Region
-
Funds Received vs Funds Utilized by Program
-
💡 Instantly evaluate financial efficiency and impact performance across the organization.
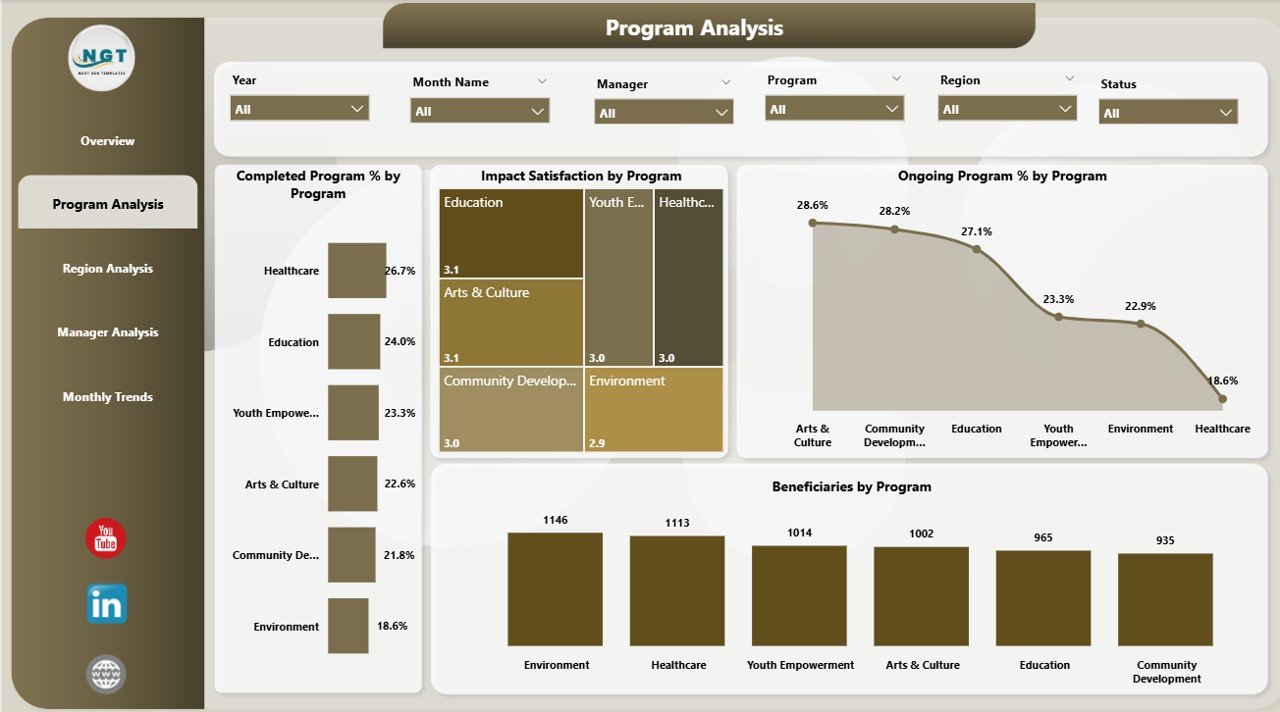
🧩 2️⃣ Program Analysis Page – Measure Project Success
Dive into detailed program metrics to evaluate what’s working best.
-
Completed Program % by Program
-
Impact Satisfaction by Program
-
Ongoing Program % by Program
-
Beneficiaries by Program
📈 Identify which initiatives deliver the most impact and where resources should be reallocated.
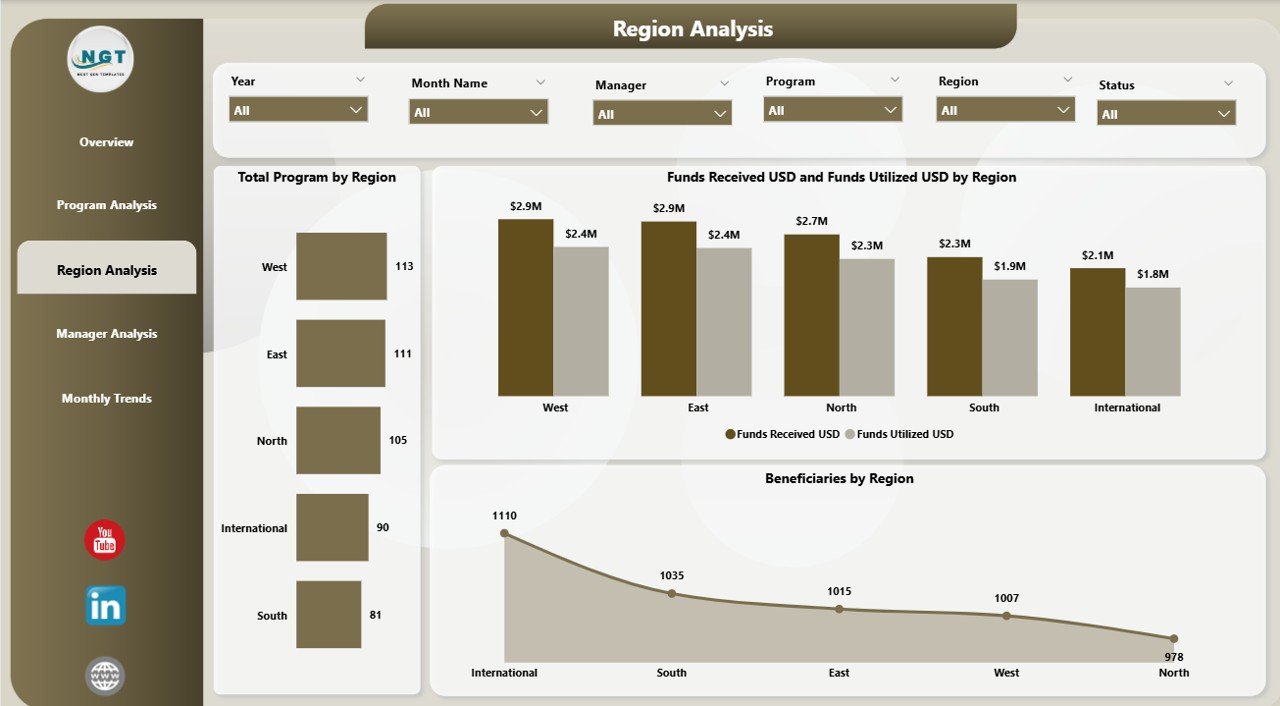
🌎 3️⃣ Region Analysis Page – Compare Geographical Performance
Understand how different regions perform financially and operationally.
-
Total Programs by Region
-
Funds Received vs Funds Utilized by Region
-
Beneficiaries by Region
📍 Helps managers pinpoint under-performing regions and rebalance fund distribution.
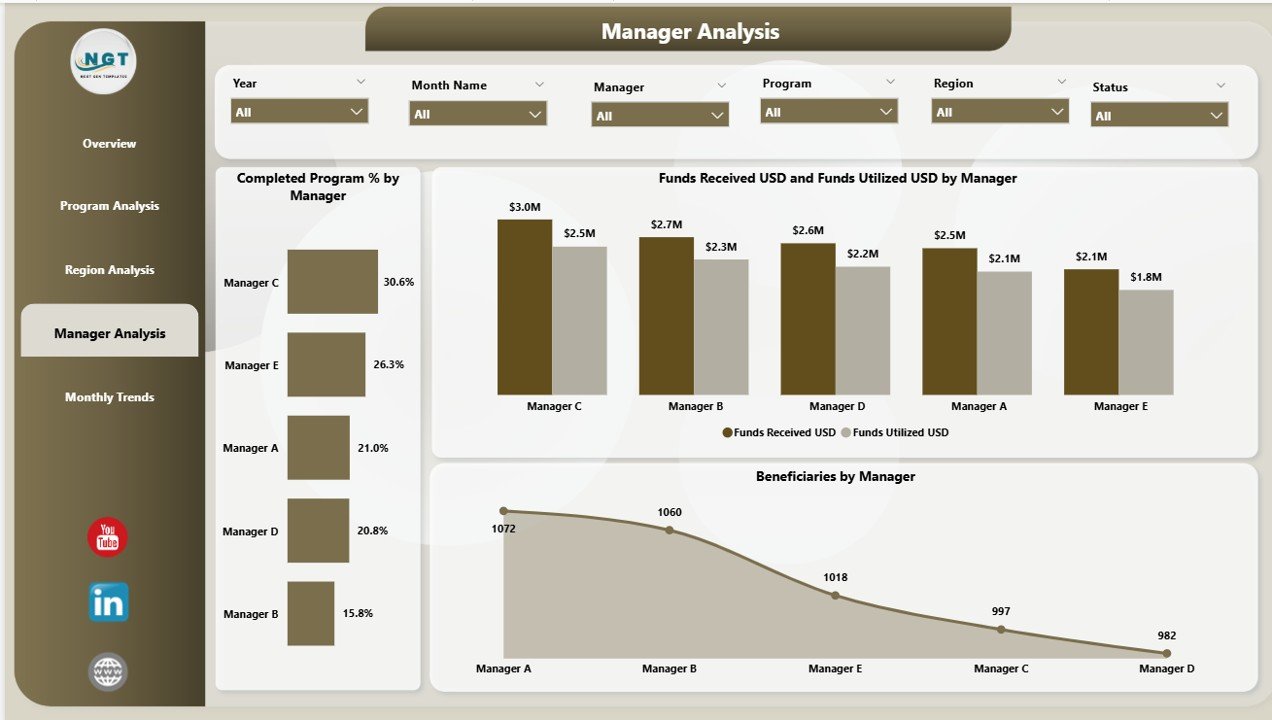
👩💼 4️⃣ Manager Analysis Page – Evaluate Leadership Performance
Track how each manager contributes to program success and fund utilization.
-
Completed Program % by Manager
-
Funds Received vs Funds Utilized by Manager
-
Beneficiaries by Manager
🏆 Recognize top performers and optimize team accountability.
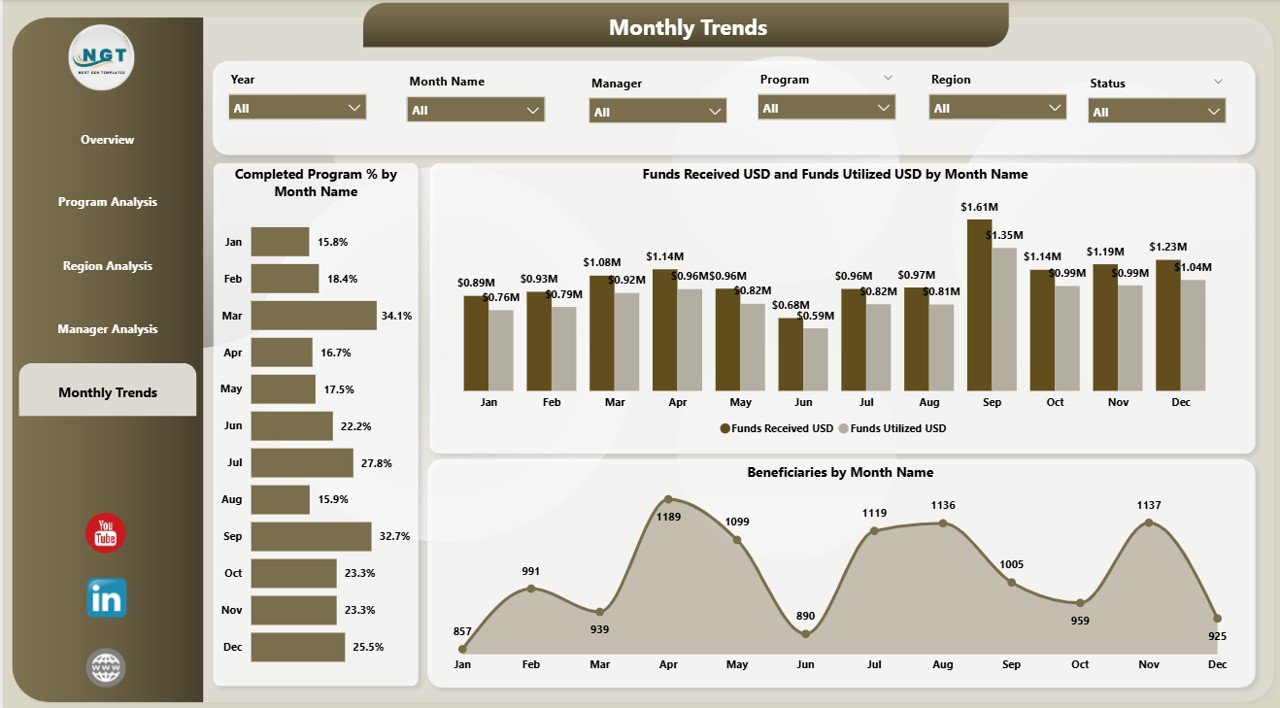
📅 5️⃣ Monthly Trends Page – Track Progress Over Time
Visualize fundraising and program performance month by month.
-
Completed Program % by Month
-
Funds Received vs Funds Utilized by Month
-
Beneficiaries by Month
📊 Spot funding patterns and predict future performance based on seasonal trends.
🌐 Why Nonprofits Need This Dashboard
✅ Data Consolidation: All funding and impact data in one place.
✅ Transparency: Show donors exactly how funds create change.
✅ Efficiency: Automate reports and reduce manual effort.
✅ Strategic Insights: Monitor KPI progress and forecast future needs.
✅ Accessibility: Share securely via Power BI Service or mobile view.
🚀 Advantages of Using Power BI for Nonprofits
-
📈 Comprehensive Visibility – Integrate finance, operations, and impact data.
-
🕒 Time Savings – Automated refresh reduces report prep time.
-
💡 Better Fund Utilization – Spot inefficiencies and optimize spending.
-
🤝 Donor Trust & Transparency – Showcase clear impact reports.
-
⚙️ Customizable – Add KPIs like cost per beneficiary or donor retention.
-
🌍 Integration Ready – Connect with Excel, CRM systems, or cloud data.
💡 How to Use the Dashboard Effectively
1️⃣ Import data from Excel or databases into Power BI.
2️⃣ Refresh data to see updated funding and program metrics.
3️⃣ Navigate using slicers to filter by donor, program, or region.
4️⃣ Analyze KPIs on the Overview page for organizational health.
5️⃣ Publish to Power BI Service for boards and donor presentations.
✨ Within minutes, your nonprofit team can see the real impact of every dollar spent.
🧭 Who Can Benefit from This Dashboard?
-
💼 Executive Directors – Assess organizational impact instantly.
-
💰 Donor Relations Teams – Provide transparent fund reports.
-
🧩 Program Managers – Monitor performance and beneficiaries.
-
📊 Analysts – Evaluate fund utilization and regional effectiveness.
-
🕊️ Nonprofit Boards & Foundations – Track progress toward strategic goals.
🔗 Click Here to Read the Detailed Blog Post
📺 Visit Our YouTube Channel for Step-by-Step Tutorials
👉 YouTube.com/@PKAnExcelExpert


Reviews
There are no reviews yet.