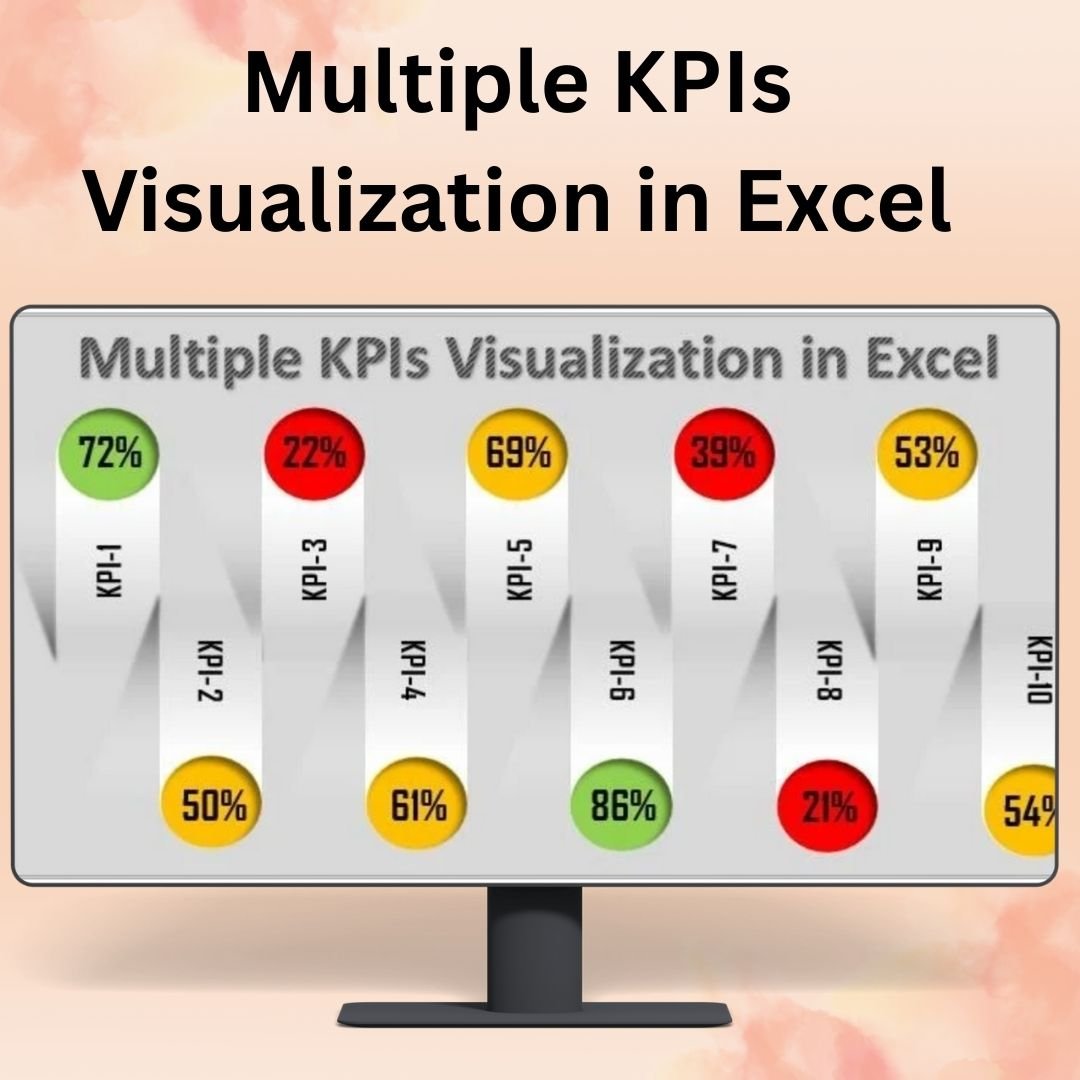
The Multiple KPIs Visualization in Excel tool is a robust and customizable solution designed to help businesses and teams visualize and track multiple key performance indicators (KPIs) in a single, comprehensive dashboard. This Excel tool allows you to combine various KPIs, such as sales, project progress, budget variances, and more, into one unified view, giving you the power to monitor and analyze performance across multiple areas simultaneously.
With dynamic charts, customizable data fields, and real-time updates, this tool allows you to make data-driven decisions by providing clear visual insights into your KPIs. Whether you are managing a sales team, overseeing a project, or tracking financial performance, this tool provides a simple yet powerful way to monitor progress, set targets, and track performance in real-time.
Key Features of the Multiple KPIs Visualization in Excel:
📊 Comprehensive KPI Dashboard
Visualize multiple KPIs in one place with a dynamic and interactive dashboard that consolidates your data into clear and actionable charts.
📈 Customizable Charts and Metrics
Tailor the dashboard to your specific needs by adding or removing KPIs, adjusting chart types, and modifying the appearance of each visualization.
🔄 Real-Time Data Updates
The dashboard updates automatically as new data is entered, providing you with up-to-date performance insights at all times.
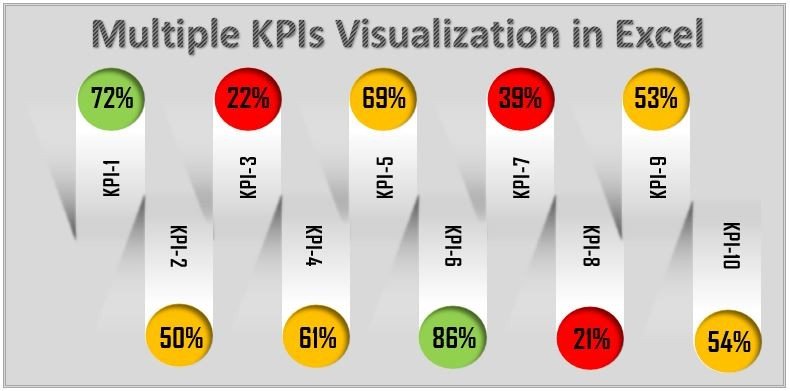
🎨 Color-Coded KPIs
Use color coding to highlight KPIs that are on target, above expectations, or falling behind, making it easy to spot areas that need attention.
💼 User-Friendly Interface
The intuitive Excel interface makes it easy to set up, use, and customize, even for users with limited Excel experience.
Why You’ll Love the Multiple KPIs Visualization in Excel:
✅ Track Multiple KPIs in One Place – Monitor various performance metrics, such as sales, project completion, and financial health, in a single dashboard. ✅ Make Data-Driven Decisions – Gain immediate insights into how your KPIs are performing and adjust your strategies as necessary. ✅ Real-Time Monitoring – As new data is entered, the dashboard automatically updates, ensuring you always have the latest performance metrics. ✅ Customizable for Your Needs – Adapt the dashboard to fit your specific business objectives, with customizable charts and KPIs. ✅ Easy to Use and Set Up – Get started with minimal effort and use the tool to track your KPIs efficiently, even if you’re not an Excel expert.
What’s Inside the Multiple KPIs Visualization in Excel:
- Dynamic KPI Dashboard – Visualize and track multiple KPIs in one clear, interactive dashboard.
- Customizable Chart Types – Choose from various chart types, including bar charts, line graphs, and pie charts, to best represent your data.
- Real-Time Updates – Automatically update the dashboard as new data is entered, keeping your performance tracking current.
- Color-Coded Indicators – Easily spot areas of concern with color-coded KPIs that highlight performance deviations.
- Simple Setup and Use – An intuitive interface ensures that anyone can use the tool to track KPIs effectively.
How to Use the Multiple KPIs Visualization in Excel:
1️⃣ Download the Template – Access your Excel file instantly after purchase. 2️⃣ Input Your Data – Enter the data for the KPIs you wish to track (sales, project progress, etc.). 3️⃣ Customize the Dashboard – Tailor the charts and KPI metrics to reflect the most important aspects of your business. 4️⃣ Monitor Performance – Use the dashboard to track performance in real-time and make data-driven decisions.
Who Can Benefit from the Multiple KPIs Visualization in Excel:
- Business Owners
- Project Managers
- Sales Teams
- Marketing Teams
- Financial Analysts
- Operations Managers
- Anyone tracking multiple performance metrics at once
The Multiple KPIs Visualization in Excel tool is a powerful solution for businesses and teams looking to monitor and analyze key performance indicators in a clear, concise, and actionable way. Track multiple KPIs, monitor performance, and make data-driven decisions to improve your business operations.
Click here to read the Detailed blog post
https://www.pk-anexcelexpert.com/multiple-kpis-visualization-in-excel/


Reviews
There are no reviews yet.