
The Multi-color Data bar with REPT function is a visually engaging tool that allows you to display your data with dynamic multicolor bars, adding a new level of interactivity to your Excel reports and dashboards. This unique chart uses the REPT function to create data bars directly within your cells, offering a professional and interactive way to track and display performance, progress, or any data with varying magnitudes.
With multicolor formatting, you can differentiate various ranges of values within the same data set. This makes it easier to spot trends, outliers, and key performance indicators (KPIs) at a glance. Whether you’re monitoring sales targets, employee performance, or any other data, this tool will enhance your ability to analyze and communicate data effectively.

Key Features of the Multicolor Data Bar with REPT Function in Excel
📌 Multicolor Bars for Visual Impact
The multicolor data bars allow you to create a visually striking representation of your data. With each range of values represented by a different color, the data bars help you easily identify performance levels, from low to high, and instantly spot trends.
🛠 REPT Function for Dynamic Bar Creation
The REPT function in Excel is used to repeat characters within a cell, which is the magic behind the multicolor bars. This dynamic function allows you to create custom-length bars that change based on the data values, giving you real-time updates as your data changes.
💡 Customizable Color Ranges
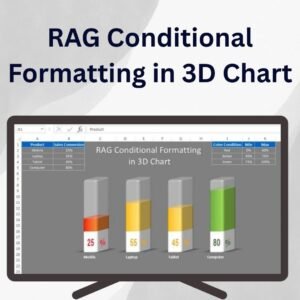
Customize the color ranges to reflect specific thresholds or performance categories. For example, you can use red for low values, yellow for moderate values, and green for high values, making it easier to interpret your data at a glance.
🔢 Easy Data Tracking
Track and monitor a wide range of values in one glance. This tool is perfect for tracking performance, sales progress, employee KPIs, and more. The data bars will automatically adjust to the values you enter, providing instant visual feedback.
🚀 Dynamic Real-Time Updates
As your data changes, the data bars automatically adjust to reflect the new values. This ensures that your chart is always up-to-date, allowing you to monitor progress and performance in real time.
📊 Clear and Professional Visuals
The multicolor data bars offer a clean and professional design, making them ideal for business presentations, reports, and dashboards. They help you communicate insights effectively, making complex data easier to understand.
⚙ Simple Setup and Customization
Setting up and customizing the multicolor data bars is simple. With clear instructions and easy-to-follow steps, you can integrate this powerful tool into your Excel files with minimal effort.
🚀 Why You’ll Love the Multicolor Data Bar with REPT Function in Excel
✅ Dynamic and Interactive – Real-time updates with dynamic data bars that change as your data changes. ✅ Visually Engaging – Multicolor bars offer an easy-to-understand, clear view of your data. ✅ Customizable Colors – Tailor the colors to represent different performance ranges or thresholds. ✅ Easy Setup – Simple to set up and customize without advanced Excel skills. ✅ Real-Time Updates – The bars adjust automatically as new data is entered, keeping your data current.
📂 What’s Inside the Multicolor Data Bar with REPT Function in Excel?
- Multicolor Data Bars: Use the REPT function to create dynamic, visually impactful data bars in Excel.
- Customizable Color Ranges: Modify the color scheme to suit your needs, such as red, yellow, and green for different performance levels.
- Real-Time Data Updates: Automatically update the data bars as your data changes.
- Clear Instructions: Simple, step-by-step guide to help you set up and customize the data bars.
🔍 How to Use the Multicolor Data Bar with REPT Function in Excel
1️⃣ Download the Template – Get instant access to the Excel file upon purchase. 2️⃣ Enter Your Data – Input the data that you want to track, such as sales, performance, or any other metric. 3️⃣ Customize the Color Ranges – Adjust the color thresholds to fit your needs (e.g., low, medium, and high values). 4️⃣ Track Progress – Use the multicolor data bars to visually track and monitor your data in real-time. 5️⃣ Present and Share – Use the dynamic bars in reports, presentations, or dashboards for clear communication of your data insights.
🎯 Who Can Benefit from the Multicolor Data Bar with REPT Function in Excel? 🔹 Business Analysts
🔹 Project Managers
🔹 Sales Teams
🔹 Financial Analysts
🔹 Marketing Teams
🔹 Anyone tracking data with varying performance levels
Enhance your data analysis and visualization with the Multicolor Data Bar with REPT Function in Excel. This tool makes it easy to track progress, visualize performance, and communicate insights in a visually appealing and professional way.
Click here to read the Detailed blog post Multi-color Data bar with REPT function
https://www.pk-anexcelexpert.com/multicolor-data-bar-with-rept-function/


Reviews
There are no reviews yet.