Managing mortgage lending operations without real-time visibility often results in delayed approvals, revenue leakage, compliance risks, and missed growth opportunities. In a highly competitive and data-driven lending environment, mortgage lenders can no longer depend on scattered spreadsheets, emails, or static reports. That is exactly why the Mortgage Lenders Dashboard in Excel becomes a powerful, practical, and business-ready solution.
The Mortgage Lenders Dashboard in Excel is a ready-to-use analytical Excel dashboard designed to help lenders track, monitor, and analyze mortgage loan performance from a single centralized file. Instead of manually consolidating reports, this dashboard converts raw mortgage data into clear KPIs, interactive charts, slicers, and trend insights that decision-makers can understand instantly.
Built entirely in Microsoft Excel, this dashboard is cost-effective, flexible, and easy to use—without requiring advanced Excel skills or expensive BI tools.
⭐ Key Features of Mortgage Lenders Dashboard in Excel
📊 Centralized Mortgage KPI Monitoring – All critical loan KPIs in one dashboard
🏠 Loan, Property & Borrower Analysis – Multi-dimensional performance insights
📅 Monthly Trend Tracking – Identify seasonality and demand patterns
🎯 Approval & Disbursement Analysis – Track efficiency and revenue flow
💰 Processing Fee & EMI Insights – Understand income and repayment behavior
🎛️ Interactive Slicers – Filter by month, loan type, borrower type, region
📈 Pivot-Based Charts & KPI Cards – Fast, accurate insights
⚙️ 100% Excel-Based Solution – No external tools or add-ins required
📦 What’s Inside the Mortgage Lenders Dashboard in Excel
This dashboard is thoughtfully designed with multiple analytical pages, each serving a specific business purpose.
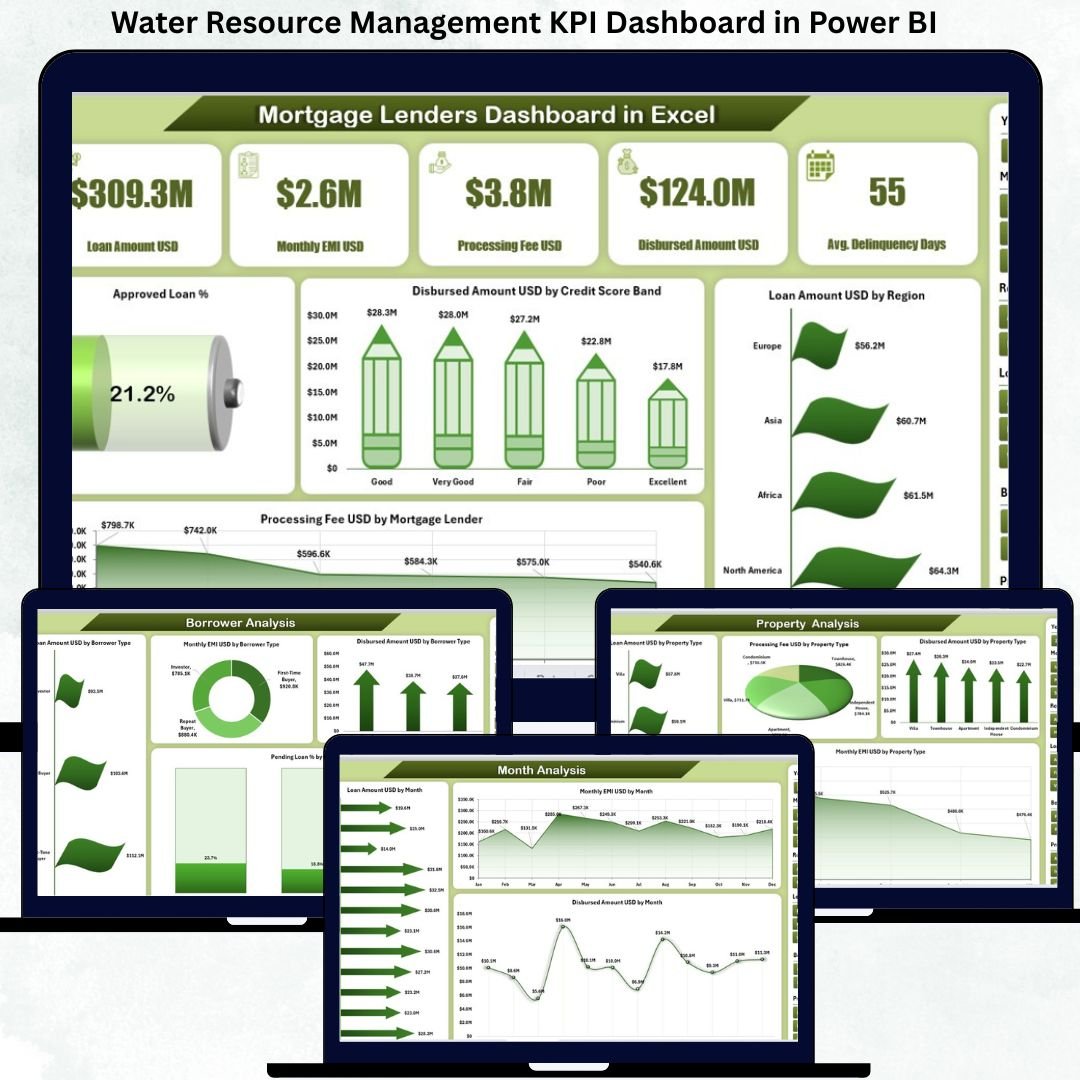
🏠 Overview Page
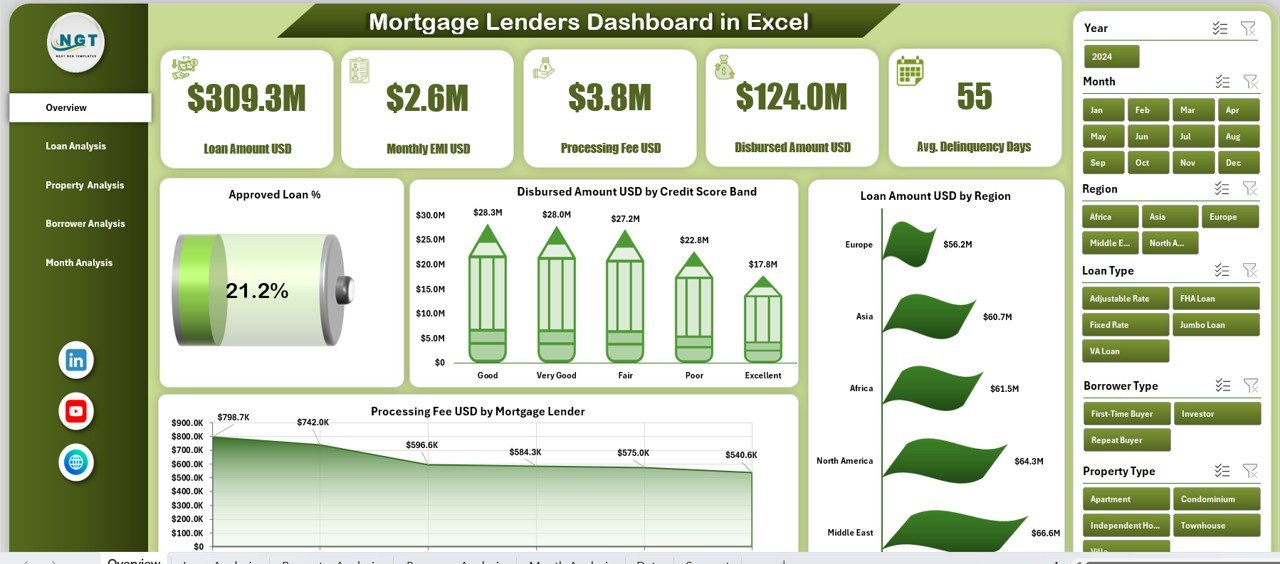
The Overview Page acts as the command center of the dashboard.
You get:
-
5 KPI Cards showing high-level performance
-
Right-side slicer for instant filtering
-
Executive charts, including:
-
Approved Loan %
-
Disbursed Amount by Credit Score Band
-
Loan Amount by Region
-
Processing Fee by Mortgage Lender
-
This page gives leadership an instant snapshot of overall lending health.
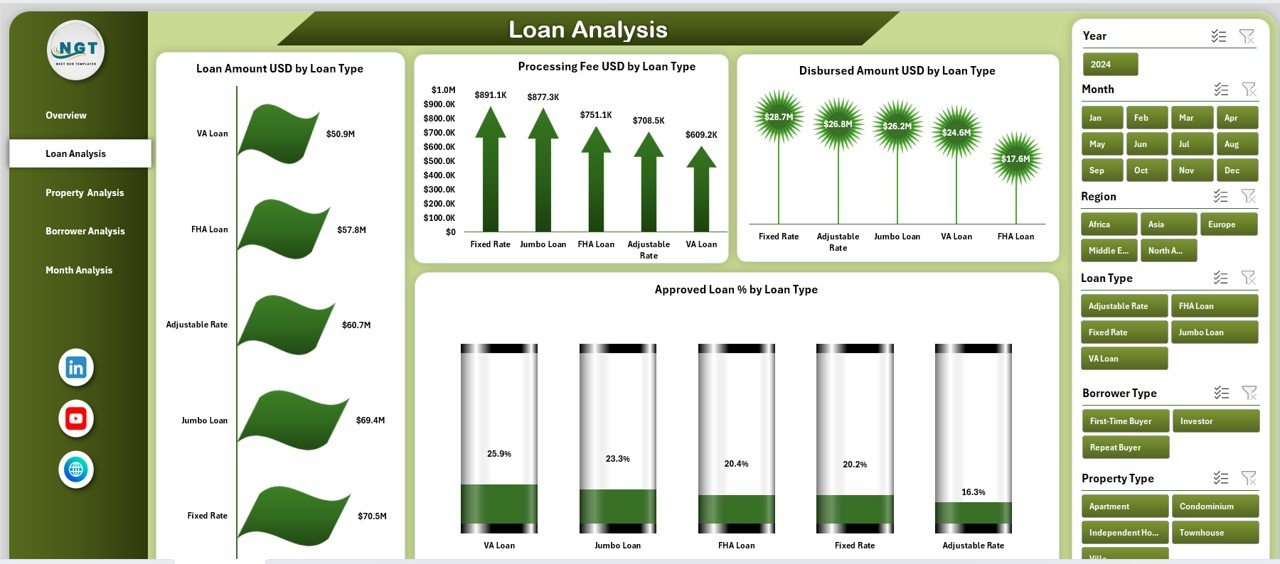
📄 Loan Analysis Page
This page focuses on loan-type performance.
Charts include:
-
Loan Amount by Loan Type
-
Processing Fee by Loan Type
-
Disbursed Amount by Loan Type
-
Approved Loan % by Loan Type
It helps lenders identify high-performing loan products and optimize underwriting strategies.
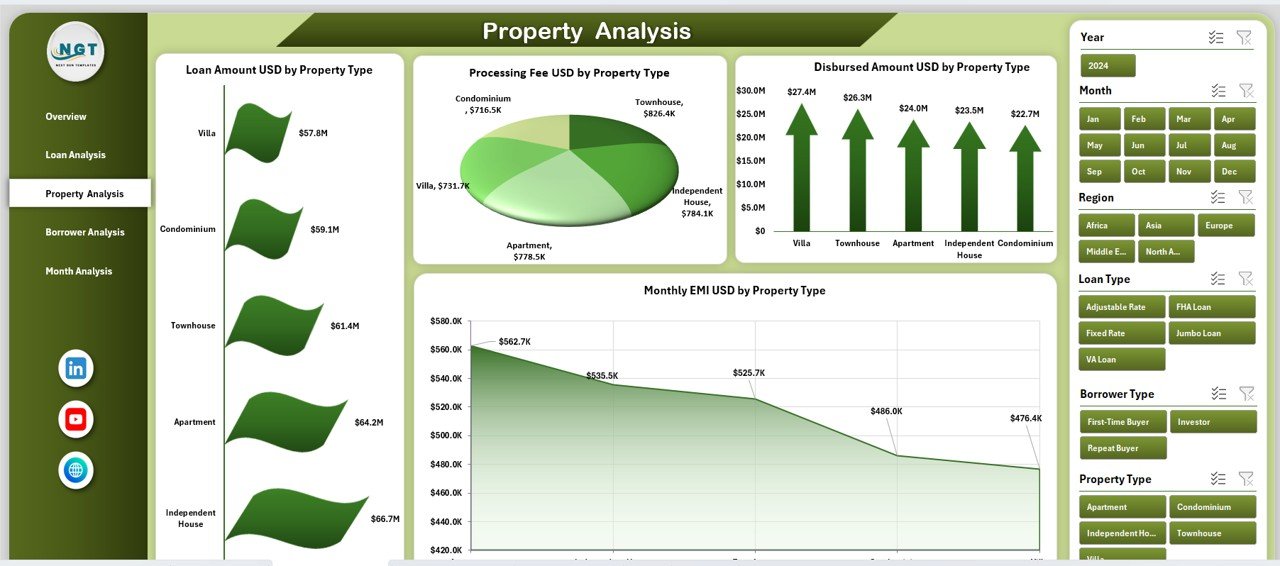
🏘️ Property Analysis Page
This page analyzes performance by property type.
Charts include:
-
Loan Amount by Property Type
-
Processing Fee by Property Type
-
Disbursed Amount by Property Type
-
Approved Loan % by Property Type
Lenders can clearly see which property categories drive growth and risk.
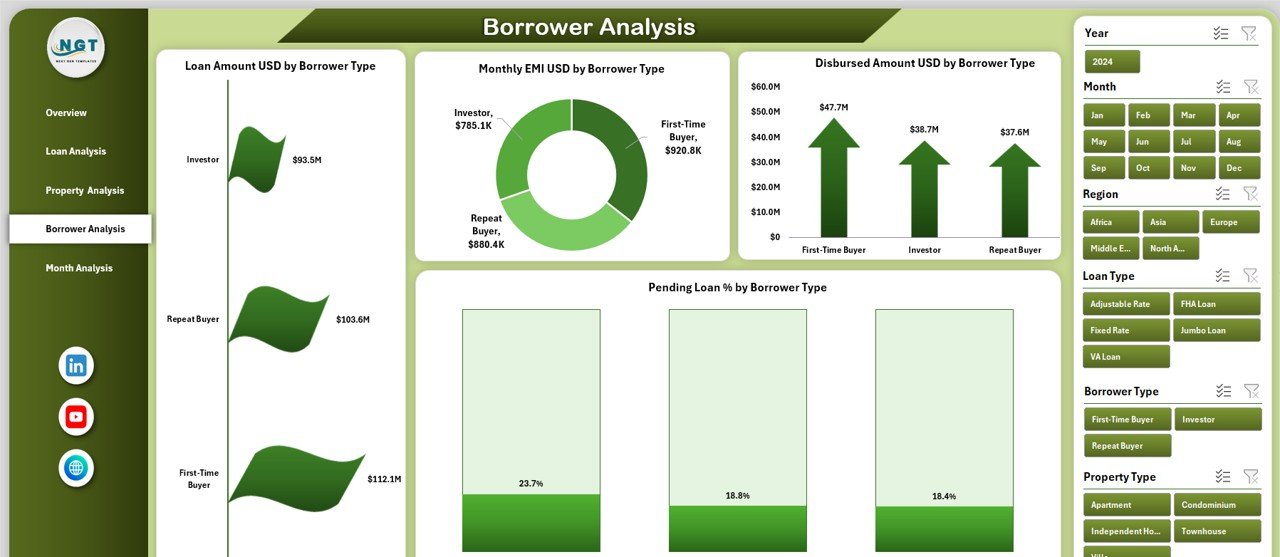
👤 Borrower Analysis Page
This page focuses on borrower behavior and risk profiling.
Charts include:
-
Loan Amount by Borrower Type
-
Monthly EMI by Borrower Type
-
Disbursed Amount by Borrower Type
-
Pending Loan % by Borrower Type
As a result, lenders can design targeted lending strategies and reduce default risk.
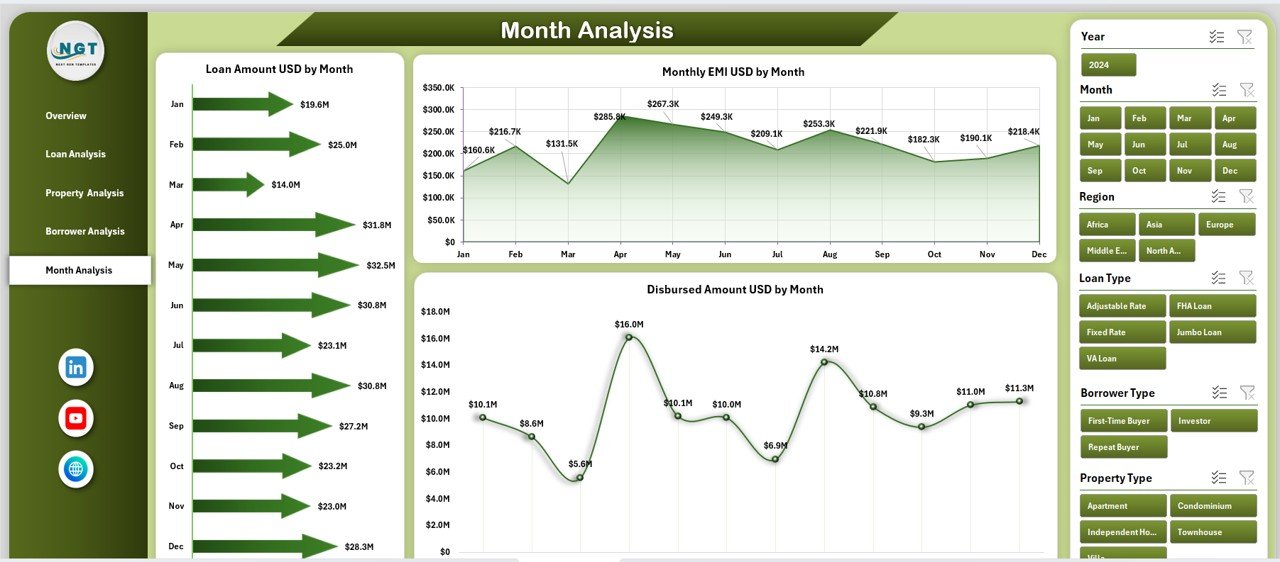
📅 Month Analysis Page
This page tracks month-wise lending trends.
Charts include:
-
Loan Amount by Month
-
Monthly EMI by Month
-
Disbursed Amount by Month
It supports forecasting, liquidity planning, and seasonal demand analysis.
⚙️ Backend Sheets
-
Data Sheet – Stores raw mortgage data in structured format
-
Support Sheet – Handles calculations, mappings, and pivot logic
These sheets keep the dashboard clean, stable, and easy to maintain.
🛠️ How to Use the Mortgage Lenders Dashboard
1️⃣ Enter or update loan data in the Data Sheet
2️⃣ Refresh pivot tables (if required)
3️⃣ Use slicers to filter by month, loan type, borrower, or region
4️⃣ Review KPI cards and charts
5️⃣ Make faster, data-driven lending decisions
👥 Who Can Benefit from This Dashboard
-
Mortgage Lenders
-
Loan Officers
-
Credit & Risk Analysts
-
Finance Teams
-
Compliance Teams
-
Senior Management
Whether you are a small lender or a growing mortgage firm, this dashboard adapts easily.
### 📘 Click here to read the Detailed blog post
📺 Visit our YouTube channel to learn step-by-step video tutorials
👉 https://youtube.com/@PKAnExcelExpert


Reviews
There are no reviews yet.