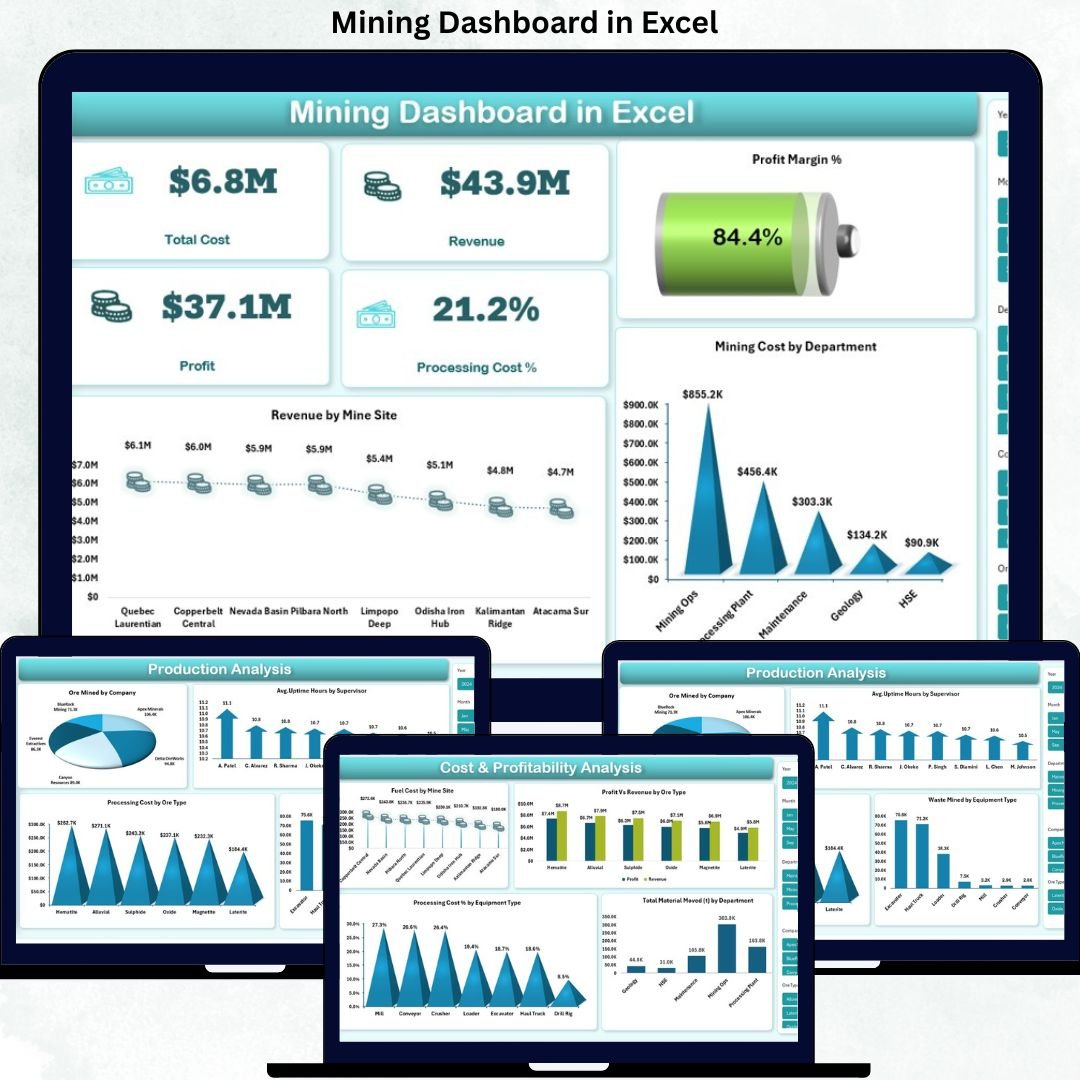
Managing mining operations without real-time visibility can quickly lead to rising costs, inefficiencies, and compliance risks. Mining involves complex processes—production, equipment utilization, cost control, safety, and ESG performance—all of which demand clear, timely insights. That is exactly why the Mining Dashboard in Excel is a powerful, practical, and business-ready solution.
This ready-to-use Mining Dashboard in Excel transforms raw mining data into clear KPIs, visual insights, and actionable reports—without expensive BI tools or technical complexity. Built entirely in Excel, it empowers decision-makers to monitor performance, identify risks, and improve profitability with confidence.
🔑 Key Features of Mining Dashboard in Excel
📊 All-in-One Performance View
Track operational, financial, equipment, and safety KPIs from a single, centralized Excel dashboard.
📅 Department & Site-Wise Analysis
Analyze performance by mine site, department, ore type, equipment type, or company using slicers and filters.
💰 Cost & Profitability Tracking
Monitor total cost, revenue, profit, processing cost %, and profit margin % in a clear visual format.
⚙️ Equipment & Downtime Insights
Identify downtime causes, inefficiencies, and equipment performance issues before they impact production.
🌱 Safety & ESG Monitoring
Track CO₂ emissions, waste mined, and safety incidents to support sustainability and compliance reporting.
📈 Interactive Charts & KPIs
Dynamic charts and pivot-based KPIs update instantly with data changes.
🧠 Decision-Ready Insights
Convert complex mining data into clear insights for faster and smarter decisions.
📦 What’s Inside the Mining Dashboard in Excel
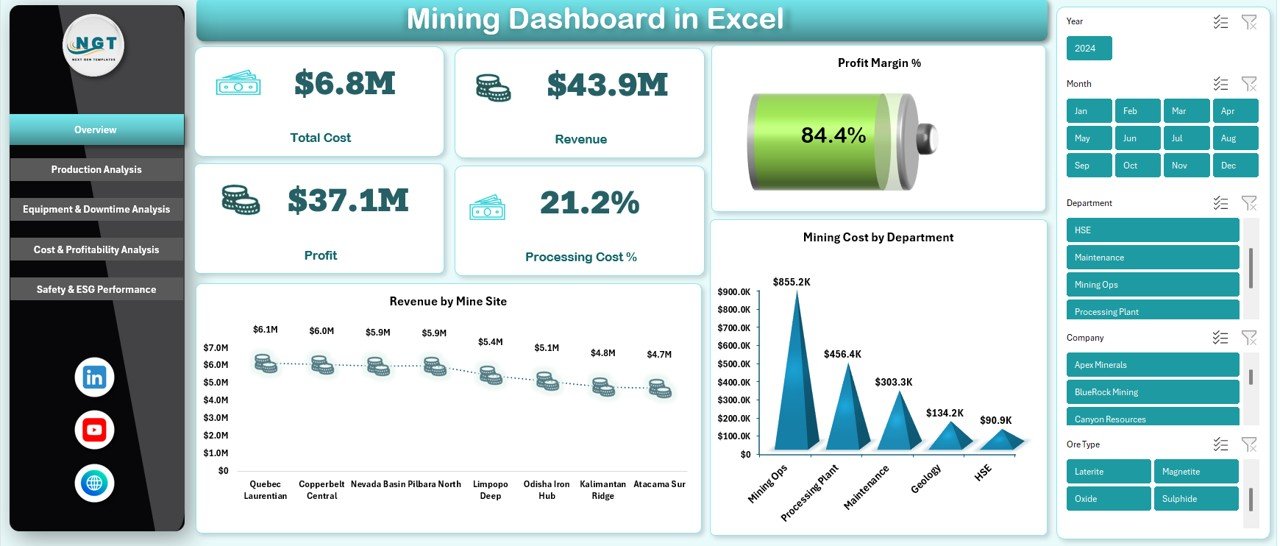
📌 Overview Sheet
High-level snapshot showing Total Cost, Revenue, Profit, Processing Cost %, and Profit Margin %, along with Revenue by Mine Site and Mining Cost by Department.
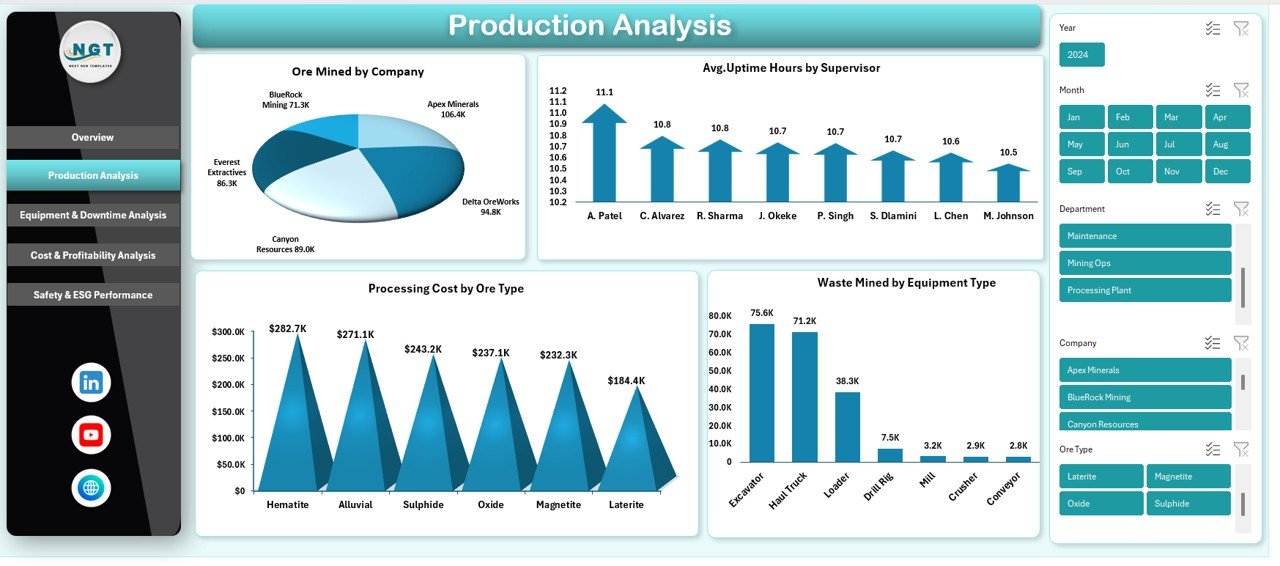
📌 Production Analysis Sheet
Track Ore Mined by Company, Average Uptime Hours by Supervisor, Processing Cost by Ore Type, and Waste Mined by Equipment Type.
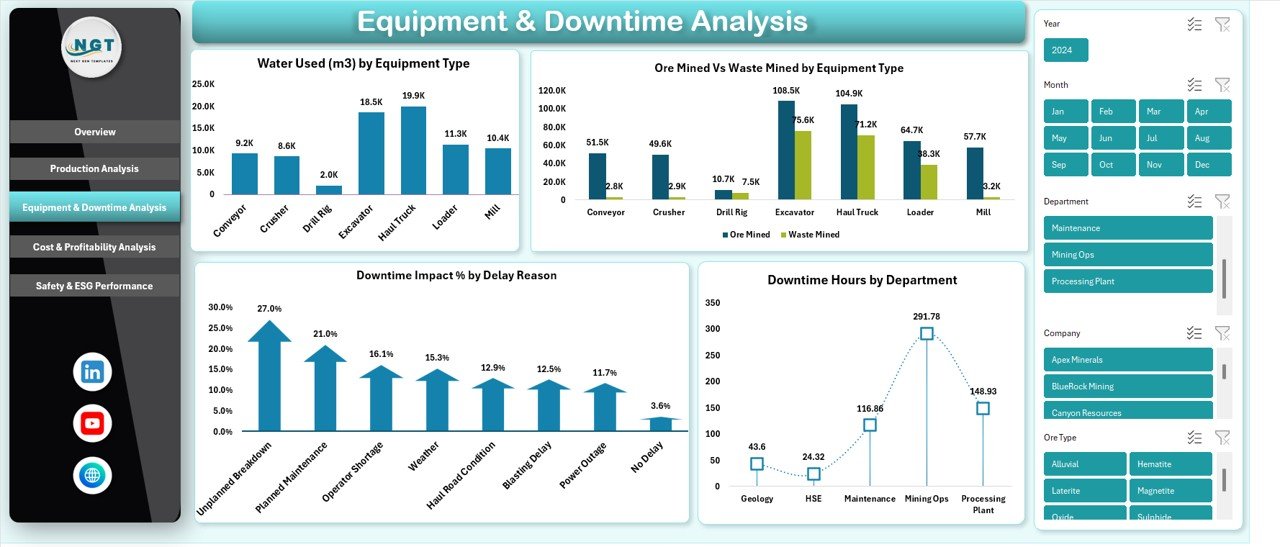
📌 Equipment & Downtime Analysis Sheet
Analyze Water Used by Equipment Type, Ore vs Waste Mined, Downtime Impact % by Delay Reason, and Downtime Hours by Department.
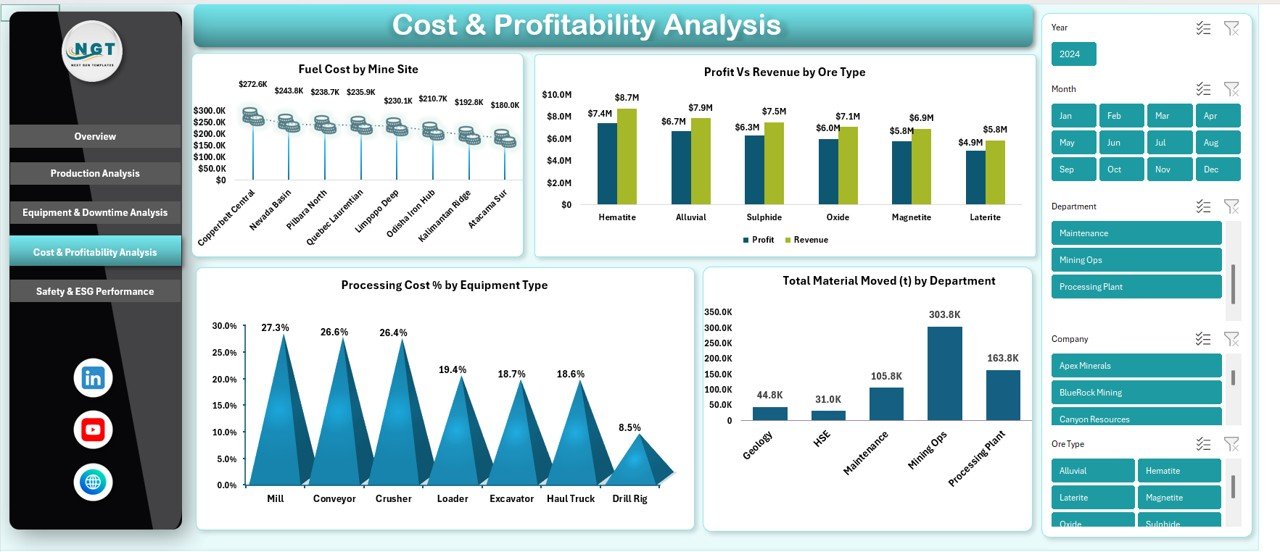
📌 Cost & Profitability Analysis Sheet
Monitor Fuel Cost by Mine Site, Profit vs Revenue by Ore Type, Processing Cost % by Equipment Type, and Total Material Moved by Department.
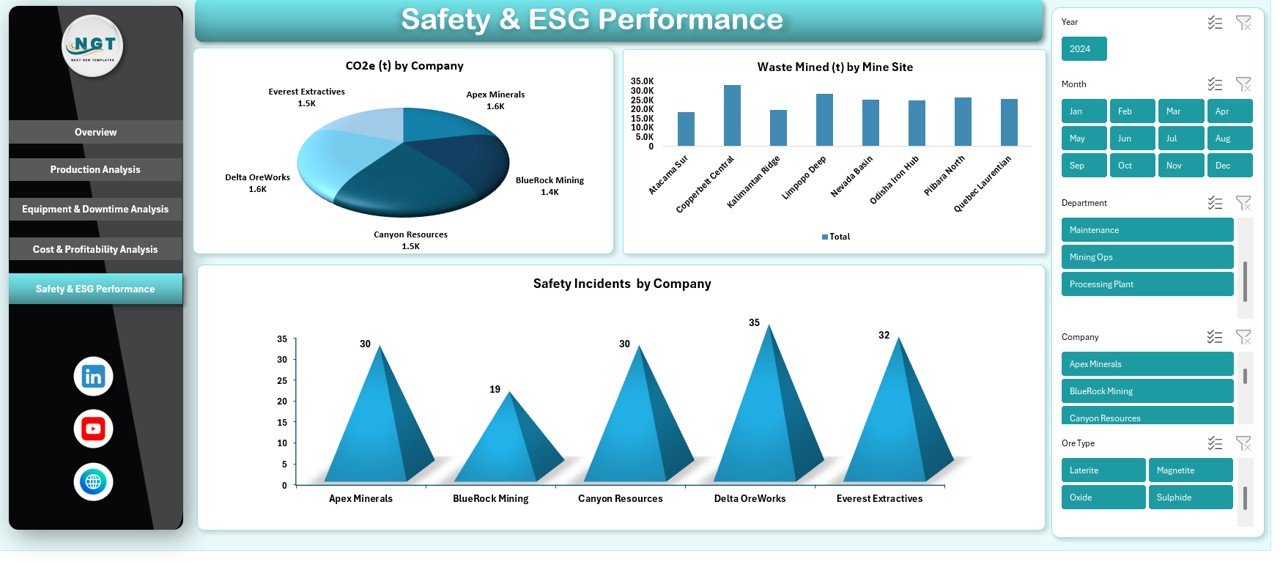
📌 Safety & ESG Performance Sheet
Track CO₂e emissions, Waste Mined by Mine Site, and Safety Incidents by Company.
Each sheet is professionally structured to support operational reviews, financial planning, and compliance reporting.
🧭 How to Use the Mining Dashboard in Excel
📝 Step 1: Enter or paste your mining data into the structured data sheets.
🔄 Step 2: Refresh pivot tables if required (single click).
🎛️ Step 3: Use slicers to filter by mine site, department, equipment type, or period.
📊 Step 4: Review KPIs, charts, and insights instantly.
📤 Step 5: Share reports with management or export visuals for presentations.
No advanced Excel skills are required—basic Excel knowledge is enough to use this dashboard effectively.
👥 Who Can Benefit from This Mining Dashboard in Excel
👷 Mining Operations Managers – Improve production efficiency and resource utilization
💼 Finance & Cost Controllers – Monitor costs, margins, and profitability
🛠️ Maintenance & Equipment Teams – Reduce downtime and extend asset life
🦺 Safety & ESG Officers – Track compliance, incidents, and sustainability metrics
📈 Executives & Decision-Makers – Get a clear, consolidated performance overview
Whether you manage a single mine or multiple sites, this dashboard adapts to your reporting needs.


Reviews
There are no reviews yet.