Mental health organizations handle large amounts of data every single day—patient visits, session outcomes, therapy areas, branch performance, satisfaction scores, and revenue metrics. When this information stays scattered across spreadsheets, reports, or manual logs, decision-making becomes slow and unclear. That’s where the Mental Health Services Dashboard in Power BI becomes a complete game-changer. 💡
This ready-to-use dashboard transforms raw mental health data into clean, interactive, and automated insights. Clinics, psychologists, administrators, and therapy centers get an instant 360-degree view of patient outcomes, satisfaction levels, therapy performance, and financial results—all in one place. It eliminates the need to manually prepare reports and empowers teams with real-time performance visibility.
Whether you manage a single clinic or multiple branches, this dashboard is designed to help you understand what’s working, what’s not, and where improvements are needed. With stunning visuals, KPI cards, slicers, and drill-down analytics, this template offers everything leaders need to improve patient experience and operational performance. 🚀
✨ Key Features of Mental Health Services Dashboard in Power BI
This dashboard is packed with powerful features that simplify reporting and enhance clarity.
📊 Fully Interactive KPIs
Track essential metrics like:
-
Total Patients
-
Average Satisfaction
-
Total Profit (USD)
-
Total Session Fees
These KPIs help you understand performance instantly.
📈 Branch, Specialty & Therapy Insights
Every page offers deep insights into how different branches, specialties, and therapy areas perform.
📅 Monthly Trend Analysis
Spot seasonal patterns, growth opportunities, and declining months with automated trend charts.
🎨 Stunning Visuals & Slicers
Switch between regions, specialties, branches, and therapy types with one click. Power BI updates all visuals instantly.
⚡ Zero Manual Reporting
Just load or refresh your dataset—Power BI handles the rest.
📦 What’s Inside the Mental Health Services Dashboard in Power BI
This dashboard includes five powerful analytical pages, each designed to answer a critical business question.
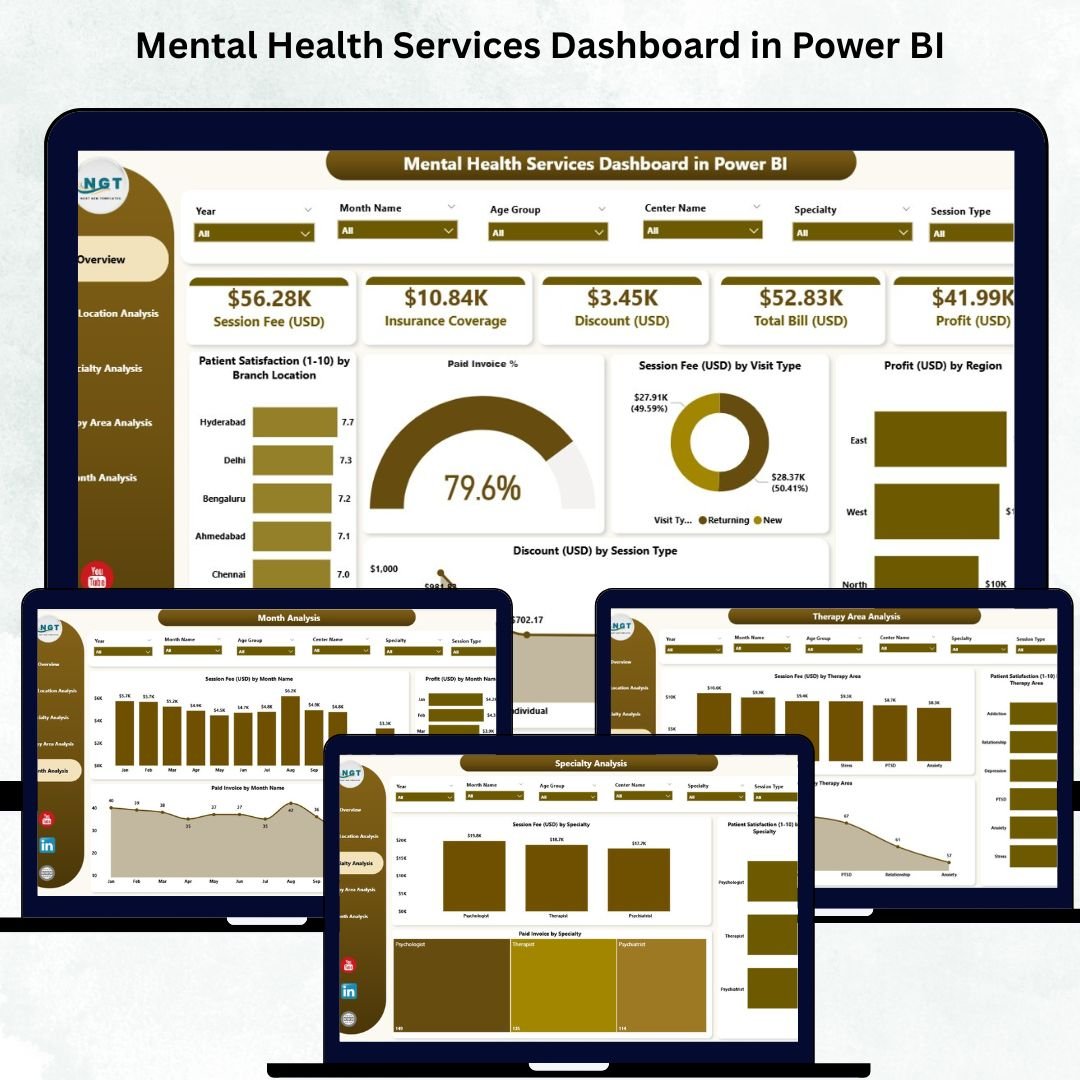
1️⃣ Overview Page
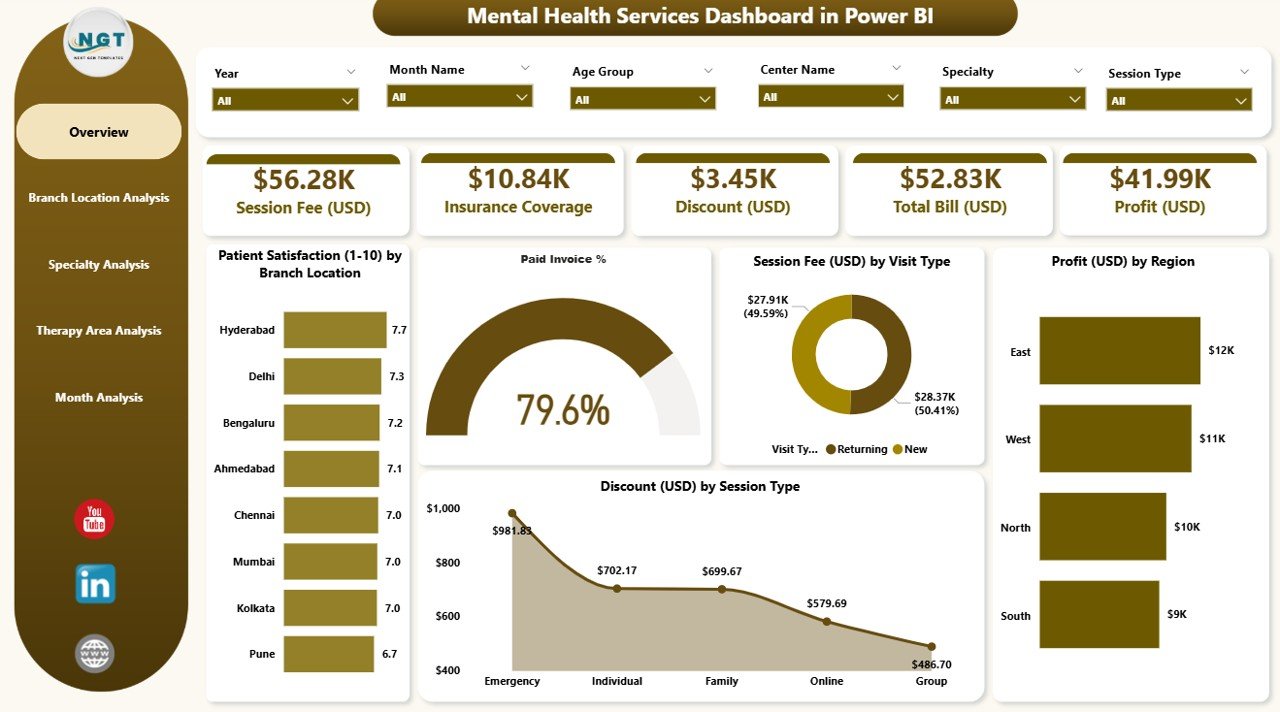
The main page includes KPI cards and detailed charts showing:
-
Patient Satisfaction by Branch
-
Paid Invoice %
-
Session Fees by Visit Type
-
Profit by Region
-
Discounts by Session Type
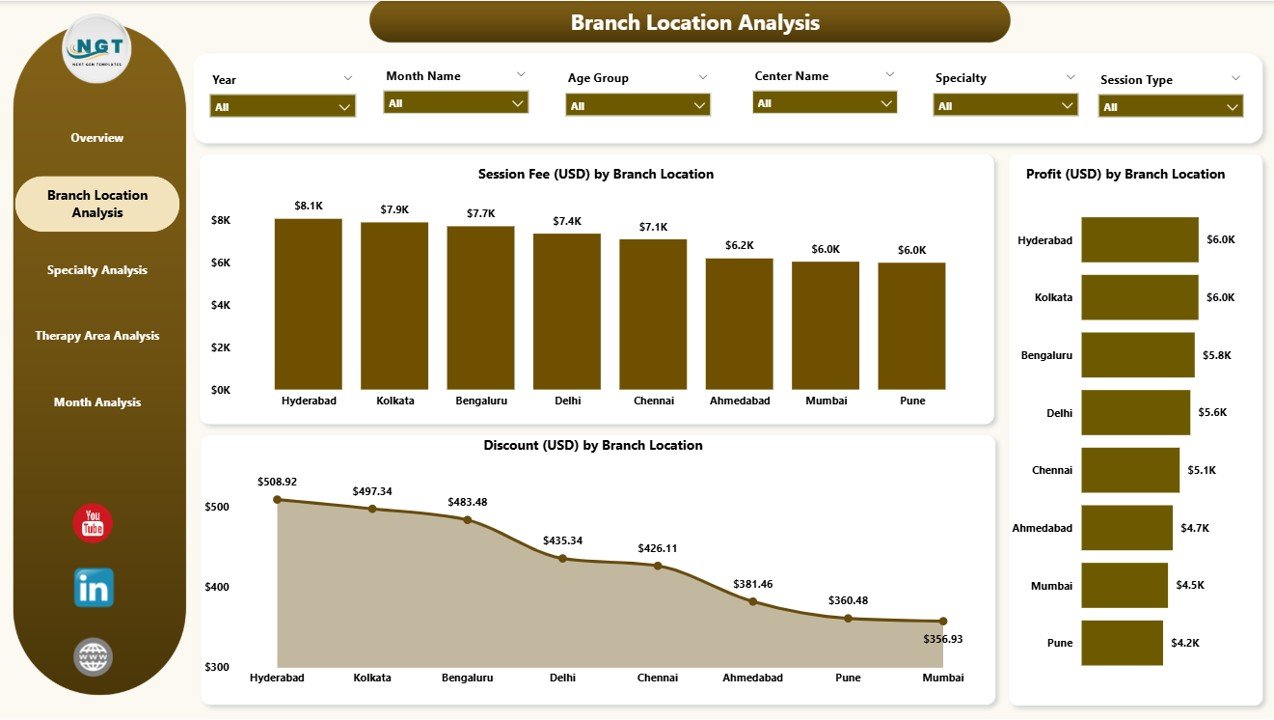
2️⃣ Branch Location Analysis
Compare branches using three visuals showing:
-
Session Fee by Branch
-
Profit by Branch
-
Discounts by Branch
Perfect for identifying strong and weak branch performance.
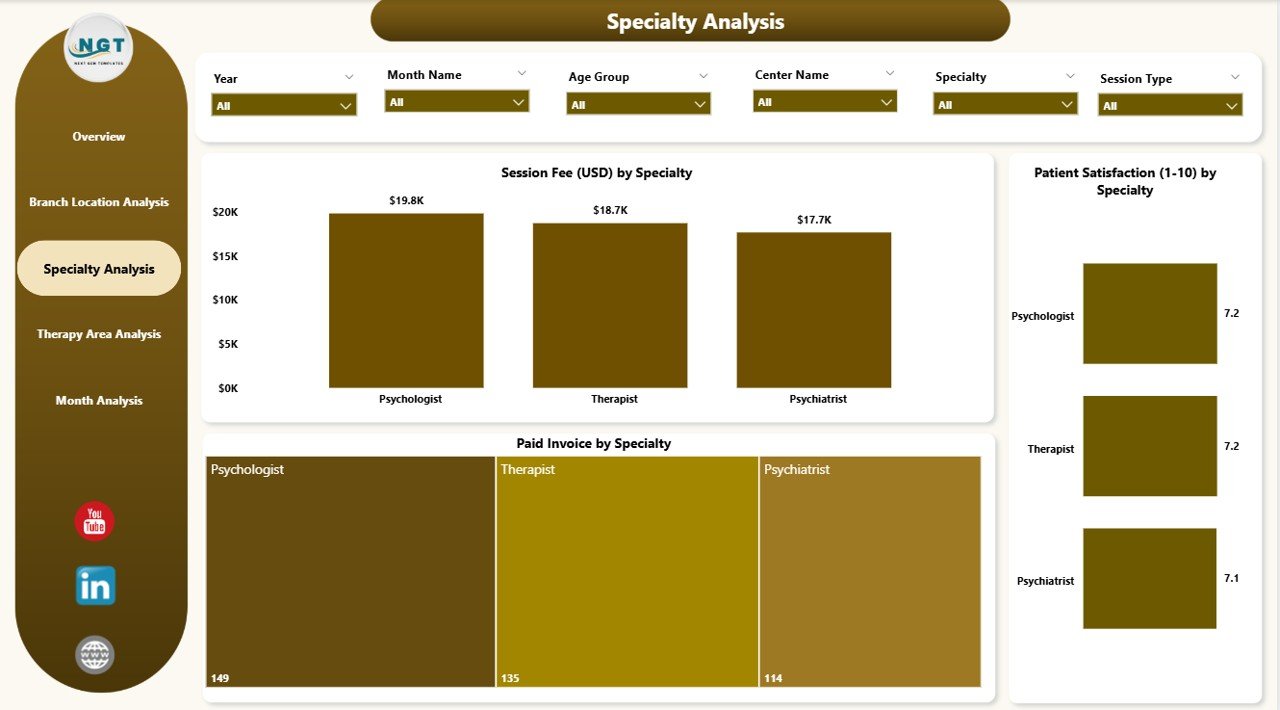
3️⃣ Specialty Analysis
Understand which specialties—like psychiatry, counseling, family therapy, behavioral therapy—contribute most to:
-
Revenue
-
Profit
-
Patient Satisfaction
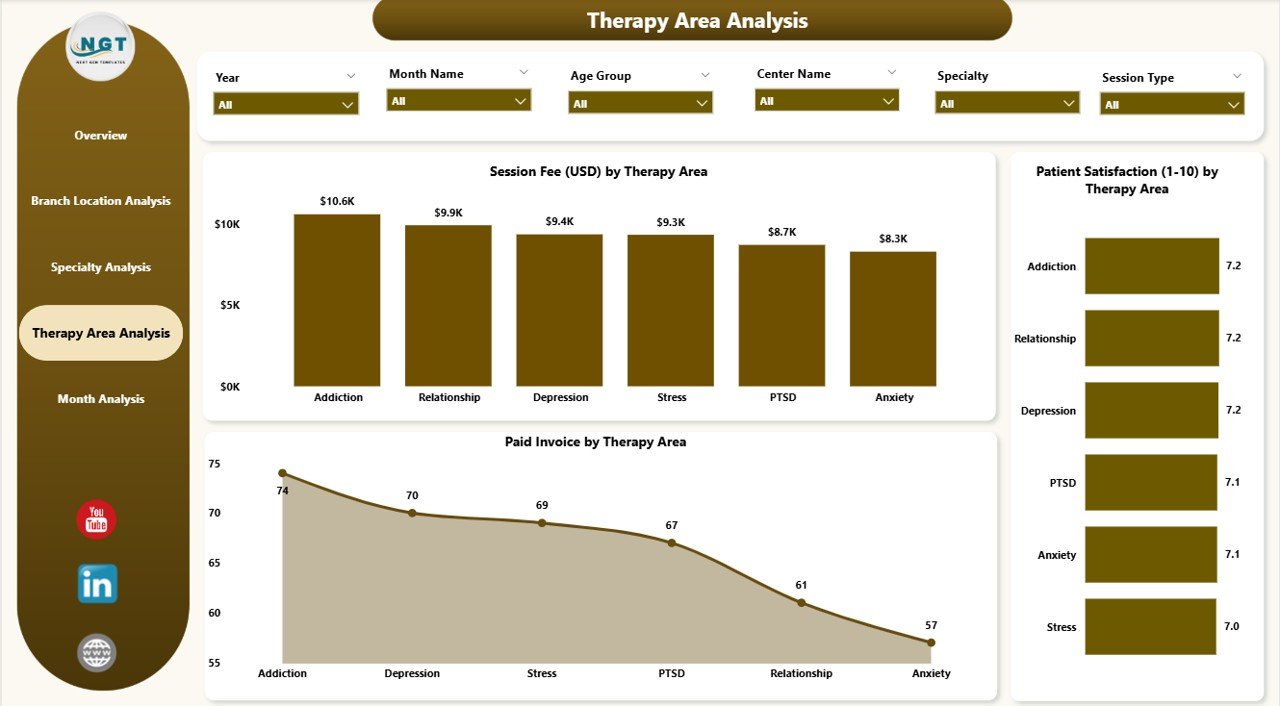
4️⃣ Therapy Area Analysis
Track how therapy types such as CBT, Trauma Therapy, Child Counseling, Group Therapy, and Stress Management perform in terms of:
-
Fees
-
Profit
-
Satisfaction
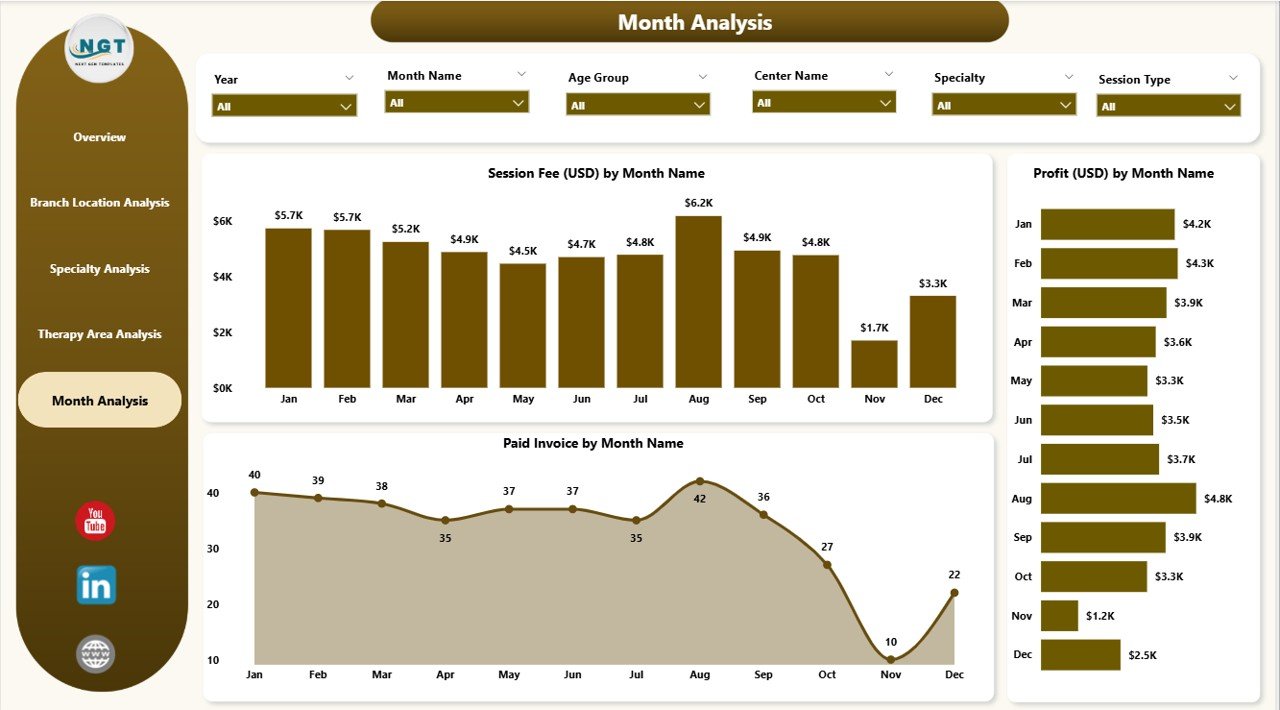
5️⃣ Monthly Trends
Analyze month-wise trends for:
-
Session Fees
-
Profit
-
Satisfaction
Ideal for forecasting and resource planning.
🛠️ How to Use the Mental Health Services Dashboard in Power BI
Using this dashboard is incredibly simple:
1️⃣ Connect your dataset from Excel, EMR, CRM, or appointment system.
2️⃣ Refresh your dashboard to load the latest data.
3️⃣ Use slicers to filter by branch, month, specialty, or therapy type.
4️⃣ Explore charts, KPIs & trends to make data-driven decisions.
No technical knowledge required—Power BI does all the heavy lifting. ⚡
🎯 Who Can Benefit from This Mental Health Services Dashboard?
This dashboard is ideal for:
-
🧑⚕️ Therapists & Psychologists
-
🏥 Mental Health Centers
-
💼 Clinic Administrators
-
📊 Operations Managers
-
💰 Finance Teams
-
🧠 Behavioral Health Departments
-
🧑💼 Healthcare Directors
Anyone who needs clear, accurate, and fast insights will benefit from this template.
### Click here to read the Detailed blog post
Visit our YouTube channel to learn step-by-step video tutorials
👉 Youtube.com/@PKAnExcelExpert


Reviews
There are no reviews yet.