In today’s fast-moving digital landscape, memes and viral content have become powerful marketing tools. Social media platforms such as Instagram, TikTok, YouTube, Facebook, and Twitter thrive on engaging content that spreads rapidly across audiences. Meme and Viral Content Creation Dashboard in Power BI Businesses, influencers, and marketing teams constantly create viral posts to boost engagement, increase brand visibility, and drive revenue.
However, managing the performance of viral content campaigns can quickly become complicated. Marketing teams often publish dozens or even hundreds of posts across multiple platforms, topics, and languages. Meme and Viral Content Creation Dashboard in Power BI Without a structured analytics system, it becomes difficult to track which content performs best, which platforms generate the highest revenue, and how advertising spending affects profitability.
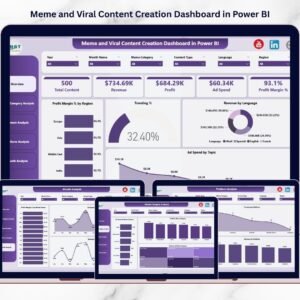
The Meme and Viral Content Creation Dashboard in Power BI solves this challenge by providing a powerful analytics solution for content creators and digital marketers. This interactive Power BI dashboard helps teams monitor viral content performance, analyze engagement trends, track revenue and advertising costs, and optimize marketing strategies.
Instead of analyzing scattered reports and spreadsheets, users can monitor all critical KPIs from a single centralized Power BI dashboard. With interactive visuals and automated insights, this dashboard helps organizations make smarter, data-driven decisions for viral content campaigns.
📊 Key Features of Meme and Viral Content Creation Dashboard in Power BI
🚀 Centralized Viral Content Analytics
Monitor all meme and viral content performance metrics in one powerful dashboard.
📊 Interactive KPI Cards
Quickly review key metrics such as Total Content, Revenue, Profit, Ad Spend, and Profit Margin.
🌍 Regional Performance Analysis
Analyze profitability and campaign performance across different geographic regions.
📈 Trending Content Insights
Track the percentage of posts that become trending or viral.
💰 Revenue and Profit Monitoring
Understand how viral campaigns contribute to revenue growth and profitability.
📢 Advertising Spend Analysis
Monitor how advertising investments distribute across topics and platforms.
📊 Content Category Performance
Analyze which meme categories generate the highest engagement and profits.
📱 Platform Performance Tracking
Compare viral content performance across social media platforms.
📅 Monthly Trend Analysis
Monitor how revenue, profit margins, and ad spending change over time.
⚡ Interactive Power BI Visualization
Filter and analyze data using dynamic visuals and powerful analytics tools.
📦 What’s Inside the Meme and Viral Content Creation Dashboard in Power BI
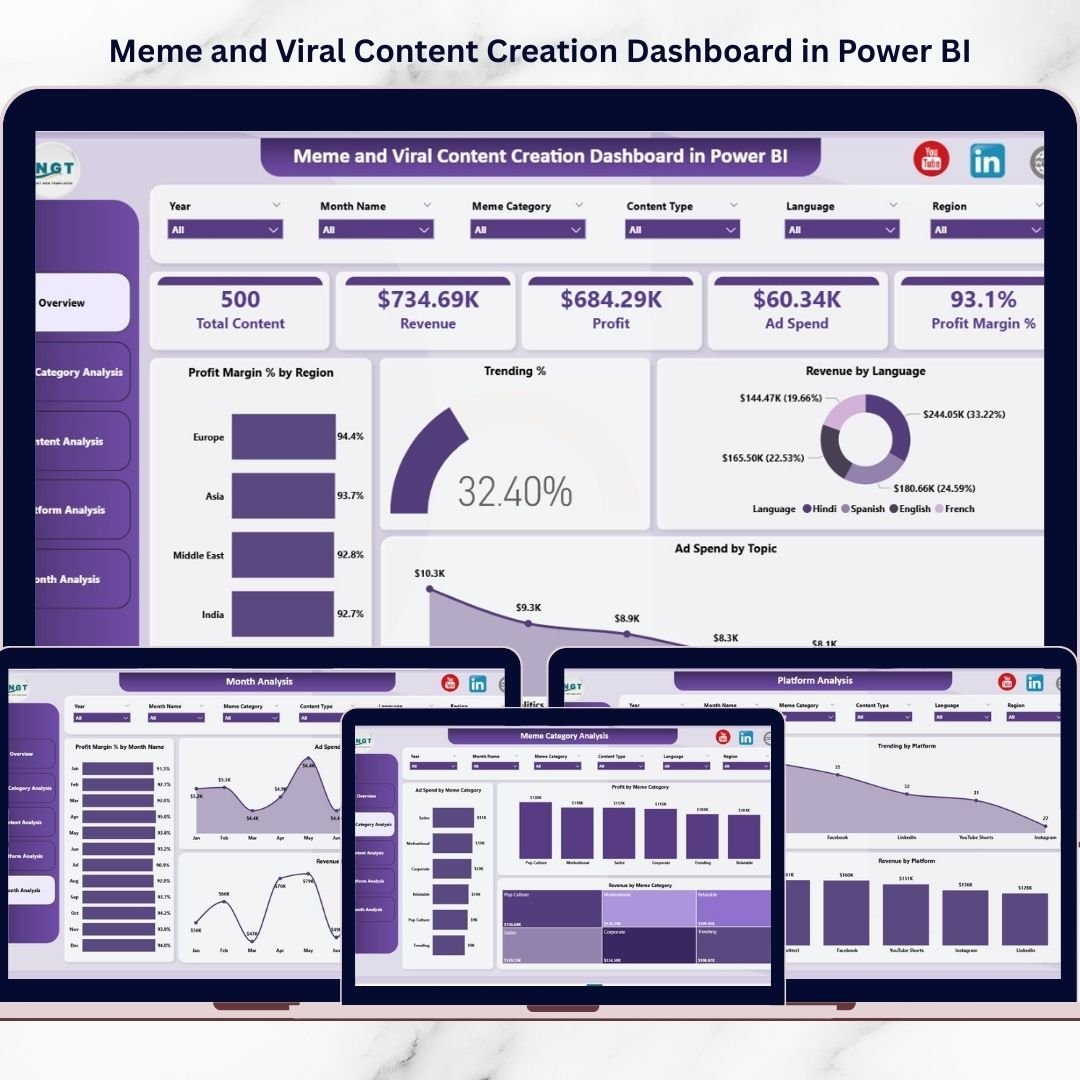
This ready-to-use dashboard includes five powerful report pages designed to analyze viral content performance from different perspectives.
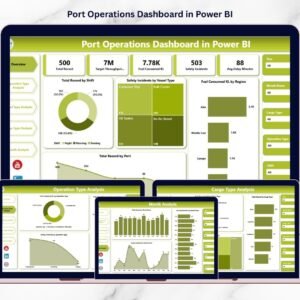
1️⃣ Overview Page (Main Dashboard)
The Overview Page acts as the main performance monitoring dashboard.
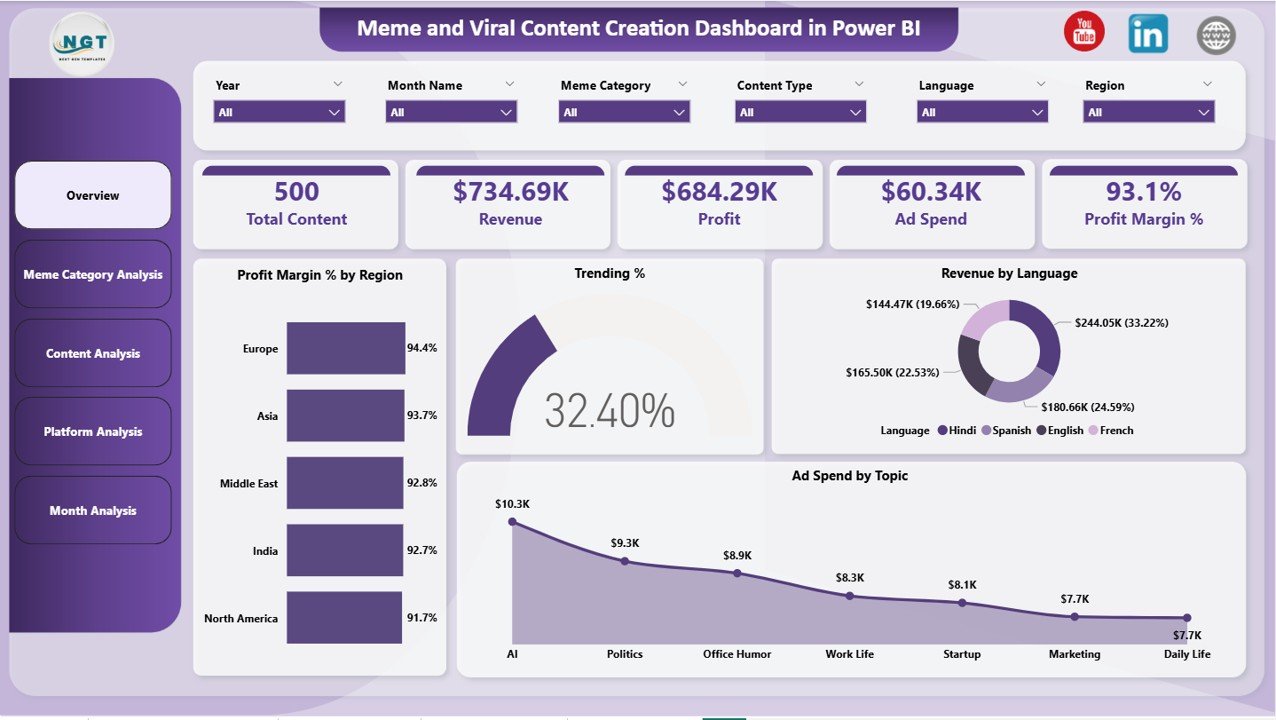
It provides a high-level summary of viral content campaigns.
Key KPI cards displayed include:
-
Total Content Created
-
Total Revenue Generated
-
Total Profit
-
Advertising Spend
-
Profit Margin Percentage
The page also includes several charts that provide deeper insights.
📊 Profit Margin % by Region – Shows profitability across geographic regions.
🔥 Trending % – Displays the percentage of content that becomes viral.
💬 Revenue by Language – Analyzes revenue performance across different language audiences.
📢 Ad Spend by Topic – Displays how advertising budgets are distributed across topics.
These insights help marketing teams quickly evaluate campaign performance.
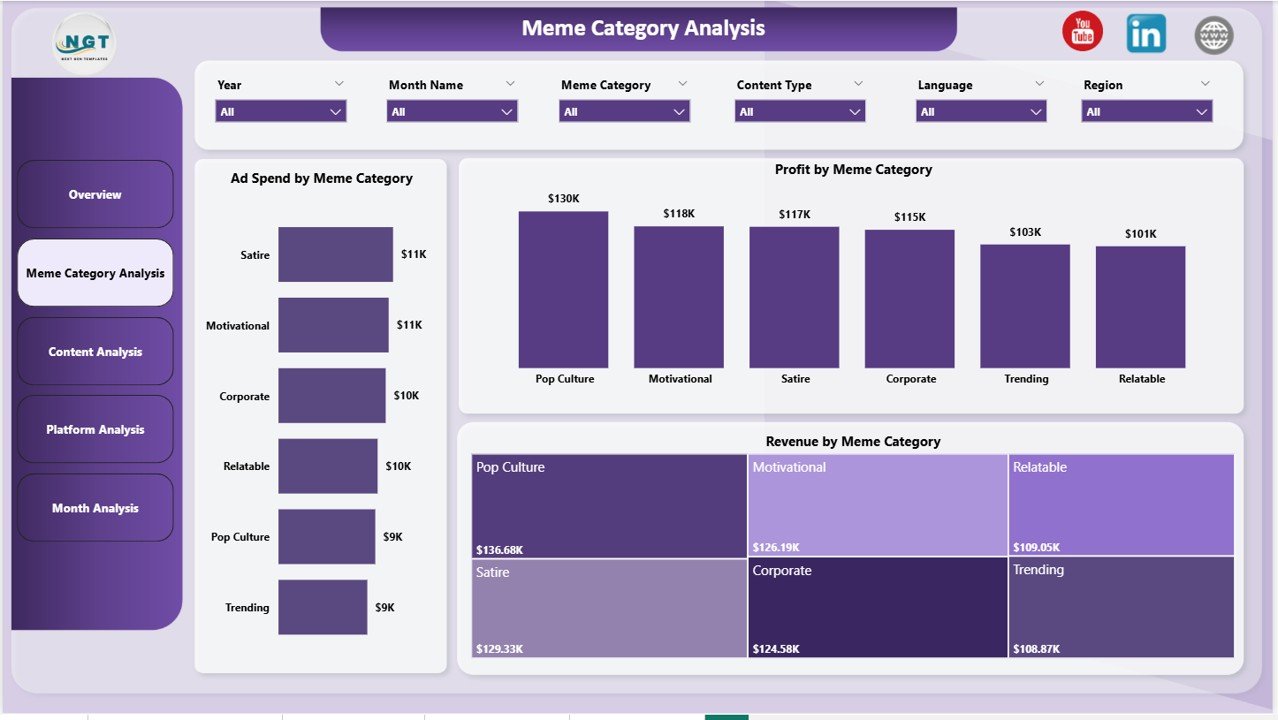
2️⃣ Meme Category Analysis Page
Different meme categories often perform differently in terms of engagement and profitability.
This page analyzes performance by meme category.
Charts on this page include:
📊 Ad Spend by Meme Category
💰 Profit by Meme Category
📈 Revenue by Meme Category
These insights help marketers invest more resources in high-performing meme formats.
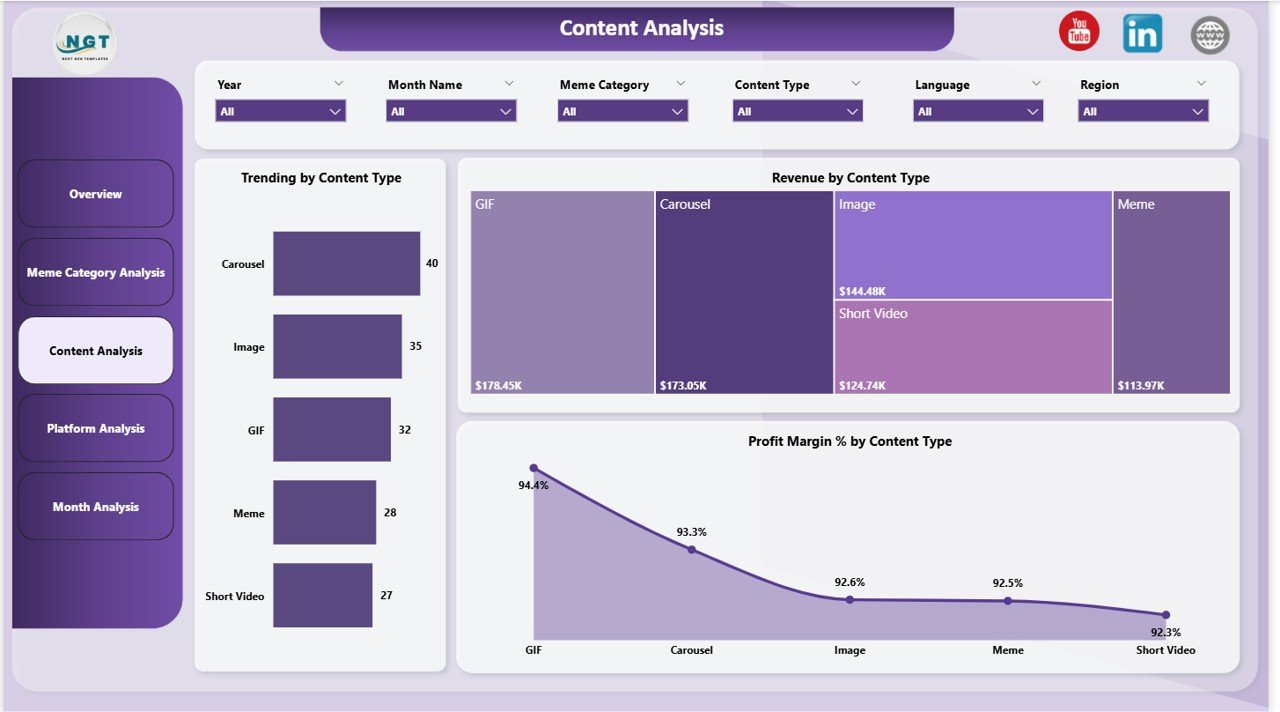
3️⃣ Content Analysis Page
The Content Analysis Page focuses on different content formats such as:
-
Short videos
-
GIFs
-
Static memes
-
Reaction memes
-
Educational memes
Charts included:
🔥 Trending by Content Type
💰 Revenue by Content Type
📊 Profit Margin % by Content Type
These insights help creators prioritize content formats that generate the highest engagement.
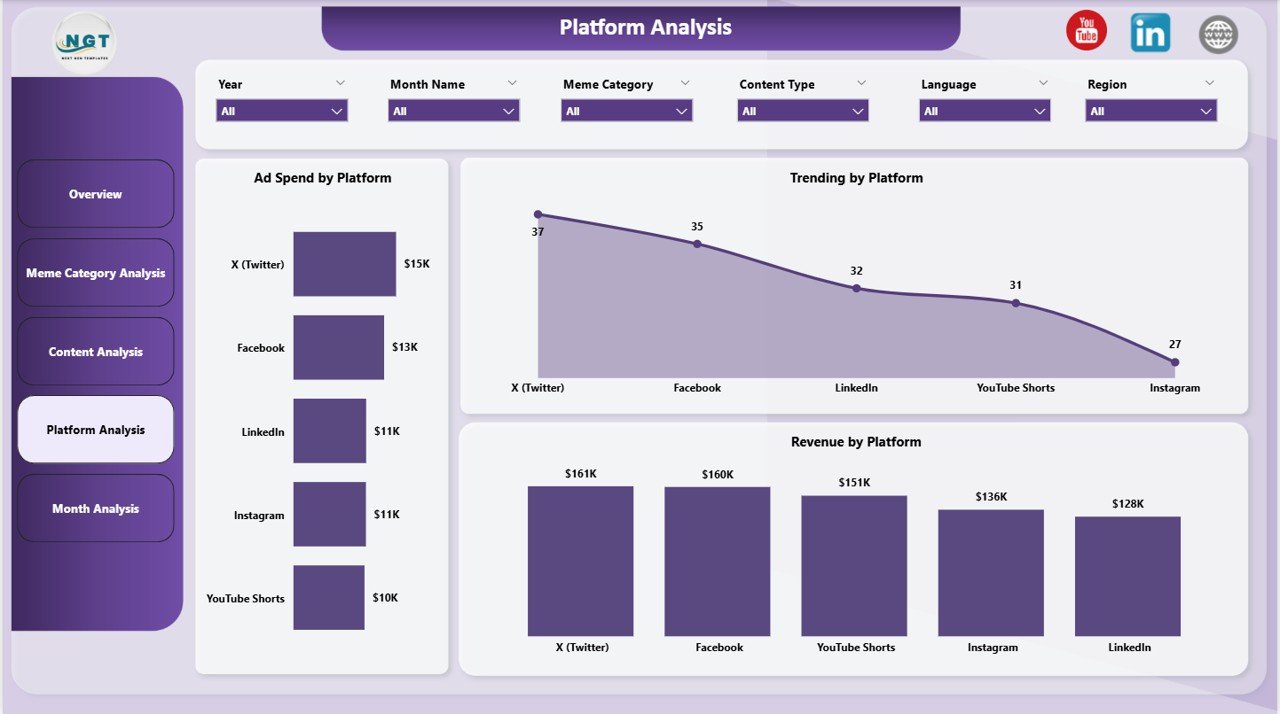
4️⃣ Platform Analysis Page
This page analyzes viral content performance across different social media platforms.
Charts include:
📊 Ad Spend by Platform
🔥 Trending by Platform
💰 Revenue by Platform
This analysis helps organizations identify which platforms generate the best results.
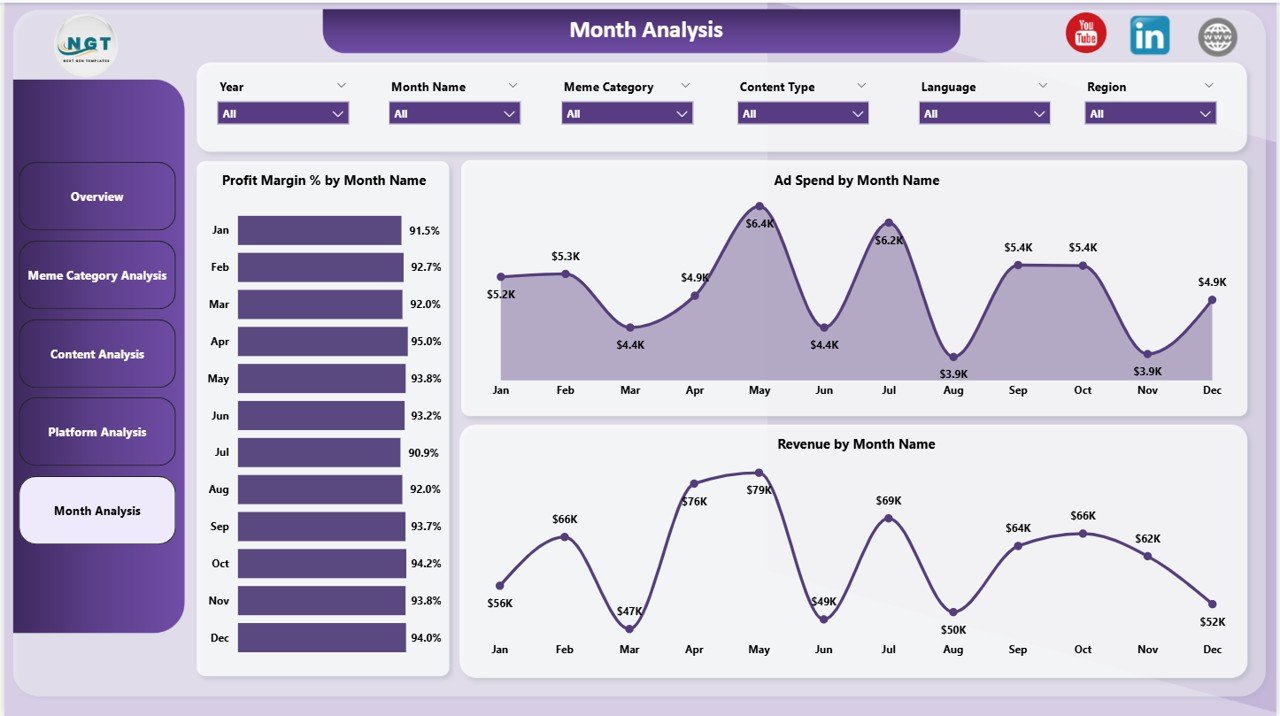
5️⃣ Monthly Trends Page
The Monthly Trends Page helps users analyze campaign performance over time.
Charts include:
📈 Profit Margin % by Month
📊 Ad Spend by Month
💰 Revenue by Month
Trend analysis helps organizations understand seasonal performance patterns and plan future campaigns.
⚙️ How to Use the Meme and Viral Content Creation Dashboard in Power BI
Using this dashboard is simple and efficient.
Step 1 – Import Data
Upload viral content data such as engagement metrics, revenue, and ad spending.
Step 2 – Refresh the Power BI Dashboard
Update the dashboard to reflect the latest campaign performance.
Step 3 – Analyze KPI Metrics
Review key performance indicators on the Overview Page.
Step 4 – Explore Detailed Analysis Pages
Analyze performance by category, platform, and content type.
Step 5 – Monitor Trends
Use monthly trend charts to evaluate campaign performance over time.
With these steps, marketing teams can quickly identify successful content strategies and optimize campaigns.
👥 Who Can Benefit from This Meme and Viral Content Creation Dashboard
This dashboard is ideal for professionals involved in digital marketing and content creation.
📣 Social Media Marketing Teams
🎥 Content Creators & Influencers
📊 Digital Marketing Agencies
🏢 Brand Marketing Teams
📈 Data Analysts & Marketing Analysts
📱 Social Media Managers
🎬 Media Production Companies
📊 Marketing Strategy Teams
These professionals can use the dashboard to monitor campaign performance, analyze engagement trends, and improve viral marketing strategies.
Click hare to read the Detailed blog post
Visit our YouTube channel to learn step-by-step video tutorials
https://Youtube.com/@PKAnExcelExpert