Meme and Viral Content Creation Dashboard today’s digital landscape. They drive massive engagement, brand visibility, and monetization opportunities across platforms like Instagram, YouTube Shorts, X, Facebook, and TikTok. However, while creativity fuels virality, data decides sustainability. Without proper tracking, creators and marketers struggle to understand what actually works, where money gets wasted, and which content truly drives profit.
That is exactly why the Meme and Viral Content Creation Dashboard in Excel becomes a game-changing analytics solution 🚀.
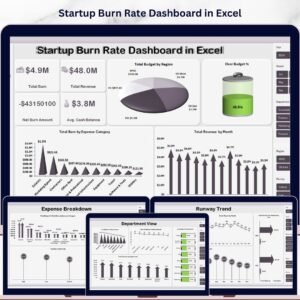
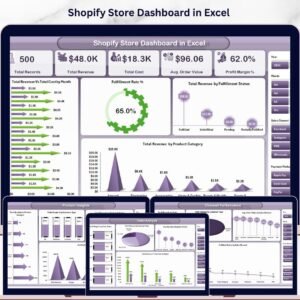
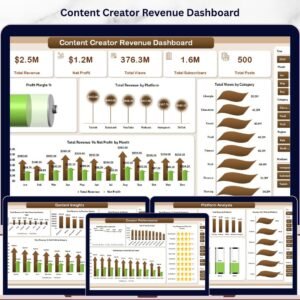
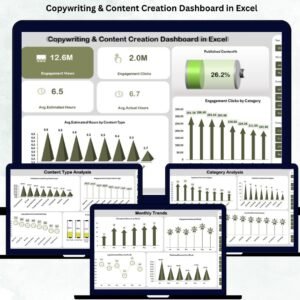
This ready-to-use Excel dashboard converts scattered meme performance data into clear, visual, and actionable insights. Instead of guessing which meme category, content type, or platform will go viral next, you can analyze real numbers—revenue, ad spend, profit, profit margin, trending percentage, and time-based patterns—all in one structured Excel file.
Because this dashboard runs entirely in Excel, you do not need expensive BI tools or advanced technical skills. You simply update the data, apply slicers, and instantly see how your viral content performs.
Whether you are a meme creator, influencer, agency, brand, or digital marketer, this dashboard helps you turn virality into a profitable content strategy.
🚀 Key Features of Meme and Viral Content Creation Dashboard in Excel
😂 Centralized Viral Content Analytics – Track all meme performance metrics in one dashboard
📊 Interactive KPI Cards & Charts – Instantly understand profit, margin, and trends
🎯 Right-Side Slicers – Filter performance by month, platform, category, content type, or region
🌍 Region & Language Insights – See where your content performs best
💰 Revenue, Profit & Ad Spend Tracking – Measure monetization clearly
🔥 Trending % Analysis – Identify which content formats gain traction faster
🧭 Page Navigator – Seamless movement between dashboard pages
🛠 Fully Customizable in Excel – Modify KPIs, charts, and structure easily
📂 What’s Inside the Meme and Viral Content Creation Dashboard in Excel
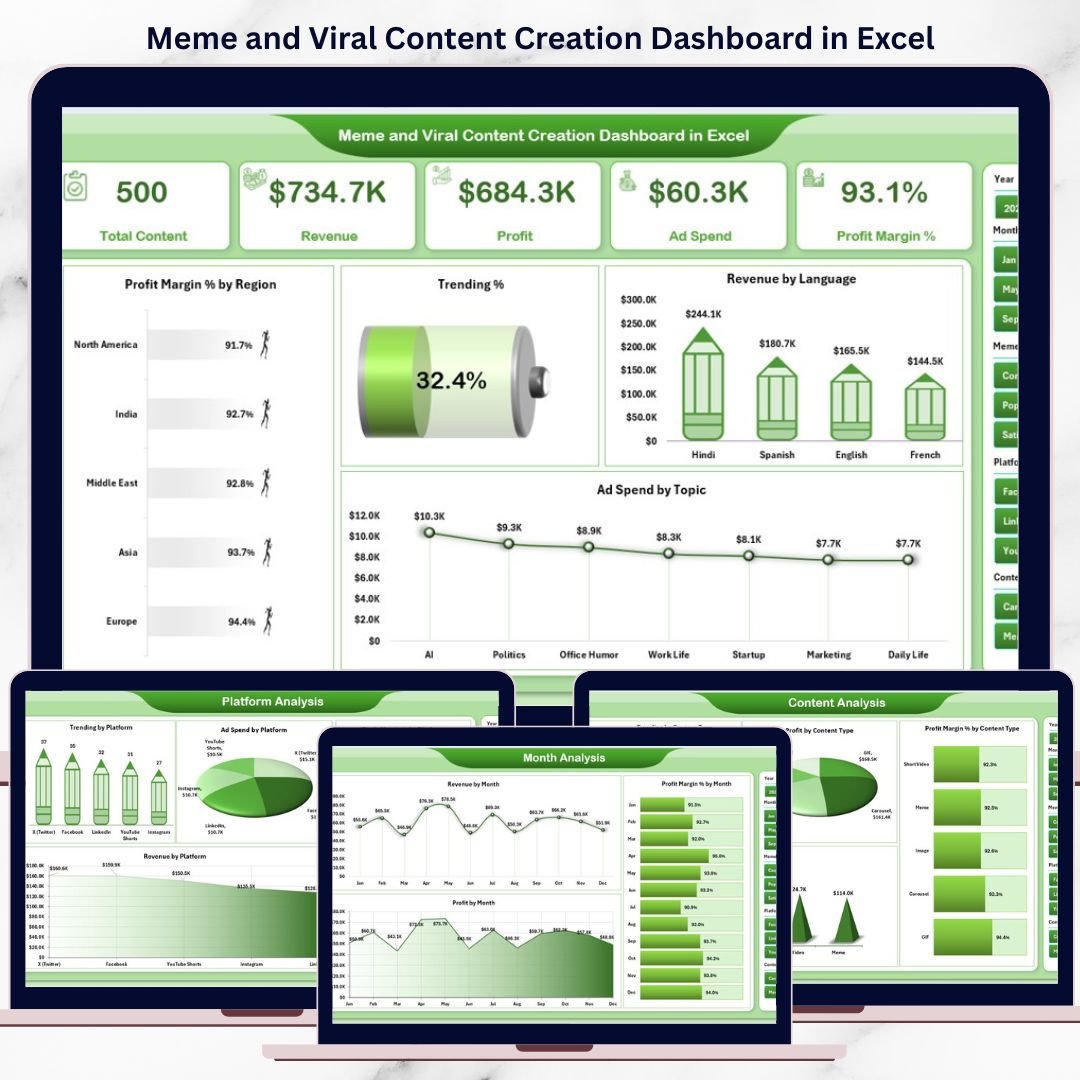
This digital product includes five powerful analytical pages, each designed to answer a specific content-strategy question:
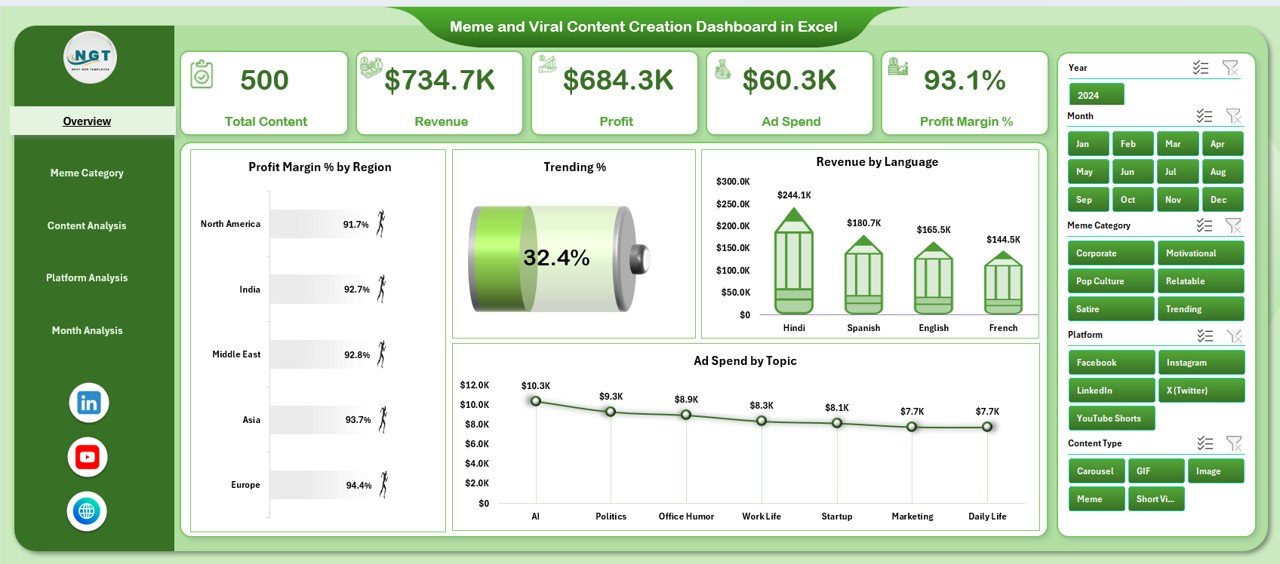
📌 Overview Page – High-level snapshot with KPI cards and charts for profit margin %, trending %, revenue by language, and ad spend by topic
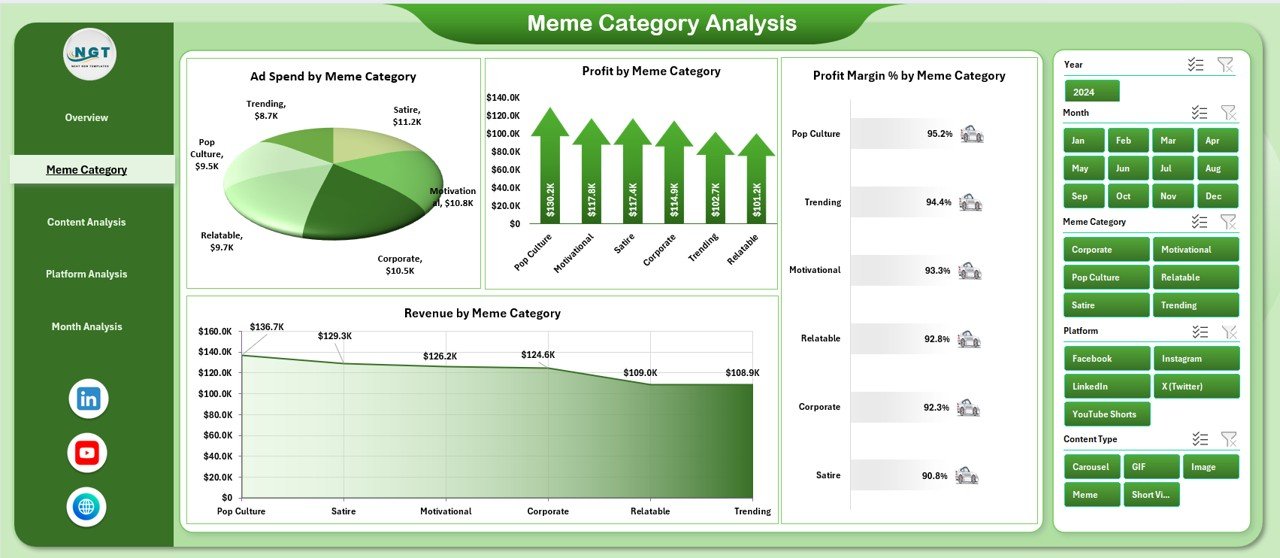
📌 Meme Category Analysis – Analyze ad spend, revenue, profit, and margin by meme category
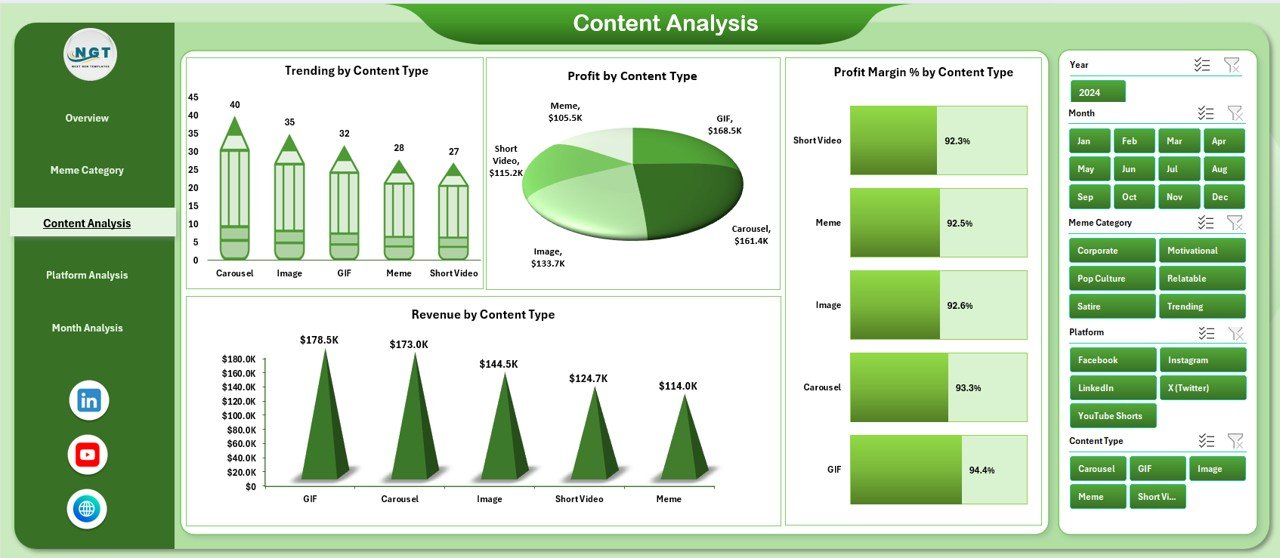
📌 Content Analysis – Compare virality, profit, and efficiency across content formats (image, video, GIF, etc.)
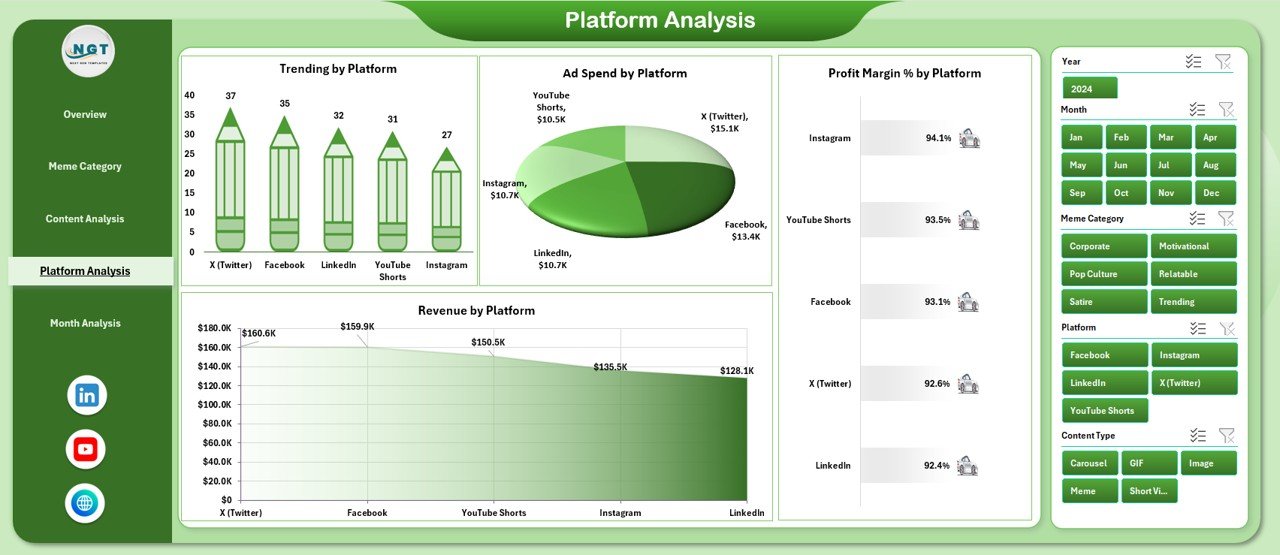
📌 Platform Analysis – Evaluate trending %, ad spend, revenue, and margin across social platforms
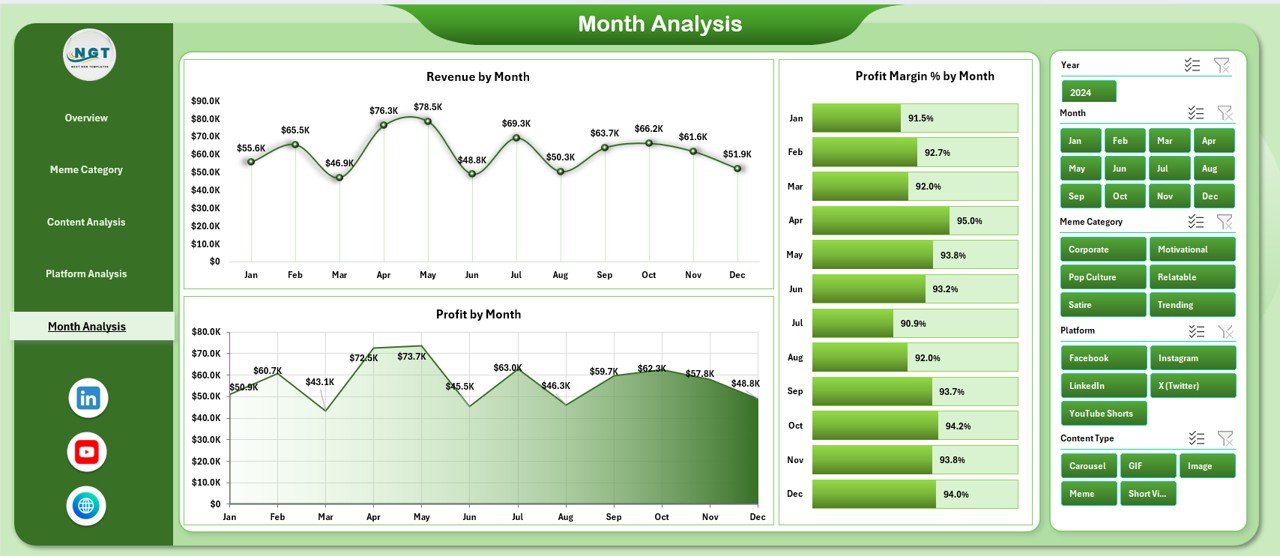
📌 Month Analysis – Track revenue, profit, and margin trends over time
Behind the scenes, the dashboard uses:
-
Data Sheet for raw meme and campaign data
-
Support Sheet for helper tables and validation
Once data updates, all visuals refresh automatically.
🛠️ How to Use the Meme and Viral Content Creation Dashboard in Excel
Using this dashboard is quick and creator-friendly:
1️⃣ Enter or paste meme campaign data into the Data Sheet
2️⃣ Select filters using right-side slicers
3️⃣ Start with the Overview Page for instant performance clarity
4️⃣ Analyze meme categories, content types, and platforms
5️⃣ Review monthly trends to align with viral cycles
6️⃣ Optimize content strategy based on profit—not guesswork
No formulas to write. No manual reporting. Just insights.
👥 Who Can Benefit from This Meme & Viral Content Dashboard
This dashboard is perfect for:
😂 Meme Creators & Influencers – Track what actually makes money
📢 Digital Marketing Agencies – Optimize viral campaigns for clients
📱 Social Media Managers – Improve posting and promotion strategy
🏢 Brand Marketing Teams – Measure ROI from meme marketing
🎥 Content Strategists – Balance creativity with profitability
💼 Freelancers & Page Owners – Scale viral pages sustainably
Anyone using memes as a growth or revenue channel will benefit.


Reviews
There are no reviews yet.