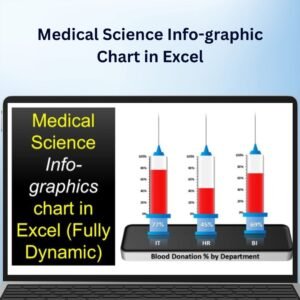
The Medical Science Info-Graphic Chart in Excel is an advanced and visually appealing tool designed to present medical data and information in a clear, concise, and easy-to-understand format. This interactive chart is ideal for health professionals, educators, researchers, and anyone in the medical field who needs to present complex data in a simple, engaging way.
With this tool, you can visualize key health metrics, research results, and other medical statistics in a colorful, informative infographic style. The customizable chart allows you to display important data points, track trends, and communicate insights in a professional and polished manner. Whether you’re presenting research findings, patient data, or general health statistics, this chart makes your information more digestible and visually appealing.

Key Features of the Medical Science Info-Graphic Chart in Excel
📌 Visually Engaging Data Presentation
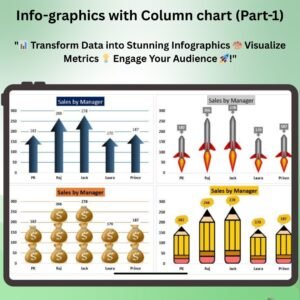
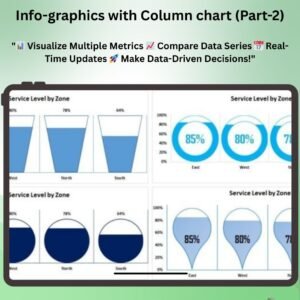
The chart uses vibrant colors, icons, and graphics to represent medical data, making it easy for viewers to understand complex information. It’s perfect for presentations, reports, and research papers where you need to communicate medical findings clearly.
🛠 Customizable Design
The chart can be fully customized to match your specific needs. You can modify the design, adjust data points, and tailor the infographic to display various medical statistics such as disease rates, treatment efficacy, or patient outcomes.
💡 Easy-to-Understand Visuals
With its clear layout and intuitive design, the chart simplifies complex data, allowing both medical professionals and non-experts to grasp the key points quickly. Icons and visual cues help to break down the data into easy-to-digest segments.
🔢 Multiple Data Categories
Track and display multiple categories of medical data at once. Whether you’re monitoring patient progress, tracking disease outbreaks, or comparing treatment effectiveness, the chart lets you visualize multiple data sets in one cohesive design.
🚀 Interactive and Engaging
The infographic chart is interactive, allowing you to drill down into specific data points or customize the view based on the metrics you want to highlight. This feature makes the chart more engaging for presentations and discussions.
📊 Professional and Polished Design
The Medical Science Info-Graphic Chart in Excel helps you present medical data in a professional and visually appealing manner. With sleek design elements and a modern layout, this chart ensures your data stands out in reports and presentations.
⚙ Simple Setup and Customization
Setting up and customizing the chart is easy. Even if you have limited Excel experience, the template comes with clear instructions, allowing you to create a professional-looking infographic in just a few clicks.
🚀 Why You’ll Love the Medical Science Info-Graphic Chart in Excel
✅ Visually Appealing – Simplify complex medical data with engaging visuals. ✅ Customizable Design – Tailor the chart to your specific data and requirements. ✅ Easy-to-Understand – Make complex medical data more digestible for diverse audiences. ✅ Multiple Data Categories – Track and compare various data points in one cohesive chart. ✅ Interactive and Engaging – Create dynamic presentations that highlight key insights. ✅ Simple Setup – Get started quickly with easy-to-follow instructions.
📂 What’s Inside the Medical Science Info-Graphic Chart in Excel?
- Infographic Design: A visually engaging chart that uses icons, colors, and data points to present medical data.
- Customizable Data Points: Adjust the chart to display various medical metrics and statistics.
- Real-Time Data Updates: Automatically update the chart as new data is entered.
- Multiple Data Categories: Track and compare multiple data points within the infographic.
- Clear Setup Instructions: Step-by-step instructions to get the chart up and running.
🔍 How to Use the Medical Science Info-Graphic Chart in Excel
1️⃣ Download the Template – Instant access to the Excel file upon purchase. 2️⃣ Input Your Data – Enter your medical data for each category. 3️⃣ Customize the Design – Modify the chart’s colors, icons, and layout to fit your needs. 4️⃣ Track and Visualize Data – Use the infographic to track trends, monitor progress, or compare results. 5️⃣ Present and Share – Use the chart in reports, presentations, or research papers to showcase your data.
🎯 Who Can Benefit from the Medical Science Info-Graphic Chart in Excel? 🔹 Healthcare Professionals
🔹 Researchers
🔹 Medical Educators
🔹 Public Health Analysts
🔹 Hospitals and Clinics
🔹 Anyone involved in presenting medical or health-related data
Present your medical data in a visually engaging and professional format with the Medical Science Info-Graphic Chart in Excel. This tool simplifies the process of communicating complex medical information, making it easier to share insights with your audience.
Click here to read the Detailed blog post
https://www.pk-anexcelexpert.com/medical-science-info-graphic-chart-in-excel/










Reviews
There are no reviews yet.