


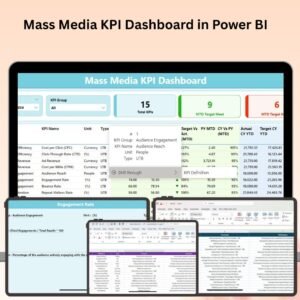
The Mass Media KPI Dashboard in Power BI is a powerful tool designed for businesses and media professionals who want to track, analyze, and optimize their mass media campaigns. This Excel-based Power BI dashboard allows you to monitor key performance indicators (KPIs) such as media reach, engagement, campaign effectiveness, audience demographics, and ROI, ensuring that your mass media efforts are delivering the results you expect.
With real-time data tracking, customizable reports, and interactive data visualization, this dashboard helps you gain a comprehensive view of your media campaigns, identify trends, and make informed decisions to improve your media strategies. Whether you’re working with television, radio, print, or digital media, this tool helps you manage and optimize mass media performance.

Key Features of the Mass Media KPI Dashboard in Power BI:
📊 Comprehensive Media Reach Tracking
Track the reach of your mass media campaigns, including audience size, frequency, and the impact of each media channel (TV, radio, print, online) on your target audience.
💬 Audience Engagement Analysis
Monitor how engaged your audience is with your campaigns. Track metrics such as interactions, clicks, shares, and comments across various platforms to assess engagement quality.
📈 Campaign Effectiveness Measurement
Evaluate the success of your media campaigns by tracking KPIs such as conversions, cost-per-impression (CPI), and return on investment (ROI).
🌍 Demographic and Geo-Targeting Insights
Analyze audience demographics (age, gender, location, interests) to understand who is engaging with your content and optimize your media targeting.
💰 Budget and ROI Tracking
Monitor campaign spending, cost per channel, and ROI to evaluate whether your media investments are generating the expected returns.
📅 Customizable Reports and Dashboards
Generate detailed, interactive reports and dashboards that can be tailored to your needs, providing valuable insights and helping you make data-driven decisions.
🚀 Why You’ll Love the Mass Media KPI Dashboard in Power BI:
✅ Track Media Campaign Reach – Monitor your mass media campaign’s audience reach and understand its impact on your target demographic.
✅ Evaluate Audience Engagement – Measure audience interaction with your campaigns across TV, radio, digital, and print media.
✅ Measure Campaign Success – Track key performance indicators like ROI, conversions, and CPI to evaluate the effectiveness of your media campaigns.
✅ Target the Right Audience – Leverage demographic and geo-targeting insights to optimize your media strategy and better reach your intended audience.
✅ Optimize Media Spend – Track media budgets and expenses in real time to ensure your campaigns stay within budget while maximizing impact.
✅ Customizable Insights – Tailor the dashboard and reports to fit your specific campaign needs and make informed decisions based on real-time data.
What’s Inside the Mass Media KPI Dashboard in Power BI:
- Media Reach Tracking: Track the audience size, frequency, and impact of each media channel (TV, radio, digital, print).
- Engagement Metrics: Analyze interactions such as clicks, shares, comments, and impressions to assess engagement levels.
- Campaign Effectiveness: Measure conversions, CPI, ROI, and other metrics to determine how effective your media campaigns are.
- Audience Demographics and Geo-Targeting: Monitor audience demographics (age, gender, location) and optimize your media strategies accordingly.
- Budget and ROI Tracker: Track media budgets, costs, and ROI to ensure cost-effective campaigns.
- Custom Reports and Insights: Create detailed, interactive reports for stakeholders and media planners, visualizing performance and optimization opportunities.
How to Use the Mass Media KPI Dashboard in Power BI:
1️⃣ Download the Template – Instantly access your Power BI file upon purchase.
2️⃣ Import Media Campaign Data – Input data for media reach, audience demographics, engagement, and ROI into the dashboard.
3️⃣ Track Key Metrics – Use the dashboard to track KPIs such as reach, engagement, cost, and ROI in real-time.
4️⃣ Analyze Campaign Performance – Evaluate the success of your media campaigns across various channels and demographics.
5️⃣ Generate Reports – Create detailed and customizable reports that highlight the most important insights from your media campaigns.
Who Can Benefit from the Mass Media KPI Dashboard in Power BI:
- Media Planners
- Marketing Teams
- Digital Advertising Managers
- Brand Managers
- Public Relations Professionals
- Advertising Agencies
- Content Managers
- Business Owners
The Mass Media KPI Dashboard in Power BI is a comprehensive and easy-to-use tool that helps businesses and media professionals track, analyze, and optimize mass media campaigns across various platforms. It enables you to make data-driven decisions, maximize your media investments, and enhance audience engagement, ensuring that your media strategies are as effective as possible.
Click here to read the Detailed blog post
https://www.pk-anexcelexpert.com/mass-media-kpi-dashboard-in-power-bi/
Visit our YouTube channel to learn step-by-step video tutorials
Youtube.com/@PKAnExcelExpert


Reviews
There are no reviews yet.