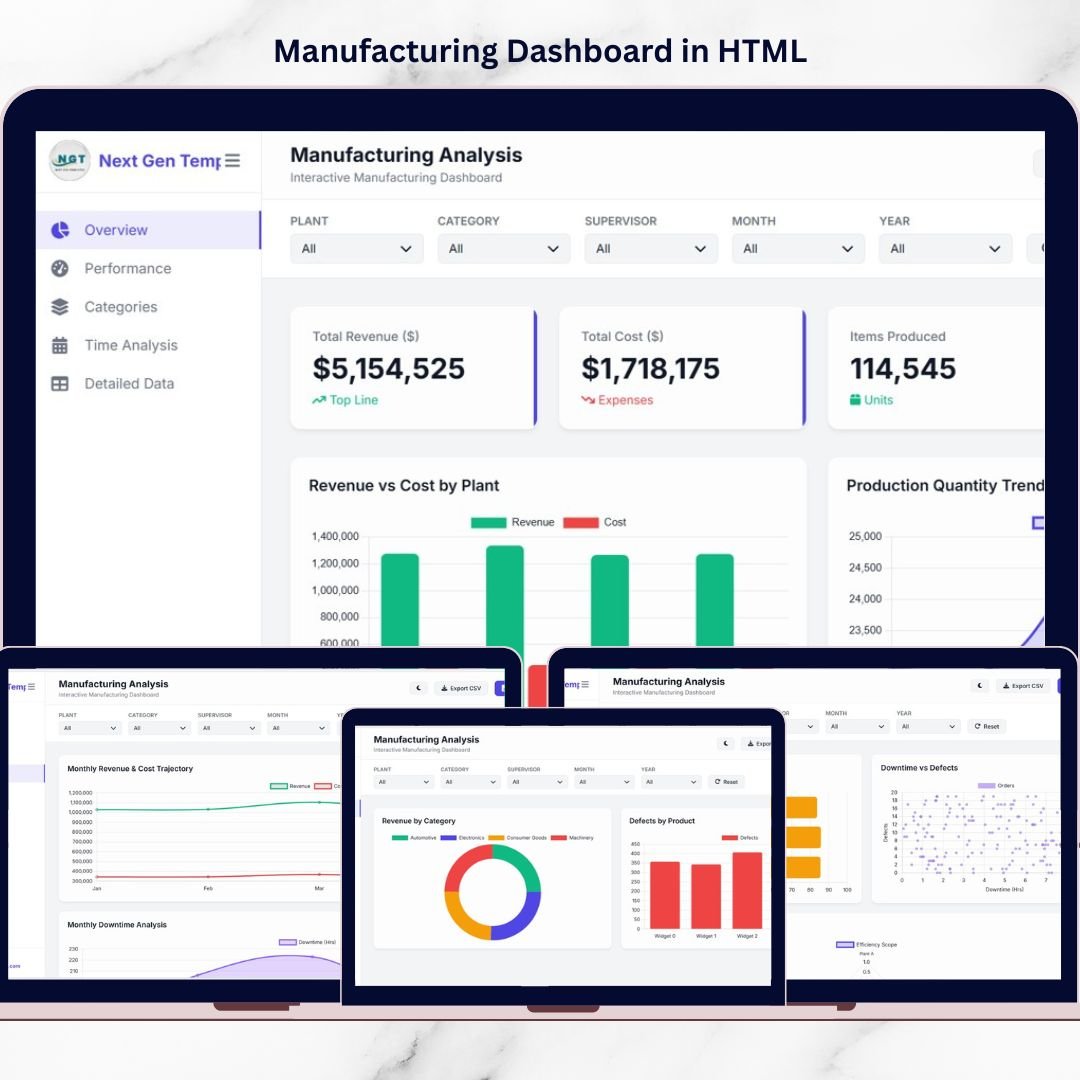
Manufacturing businesses operate in a fast-paced and highly competitive environment where efficiency, production output, and cost control directly impact profitability. However, many factories still rely on scattered spreadsheets, delayed reports, and manual data analysis. As a result, managers struggle to monitor production efficiency, identify operational issues, and evaluate manufacturing performance in real time.
That’s exactly where the Manufacturing Dashboard in HTML becomes a powerful analytics solution 📊🏭.
This modern, interactive dashboard transforms raw production data into clear and actionable insights. Instead of analyzing multiple reports manually, managers can instantly monitor production metrics through visual charts, KPI cards, filters, and data tables.
Built with HTML, JavaScript, and interactive visualization libraries, this dashboard provides a premium data analytics interface that helps manufacturing leaders track performance, detect operational bottlenecks, and improve productivity.
Whether you manage a factory, oversee production operations, or analyze manufacturing performance, this dashboard provides the visibility needed to make smarter decisions.
🚀 Key Feature of Manufacturing Dashboard in HTML
📊 Interactive Manufacturing Analytics Interface – Monitor production data through visual charts and KPI cards.
🏭 Production Performance Monitoring – Track revenue, manufacturing costs, and production quantities in real time.
📈 Operational Efficiency Insights – Measure production efficiency and identify performance gaps.
📉 Downtime & Defect Analysis – Analyze machine downtime and defect trends to improve quality.
📅 Time-Based Production Analysis – Monitor monthly production performance and operational patterns.
🔍 Advanced Data Search – Instantly search production records using a universal search feature.
📤 Export Data Capability – Export filtered data to CSV files for reporting and sharing.
🎨 Modern UI with Dark/Light Mode – Switch between themes for a better user experience.
📱 Responsive Dashboard Design – Access analytics across desktops, tablets, and other devices.
Because of these powerful features, manufacturing teams gain complete visibility into operational performance.
📦 What’s Inside the Manufacturing Dashboard in HTML?
This dashboard contains multiple analytical pages that provide deep insights into different aspects of manufacturing operations.
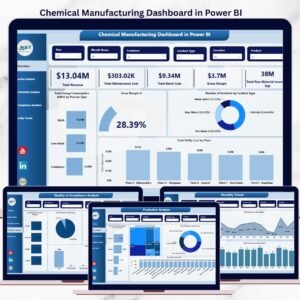
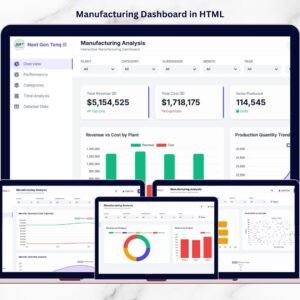
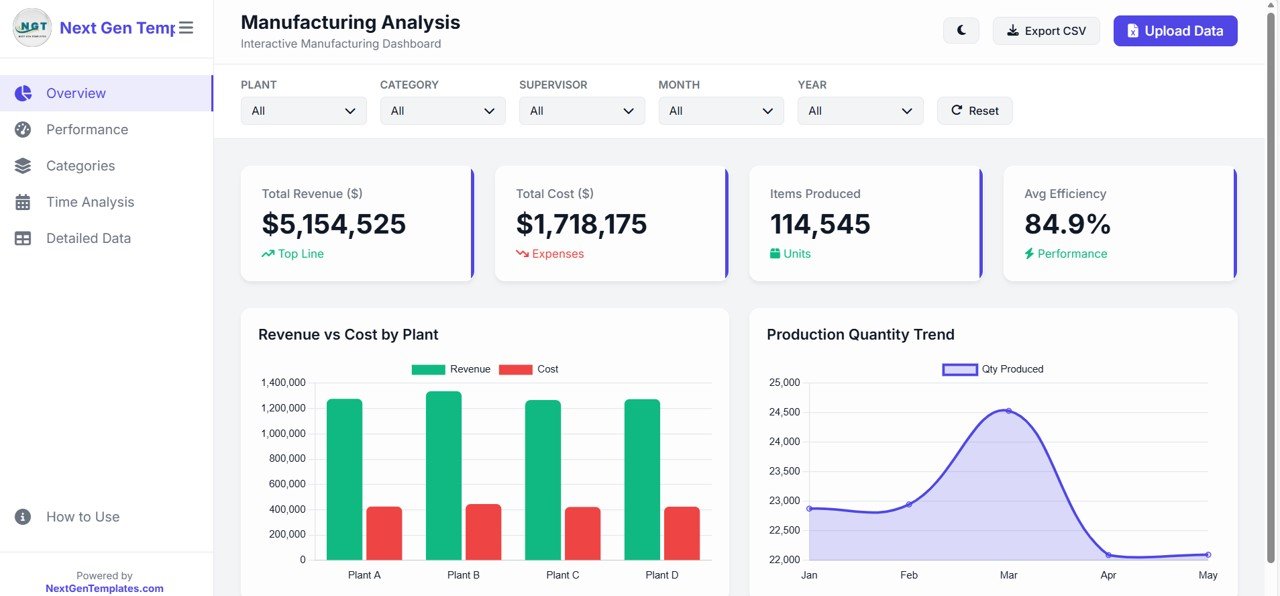
1️⃣ Overview Page – Manufacturing Performance Snapshot
The Overview Page acts as the main dashboard where users can quickly analyze overall production performance.
This page includes key KPI cards such as:
• Total Revenue generated from production
• Total Manufacturing Cost
• Total Items Produced
• Average Production Efficiency %
The page also includes important charts such as:
📊 Revenue vs Cost by Plant – Compare financial performance across manufacturing facilities.
📈 Production Quantity Trend – Track production output patterns over time.
These insights help leadership teams evaluate operational performance instantly.
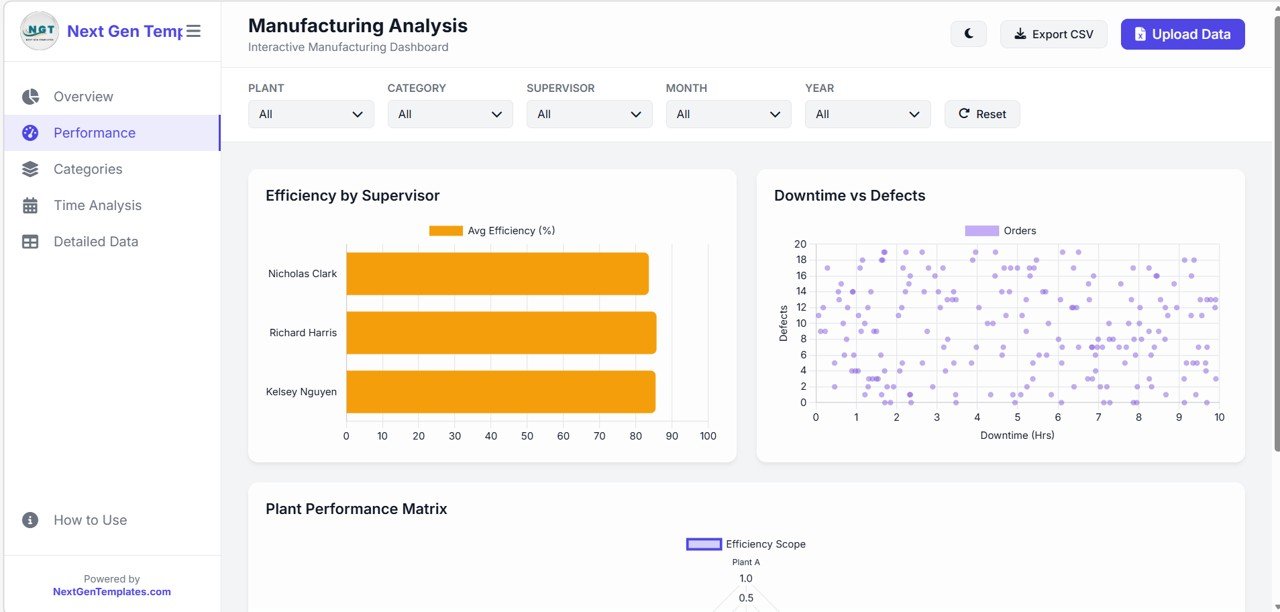
2️⃣ Performance Page – Operational Efficiency Analysis
The Performance Page focuses on analyzing manufacturing productivity and operational efficiency.
Key charts include:
📊 Efficiency by Supervisor – Compare performance across different supervisors.
📉 Downtime vs Defects Analysis – Identify relationships between equipment downtime and product defects.
📊 Plant Performance Matrix – Evaluate operational productivity across multiple plants.
This analysis helps manufacturing managers detect inefficiencies and improve operational workflows.
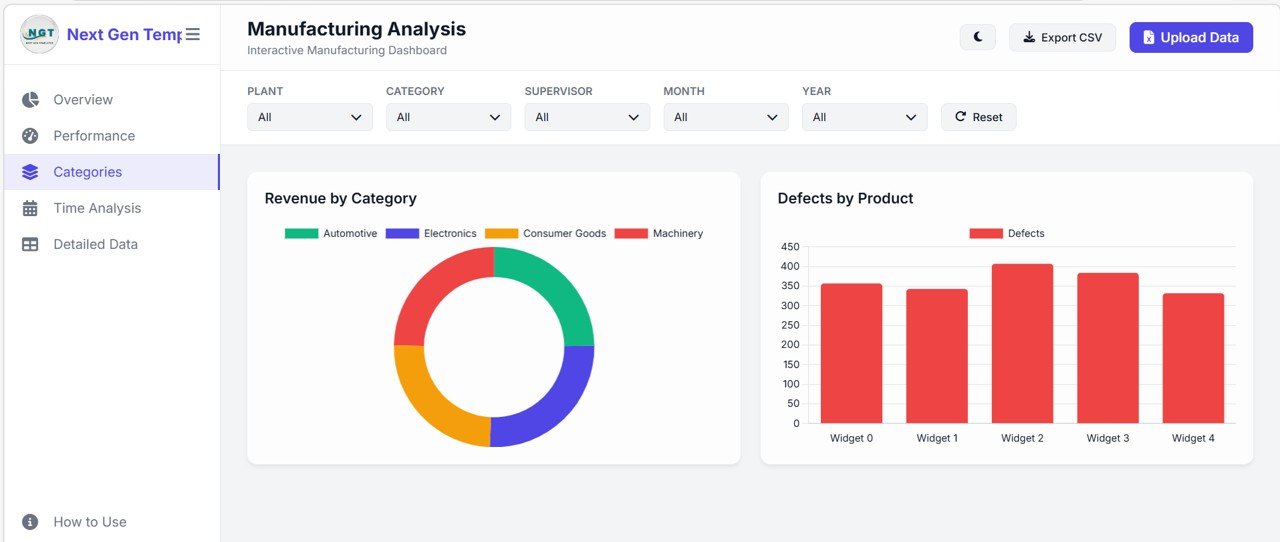
3️⃣ Categories Page – Product Performance Analysis
The Categories Page analyzes manufacturing performance by product category.
Key insights include:
📊 Revenue by Product Category – Identify profitable product segments.
📉 Defects by Product Chart – Detect products with higher defect rates.
This analysis helps quality teams improve product reliability and optimize production strategies.
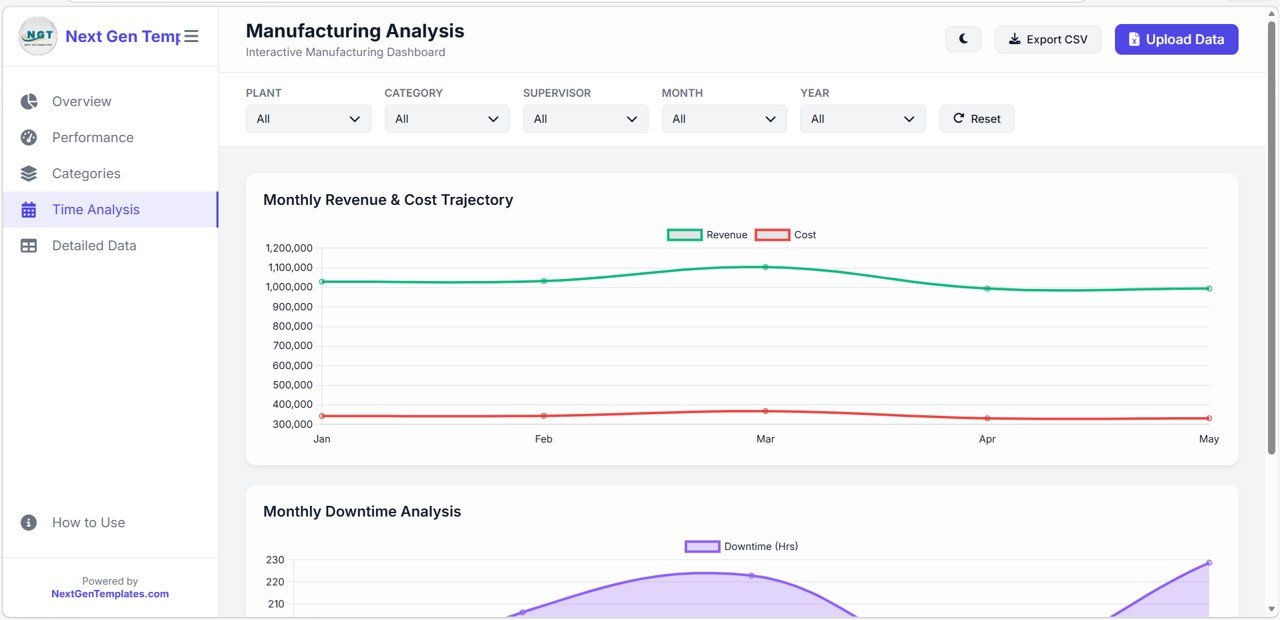
4️⃣ Time Analysis Page – Production Trend Monitoring
The Time Analysis Page provides detailed insights into manufacturing performance over time.
Important charts include:
📈 Monthly Revenue & Cost Trajectory – Track financial performance of production activities.
📉 Monthly Downtime Analysis – Monitor equipment downtime trends.
Time-based insights allow manufacturing teams to plan production schedules more effectively.
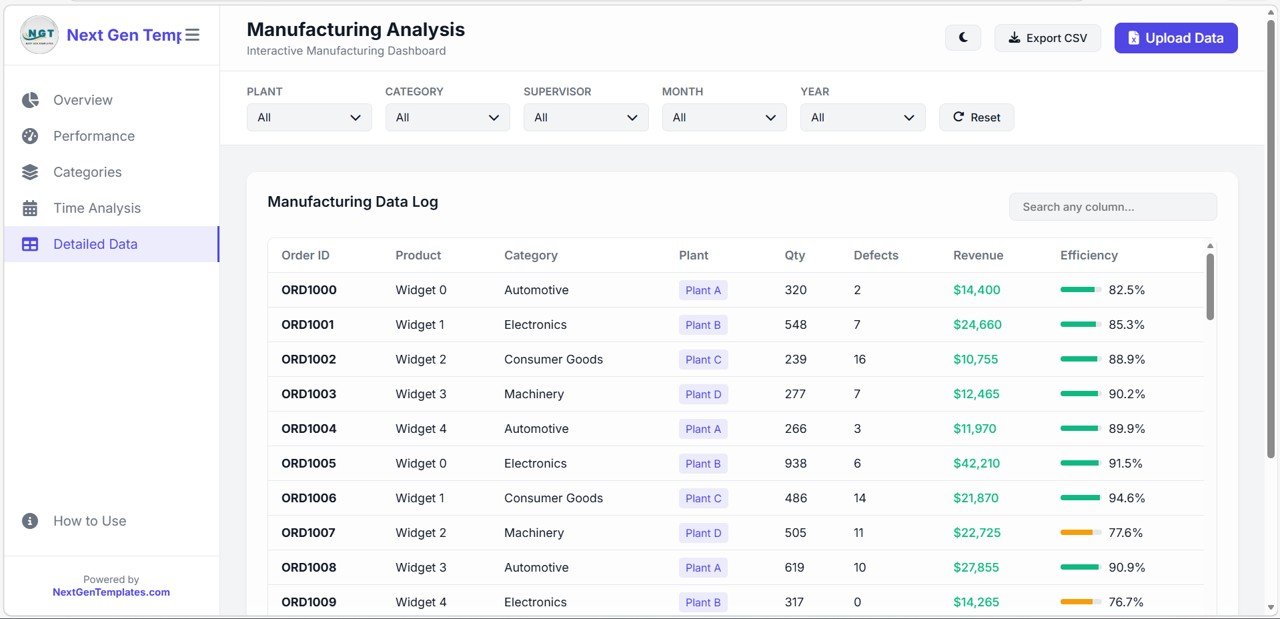
5️⃣ Detailed Data Page – Production Data Records
The Detailed Data Page contains a comprehensive data table storing all manufacturing records.
Key columns include:
• Order ID
• Product Name
• Product Category
• Manufacturing Plant
• Quantity Produced
• Defect Count
• Revenue Generated
• Efficiency %
Additional features include:
🔍 Universal Search Function – Instantly find records by Order ID, plant, or product.
📊 Dynamic Record Display – Shows the number of records currently displayed.
This page supports deeper operational analysis and data validation.
6️⃣ How to Use Page – Dashboard User Guide
The dashboard includes a How to Use page that explains how users can interact with the system.
Key instructions include:
📥 Upload Excel (.xlsx) or CSV files
🔎 Apply global filters by plant, supervisor, category, month, or year
📊 Search data instantly using the universal search feature
🎨 Switch between light and dark themes
📤 Export filtered results to CSV files
This user guide ensures that anyone can quickly start using the dashboard.
⚙️ How to Use the Manufacturing Dashboard in HTML
Using this dashboard is simple and efficient.
1️⃣ Upload your manufacturing dataset (Excel or CSV file)
2️⃣ Use filters to analyze production data by plant, category, or supervisor
3️⃣ Monitor KPI cards and visual charts
4️⃣ Search detailed records using the data table
5️⃣ Export filtered results for reporting
Because the dashboard updates dynamically, managers can analyze production performance instantly.
👥 Who Can Benefit from This Manufacturing Dashboard?
This dashboard is ideal for organizations involved in production and operations management.
✔ Manufacturing Companies
✔ Plant Managers
✔ Operations Managers
✔ Production Supervisors
✔ Quality Control Teams
✔ Supply Chain Managers
✔ Business Analysts
Any organization looking to improve production visibility and operational efficiency can benefit from this dashboard.
This dashboard helps answer critical operational questions:
• Which plants generate the highest production revenue?
• Where are defects occurring most frequently?
• Are manufacturing costs increasing over time?
• Which supervisors deliver the highest efficiency?
• How does production performance change month to month?
With these insights, companies can optimize manufacturing performance and make data-driven decisions.
Instead of relying on scattered spreadsheets and manual reports, the Manufacturing Dashboard in HTML provides a centralized analytics platform that improves operational visibility and productivity.