


Running a machine learning lab is not just about building models. Teams must manage experiments, datasets, training cycles, infrastructure usage, costs, timelines, and research outcomes—all at the same time. However, when KPIs are scattered across spreadsheets, notebooks, and reports, performance tracking becomes slow, unclear, and unreliable.
That is exactly why the Machine Learning Labs KPI Dashboard in Excel becomes a powerful performance-management solution 🚀. This ready-to-use Excel dashboard transforms scattered machine learning metrics into clear KPIs, visual indicators, and trend analysis—all inside a single, structured workbook. Instead of manually compiling reports, lab managers and leadership teams instantly see how the lab is performing today and where it is heading.
Designed for machine learning labs, AI research teams, innovation hubs, and data science departments, this dashboard helps organizations track progress, control costs, improve efficiency, and accelerate innovation with confidence.
🔑 Key Features of Machine Learning Labs KPI Dashboard in Excel
🤖 7 Structured Worksheets designed specifically for KPI governance
📊 Automated MTD & YTD Calculations with zero manual effort
📅 Dynamic Month Selection for flexible reporting
🎯 Target vs Actual & PY vs Actual Comparison
📈 Dedicated KPI Trend Analysis for strategic insights
🧭 One-Click Navigation Buttons for smooth movement across sheets
🔼🔽 Visual Performance Indicators using arrows and formatting
🧩 100% Excel-Based Solution – no coding, no macros, no BI tools
This dashboard delivers clarity, control, and consistency to machine learning KPI tracking.
📂 What’s Inside the Machine Learning Labs KPI Dashboard
🏠 Home Sheet
Acts as the navigation hub with clickable buttons for instant access to all key sheets—no scrolling, no confusion.
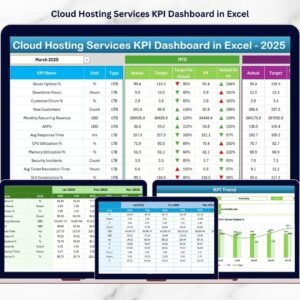
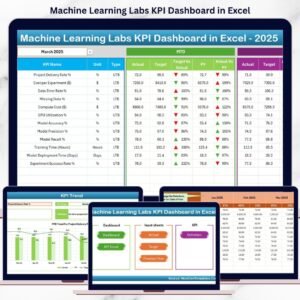
📊 Dashboard Sheet

The main KPI overview page. Users select the reporting month from a dropdown, and the dashboard automatically displays:
-
MTD Actual, Target, and Previous Year
-
Target vs Actual indicators
-
Previous Year vs Actual indicators
-
YTD Actual, Target, and Previous Year
Green and red arrows instantly highlight performance direction.
📈 KPI Trend Sheet
Allows deep KPI-level analysis by selecting a KPI name. The sheet displays:
-
KPI Group, Unit, Type (UTB/LTB)
-
KPI Formula and Definition
-
MTD Trend Chart (Actual vs Target vs PY)
-
YTD Trend Chart (Actual vs Target vs PY)
📝 Actual Numbers Input Sheet
A clean data entry sheet where teams input real MTD and YTD performance values without breaking formulas.
🎯 Target Sheet
Stores KPI targets separately, ensuring accurate benchmarking and transparent goal tracking.
📅 Previous Year Number Sheet
Captures historical KPI values to support year-over-year comparison and long-term trend analysis.
📘 KPI Definition Sheet
Acts as the single source of truth for KPI names, groups, units, formulas, and definitions—ensuring consistency across teams.
🛠️ How to Use the Machine Learning Labs KPI Dashboard
✅ Define KPIs and targets using the KPI Definition sheet
✅ Enter actual performance data monthly
✅ Select the reporting month from the dropdown
✅ Review MTD and YTD performance instantly
✅ Analyze trends and take corrective action
No advanced Excel skills are required. The dashboard is intuitive, structured, and business-ready.
👥 Who Can Benefit from This Machine Learning Labs KPI Dashboard?
🤖 Machine Learning Lab Managers
📊 Data Science Team Leads
🧠 AI & Research Heads
🚀 Innovation & R&D Teams
📈 AI Project Managers
🎓 Academic Research Labs
Whether managing small experimental labs or enterprise-scale AI teams, this dashboard adapts effortlessly.
👉 Click here to read the Detailed blog post
▶️ Visit our YouTube channel to learn step-by-step video tutorials
https://youtube.com/@PKAnExcelExpert


Reviews
There are no reviews yet.