Loan Recovery Services Dashboard is one of the most critical functions for banks, NBFCs, microfinance institutions, and lending organizations. Every delayed recovery, rising legal cost, or unnoticed outstanding balance directly impacts cash flow and financial stability. However, many recovery teams still depend on scattered Excel sheets, delayed manual reports, and fragmented data sources. As a result, managers struggle to track open cases, monitor agency performance, and control recovery costs effectively.
That is exactly why the Loan Recovery Services Dashboard in Power BI becomes a powerful and practical solution 🚀.
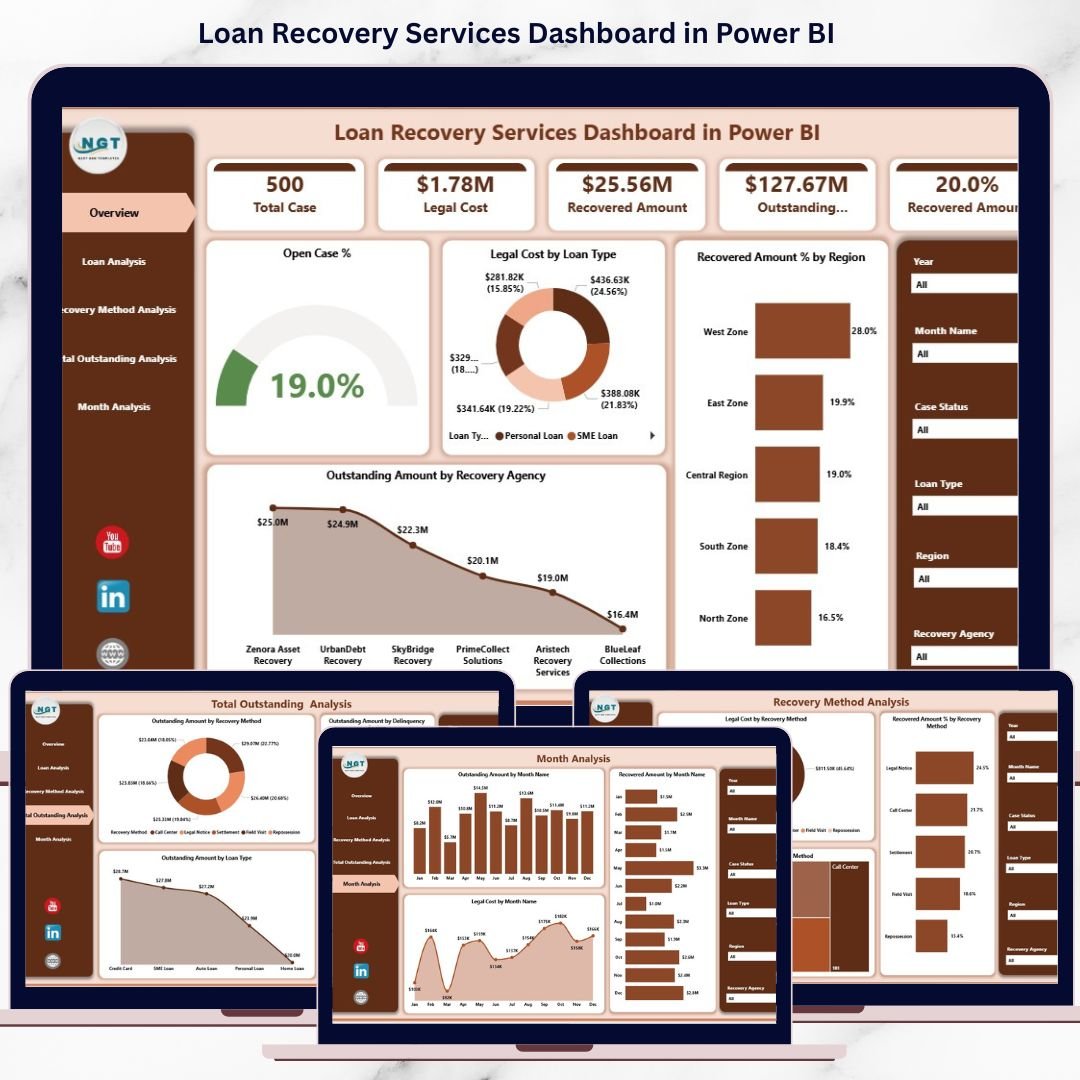
This ready-to-use Power BI dashboard transforms complex loan recovery data into clear, visual, and actionable insights. Instead of juggling multiple spreadsheets for outstanding amounts, recovered values, legal expenses, and recovery methods, teams gain a centralized and interactive view of the entire recovery pipeline. Because Power BI updates visuals instantly based on slicer selections, decision-makers always work with the most relevant and up-to-date insights.
Whether your goal is faster recoveries, better cost control, or improved compliance, this dashboard empowers recovery teams to move from reactive reporting to proactive decision-making.
🔑 Key Features of Loan Recovery Services Dashboard in Power BI
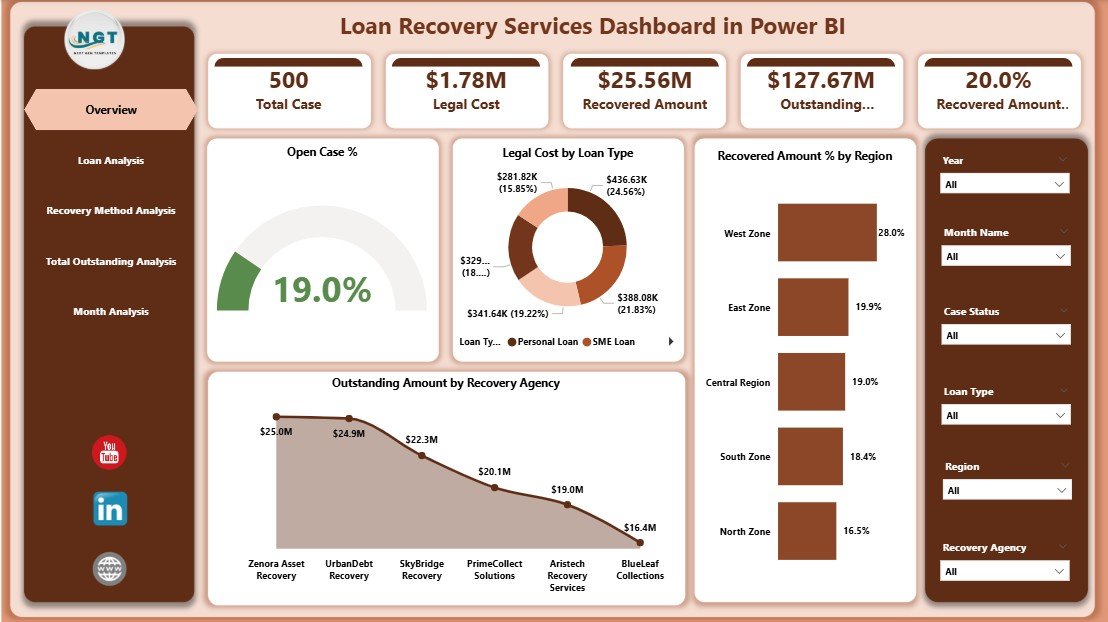
📊 Centralized Recovery Monitoring – Track open cases, recovered amounts, outstanding balances, and legal costs in one dashboard
🎯 Interactive Slicers – Filter recovery performance by loan type, region, agency, recovery method, and period
📈 Executive KPI Cards – Instantly view open case percentage and key recovery indicators
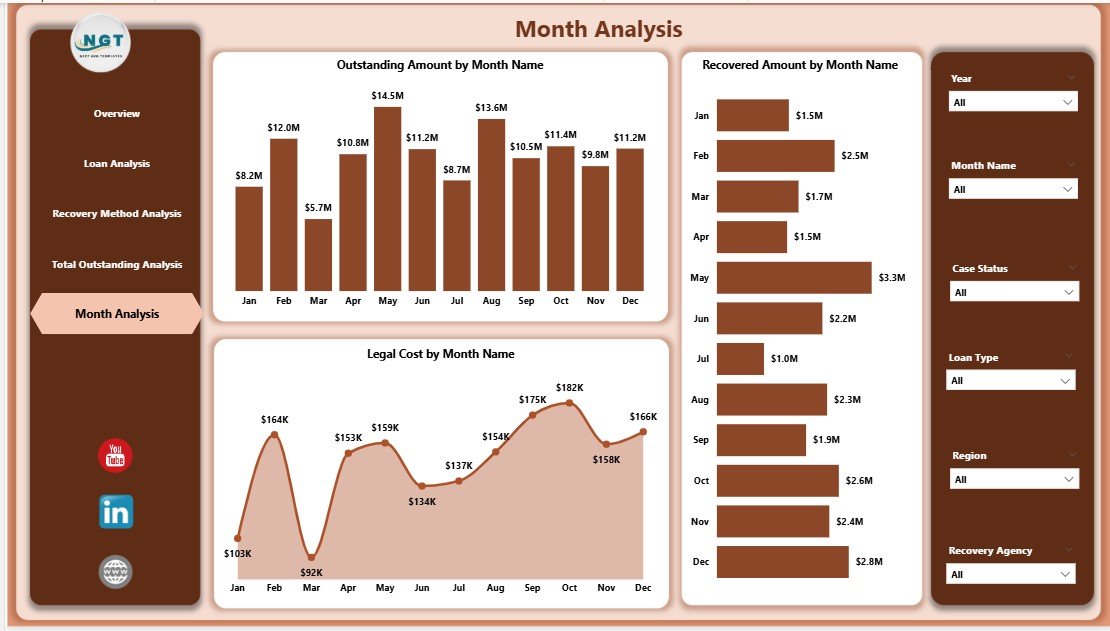
⚖️ Legal Cost Analysis – Monitor and control legal expenses across loan types and recovery methods
🏦 Agency & Region Performance Comparison – Identify high-risk and high-performing segments
📅 Monthly Trend Analysis – Track recovery progress and risk patterns over time
⚡ Real-Time Visual Refresh – Update source data and refresh insights instantly
🔍 Drill-Down & Comparative Views – Analyze recovery efficiency deeply without rebuilding reports
📂 What’s Inside the Loan Recovery Services Dashboard in Power BI
This digital product includes five well-structured analytical pages, each designed to answer a specific recovery-related question:
📌 Overview Page – Executive snapshot with KPI cards and high-level recovery insights
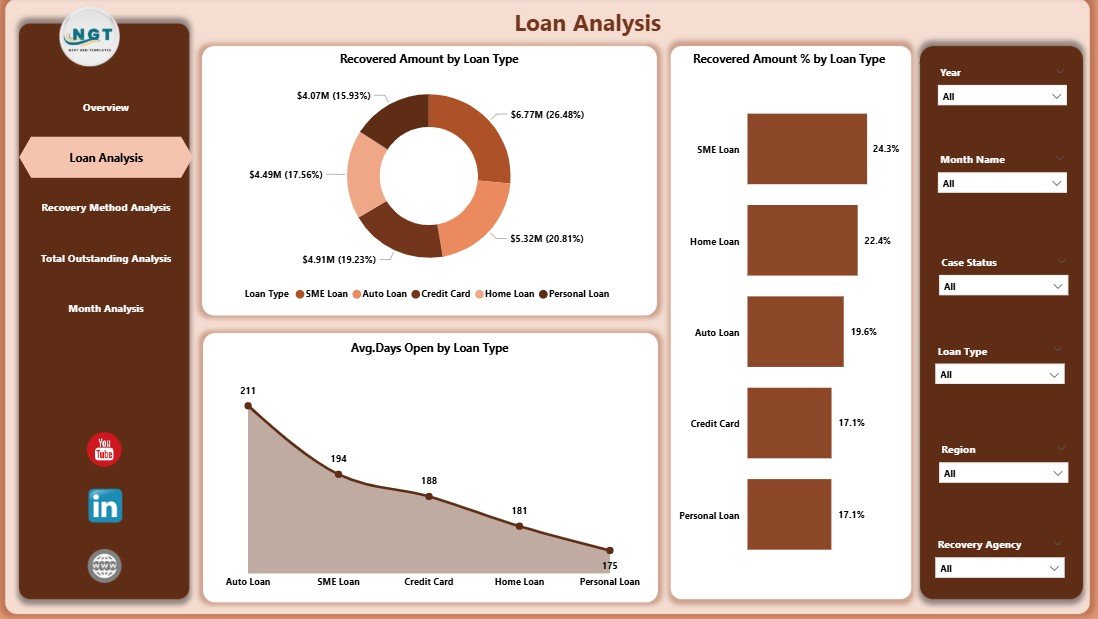
📌 Loan Analysis Page – Recovery performance by loan type, including recovered amount %, recovery speed, and efficiency
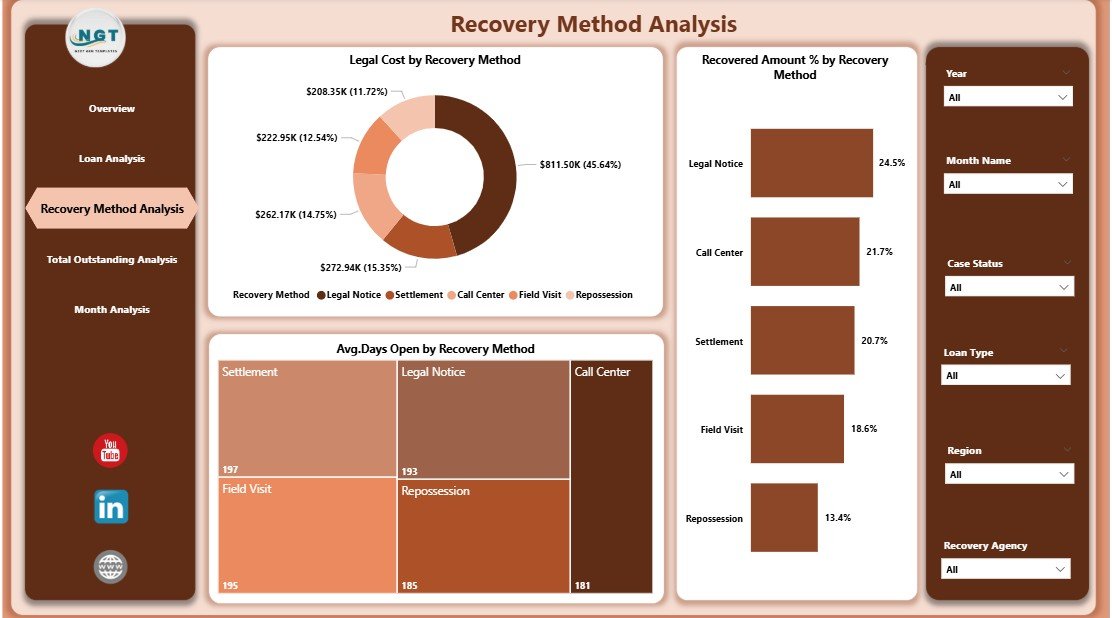
📌 Recovery Method Analysis Page – Cost and effectiveness comparison across recovery methods
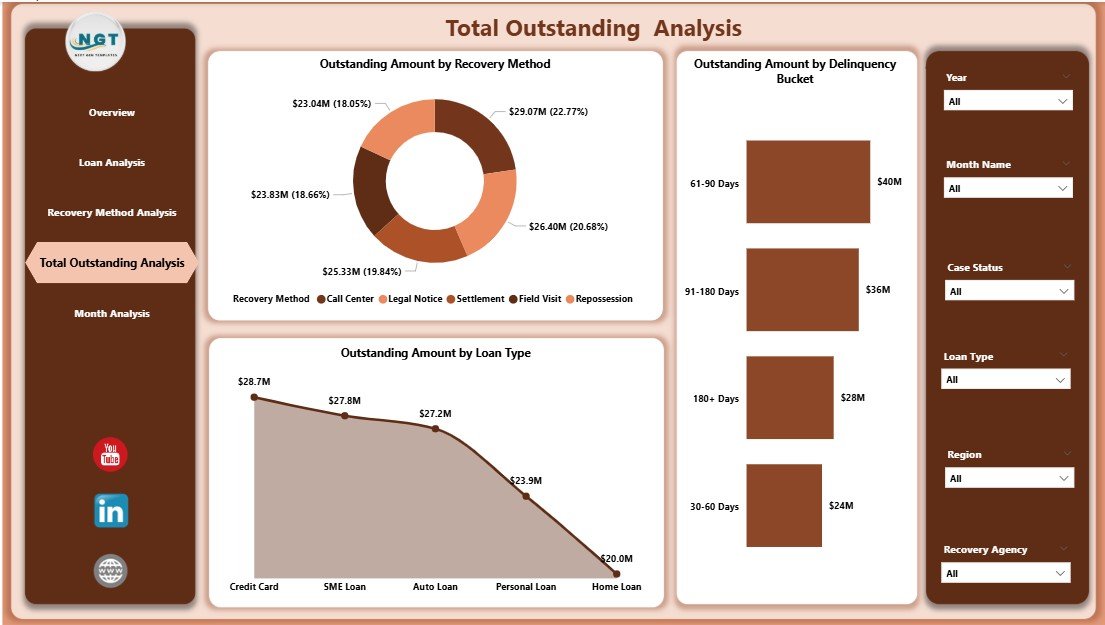
📌 Total Outstanding Analysis Page – Deep dive into unresolved balances by agency and method
📌 Monthly Trends Page – Time-based analysis of recovered amount, outstanding balance, and legal cost
The dashboard connects seamlessly to structured data sources, ensuring accurate calculations and reliable insights.
🛠️ How to Use the Loan Recovery Services Dashboard in Power BI
Using this dashboard is straightforward and business-friendly:
1️⃣ Update loan recovery data in the connected source (Excel or database)
2️⃣ Refresh the Power BI dashboard
3️⃣ Use slicers to filter by loan type, region, agency, or recovery method
4️⃣ Start with the Overview Page for instant clarity
5️⃣ Drill down into detailed pages for deeper analysis
6️⃣ Review monthly trends to track progress and risk
7️⃣ Share insights with leadership using one professional dashboard
No complex setup. No manual calculations. Just fast, reliable recovery insights.
👥 Who Can Benefit from This Loan Recovery Services Dashboard in Power BI
This dashboard is ideal for:
🏦 Banks & Cooperative Banks – Improve recovery efficiency and risk control
💳 NBFCs & Finance Companies – Monitor outstanding balances and legal costs
📊 Microfinance Institutions – Track regional and loan-wise recovery performance
⚖️ Debt Collection & Recovery Agencies – Evaluate agency productivity and effectiveness
📈 Finance & Strategy Teams – Support cash-flow forecasting and decision-making
🧾 Compliance & Audit Teams – Enhance transparency and reporting accuracy
Because the dashboard is flexible, it adapts easily to different lending models.


Reviews
There are no reviews yet.