Legal research is the foundation of strong legal opinions, effective case preparation, and accurate compliance decisions. However, many legal teams still track research work using emails, notes, or scattered spreadsheets. As a result, productivity gaps remain hidden, timelines slip, and leadership struggles to measure real performance.
That is exactly where the Legal Research KPI Dashboard in Excel delivers real value.
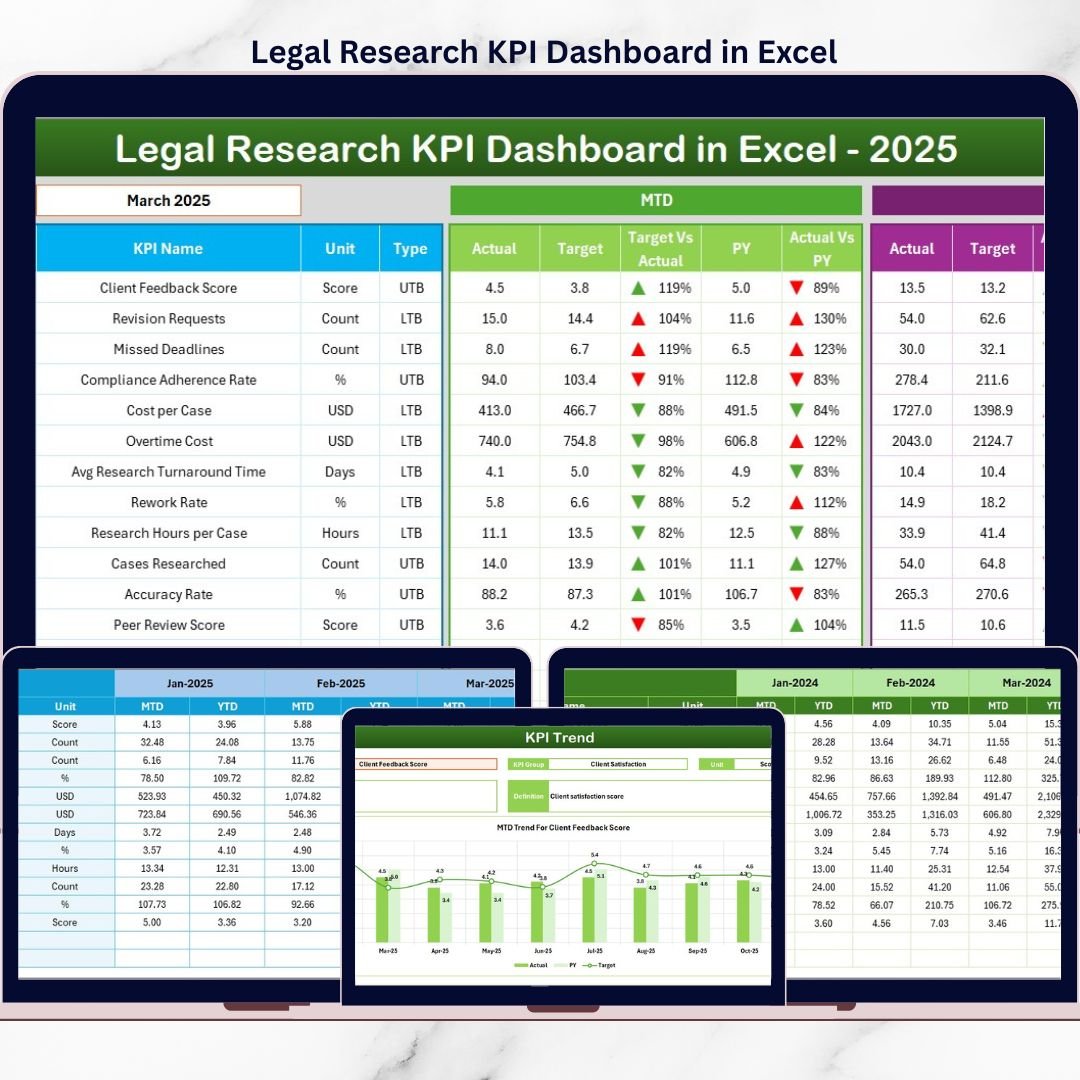
This ready-to-use Excel dashboard helps legal teams track, analyze, and monitor legal research performance using structured KPIs, MTD and YTD views, and trend analysis. Instead of guessing performance, you gain clear, data-driven insights—all inside a familiar Excel environment.
🔑 Key Features of Legal Research KPI Dashboard in Excel
The Legal Research KPI Dashboard in Excel is built to provide clarity, control, and visibility without complexity.
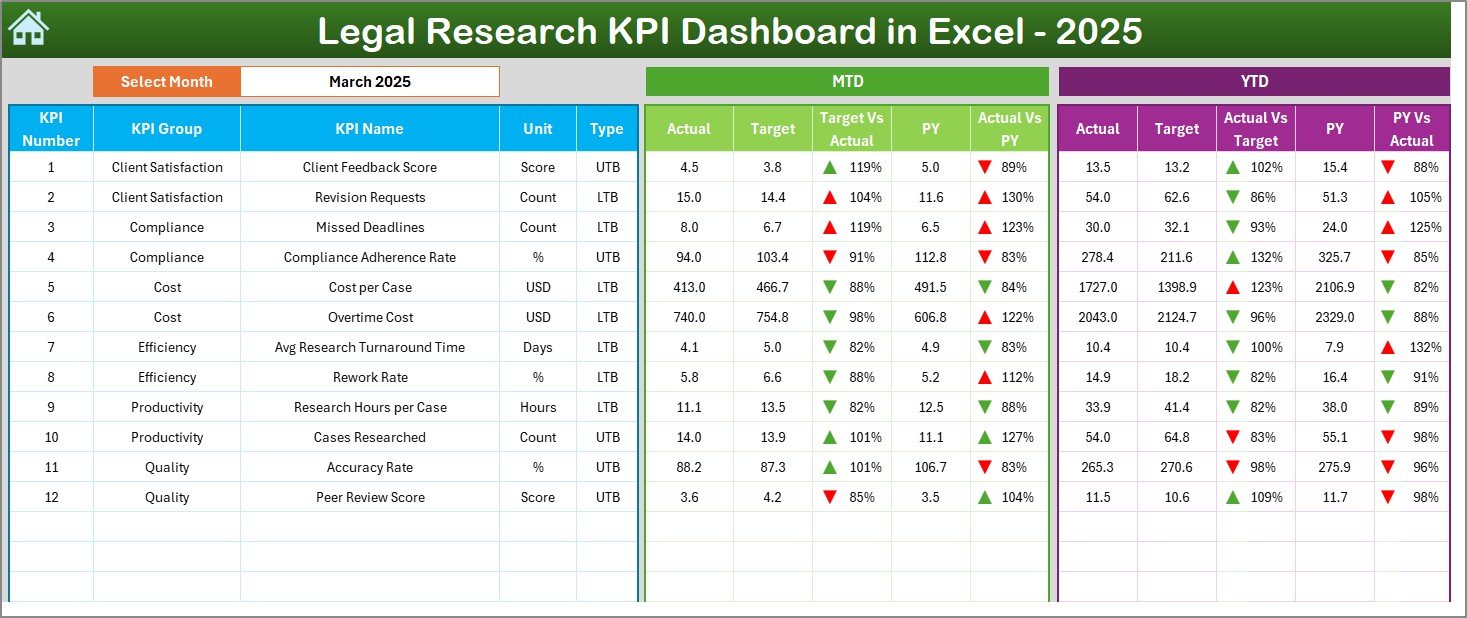
It offers a centralized dashboard view where all legal research KPIs are displayed in one place. Users can select the reporting month from a dropdown, and the entire dashboard updates automatically.
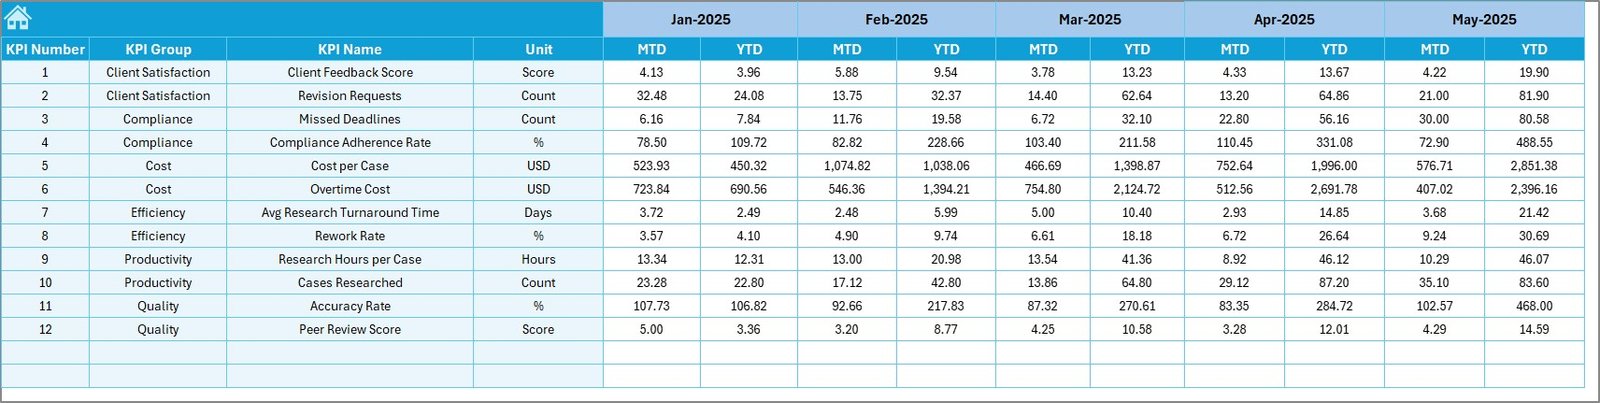
The dashboard highlights MTD (Month-to-Date) and YTD (Year-to-Date) performance with:
-
Actual values
-
Target values
-
Previous year values
Clear Target vs Actual and Previous Year vs Actual comparisons use up/down arrows and conditional formatting, making performance direction instantly visible.
Additionally, the dashboard supports KPI trend analysis, helping teams understand performance movement over time rather than relying on isolated numbers.
All features work seamlessly within Excel—no external BI tools required.
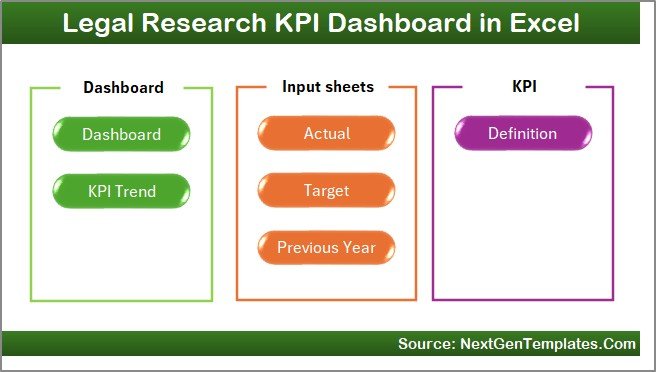
📦 What’s Inside the Legal Research KPI Dashboard in Excel
This digital product includes seven well-structured worksheets, each serving a specific purpose.
The Home Sheet acts as a navigation hub with buttons that allow users to jump instantly to different sections of the dashboard.
The Dashboard Sheet is the main performance view. It displays MTD and YTD Actual, Target, and Previous Year values along with visual indicators for quick insights.
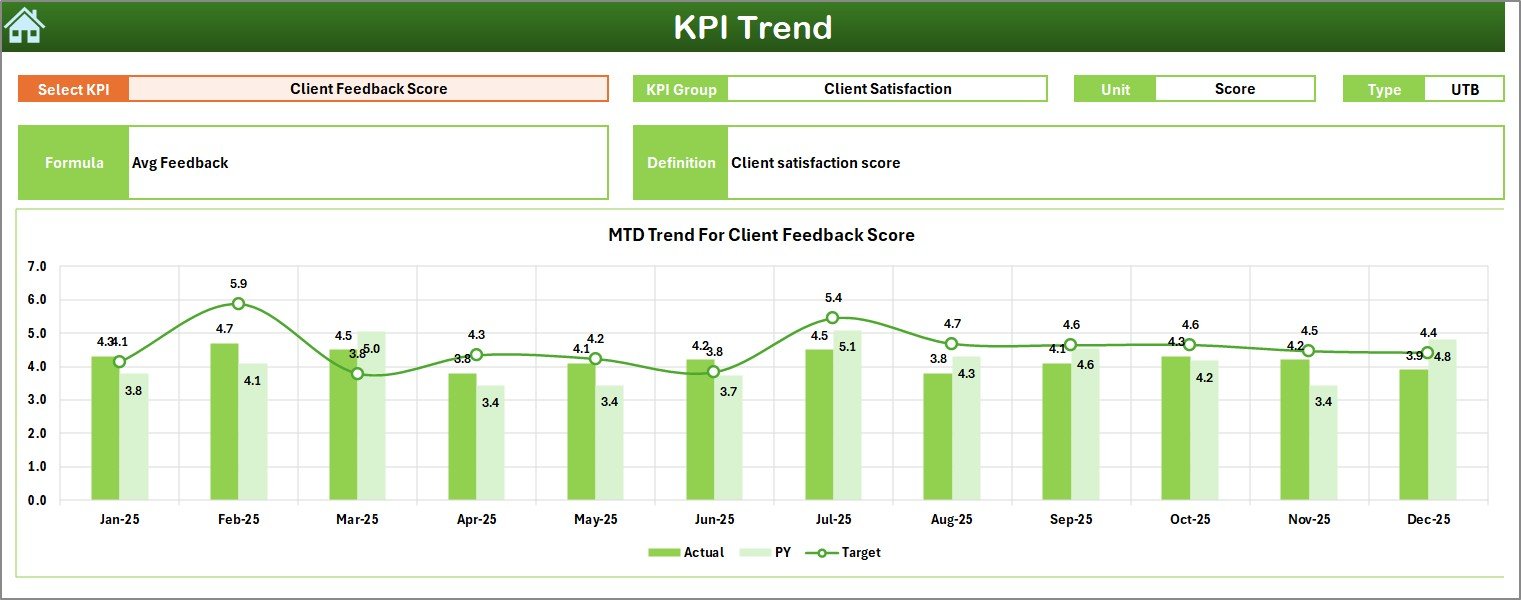
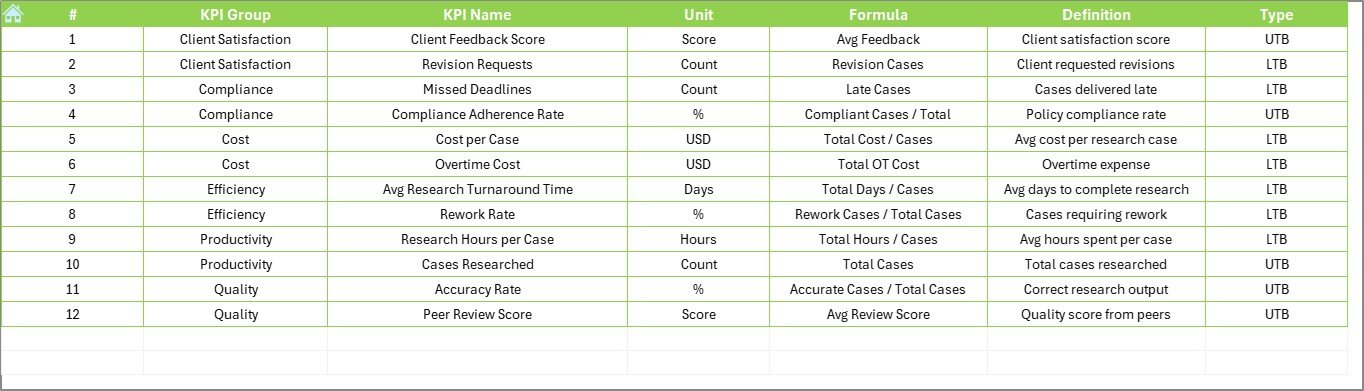
The KPI Trend Sheet enables deep-dive analysis. Users select a KPI from a dropdown and instantly see:
-
KPI Group
-
Unit of KPI
-
KPI Type (Lower the Better / Upper the Better)
-
KPI Formula
-
KPI Definition
It also shows MTD and YTD trend charts for Actual, Target, and Previous Year values.
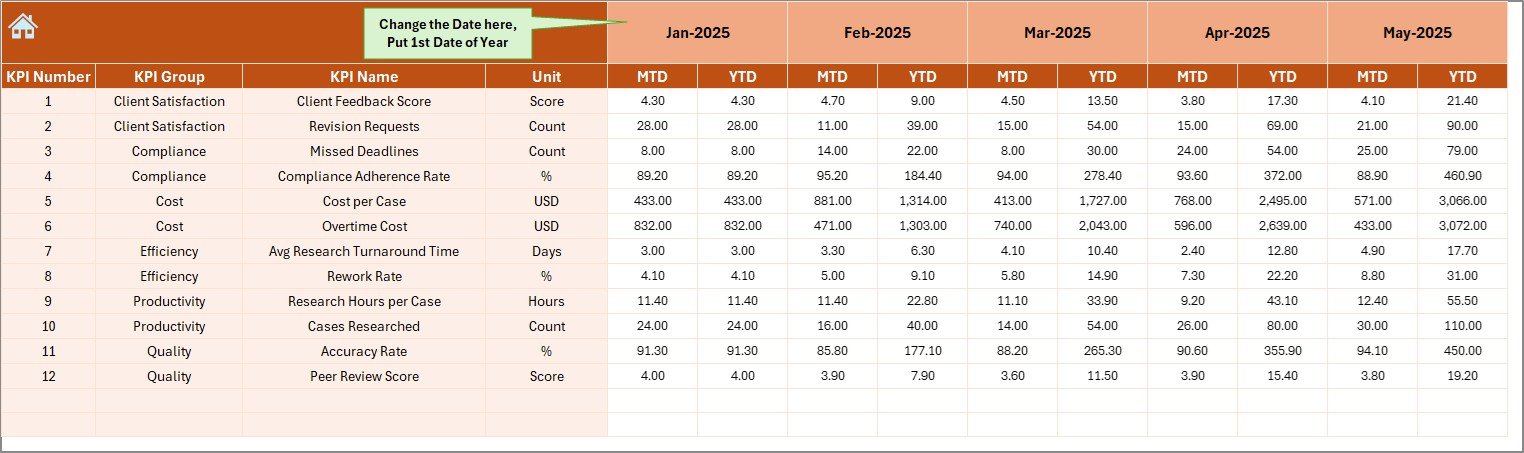
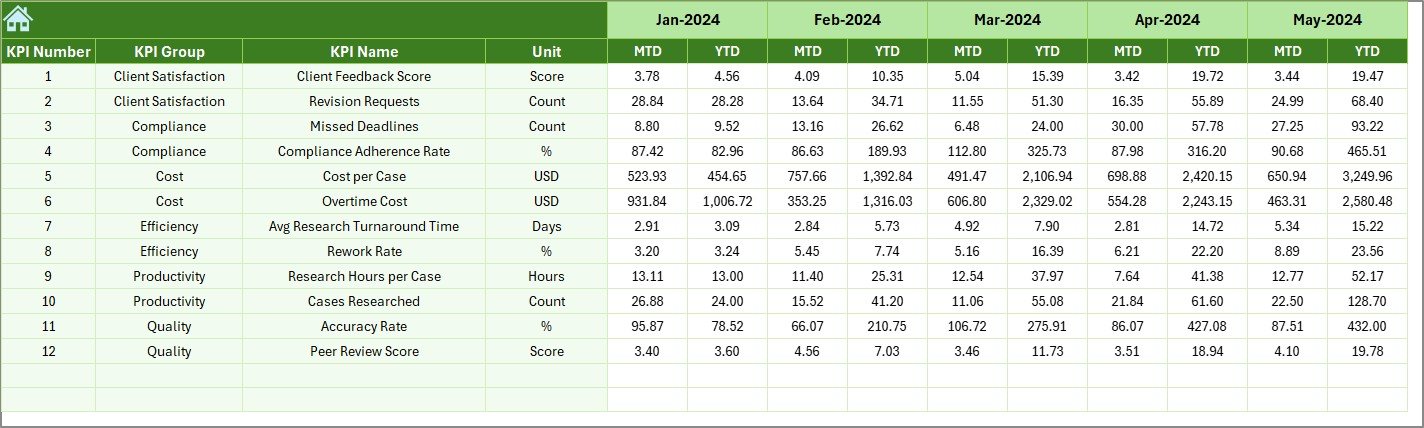
The Actual Numbers Input Sheet is where users enter real performance data. The Target Sheet stores planned targets, while the Previous Year Number Sheet holds historical KPI data.
Finally, the KPI Definition Sheet documents KPI names, groups, units, formulas, and definitions—ensuring consistency and clarity across teams.
🚀 How to Use the Legal Research KPI Dashboard in Excel
Using this dashboard is straightforward.
First, define all KPIs clearly in the KPI Definition Sheet. Next, enter Actual values in the Actual Numbers Input Sheet, Targets in the Target Sheet, and historical values in the Previous Year Number Sheet.
Then, go to the Dashboard Sheet and select the reporting month. The dashboard updates automatically to show MTD and YTD performance.
For deeper analysis, open the KPI Trend Sheet, select a KPI, and review its trend behavior over time. This step-by-step flow ensures smooth performance monitoring without technical complexity.
👥 Who Can Benefit from This Legal Research KPI Dashboard in Excel
This dashboard is ideal for a wide range of legal professionals and organizations.
Law firms can track research productivity. Corporate legal departments can monitor efficiency. Compliance teams can evaluate research quality. Legal consultants can analyze workload trends. Regulatory bodies can use it for structured reporting.
If your goal is to improve efficiency, visibility, and accountability in legal research, this dashboard is built for you.
📌 Why This Excel Dashboard Is a Smart Choice
The Legal Research KPI Dashboard in Excel helps teams identify inefficiencies early, track progress clearly, and support better legal decisions.
Because it runs in Excel, it is cost-effective, easy to implement, and flexible making it a practical alternative to expensive analytics platforms.
📖 Click here to read the Detailed blog post
🎥 Visit our YouTube channel to learn step-by-step video tutorials
👉 https://youtube.com/@PKAnExcelExpert


Reviews
There are no reviews yet.