In today’s digital-first economy, keywords decide visibility, traffic, and revenue. Rankings change constantly. Search intent evolves every month. Targets shift. Yet many teams still track keyword performance using scattered Excel files, screenshots from SEO tools, and manual reports. As a result, insights get delayed, opportunities are missed, and decision-making becomes reactive.
That is exactly where the Keyword Performance KPI Dashboard in Power BI becomes a game-changing solution 🚀
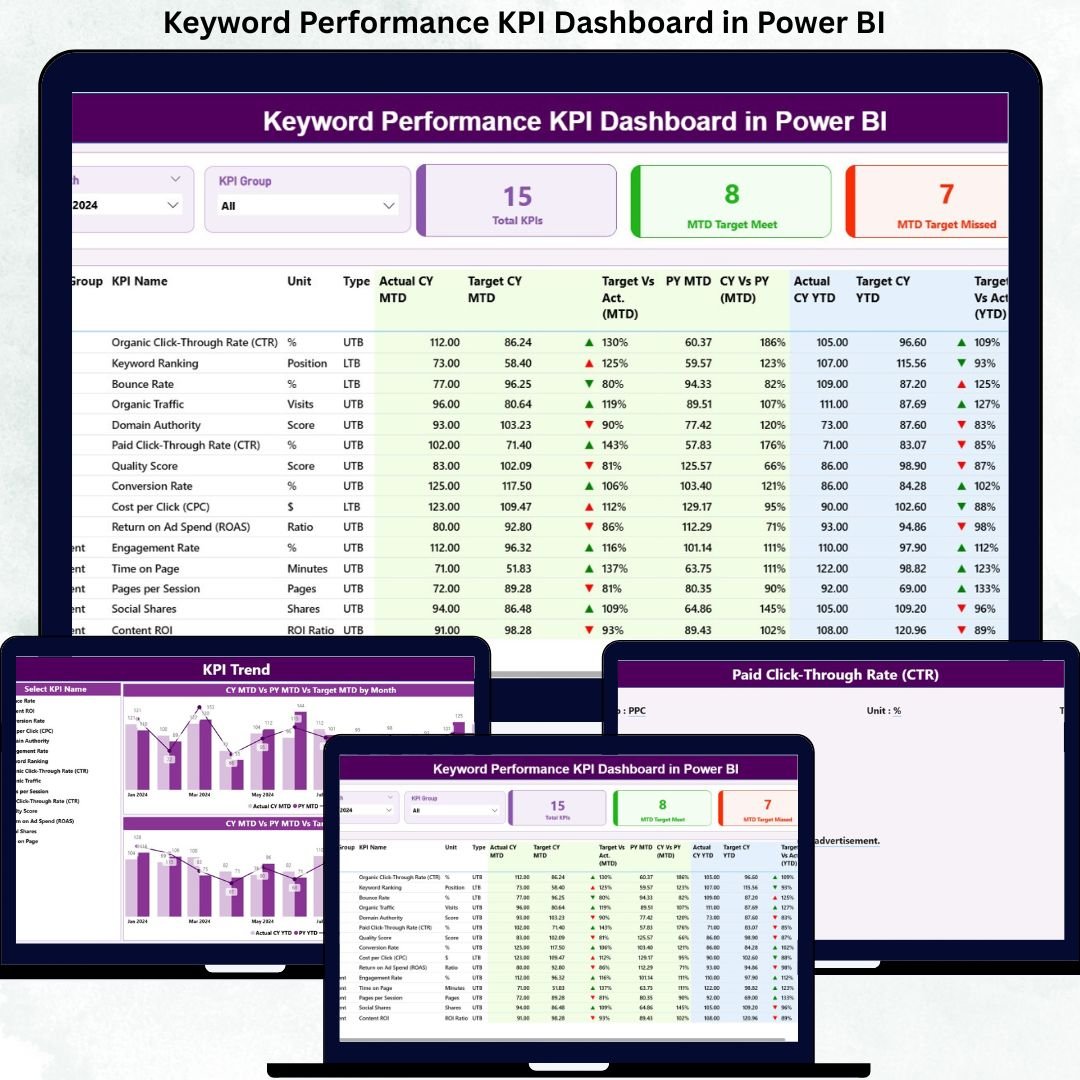
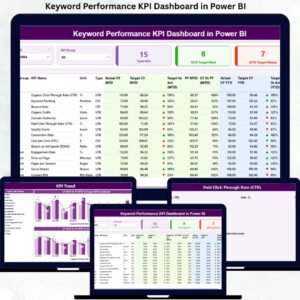
This ready-to-use Power BI dashboard converts raw keyword data into clear KPIs, trend analysis, and instant performance indicators. Instead of guessing which keywords perform well, you see MTD, YTD, target vs actual, and year-over-year performance in one professional dashboard.
Designed for SEO teams, marketers, agencies, and business owners, this dashboard helps you track results, identify gaps, and optimize keyword strategy with confidence.
Key Features of Keyword Performance KPI Dashboard in Power BI 🔑
📊 Centralized Keyword KPI Tracking
Track all keyword KPIs in one structured and visual Power BI dashboard.
🎯 MTD & YTD Performance Monitoring
Instantly see Month-to-Date and Year-to-Date keyword performance.
📈 Target vs Actual Comparison
Clearly identify which keywords meet targets and which miss them.
📉 Current Year vs Previous Year Analysis
Understand real growth using CY vs PY comparisons.
🚦 Visual Status Indicators
Green ▲ and Red ▼ icons instantly highlight performance status.
🧩 KPI Group Segmentation
Group keywords by SEO, Paid, Brand, Campaign, or strategy.
📅 Month & KPI Group Slicers
Filter performance dynamically for faster analysis.
📊 Trend Analysis with Combo Charts
Analyze keyword behavior over time using MTD and YTD trends.
📘 Built-In KPI Definition Page
Ensure clarity with KPI definitions, formulas, and units.
What’s Inside the Keyword Performance KPI Dashboard 📁
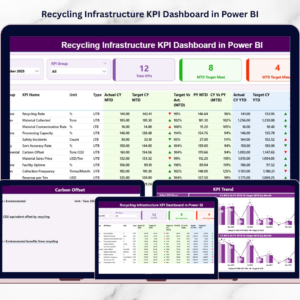
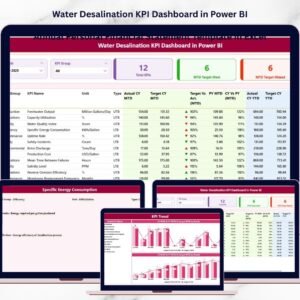
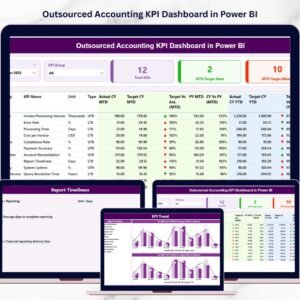
This dashboard includes three well-structured Power BI pages, each designed for a specific analytical purpose.
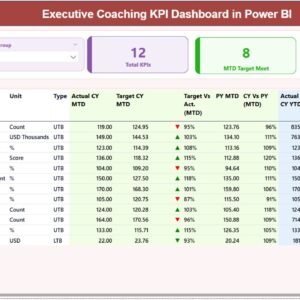
📄 1. Summary Page – Instant Keyword Health Check
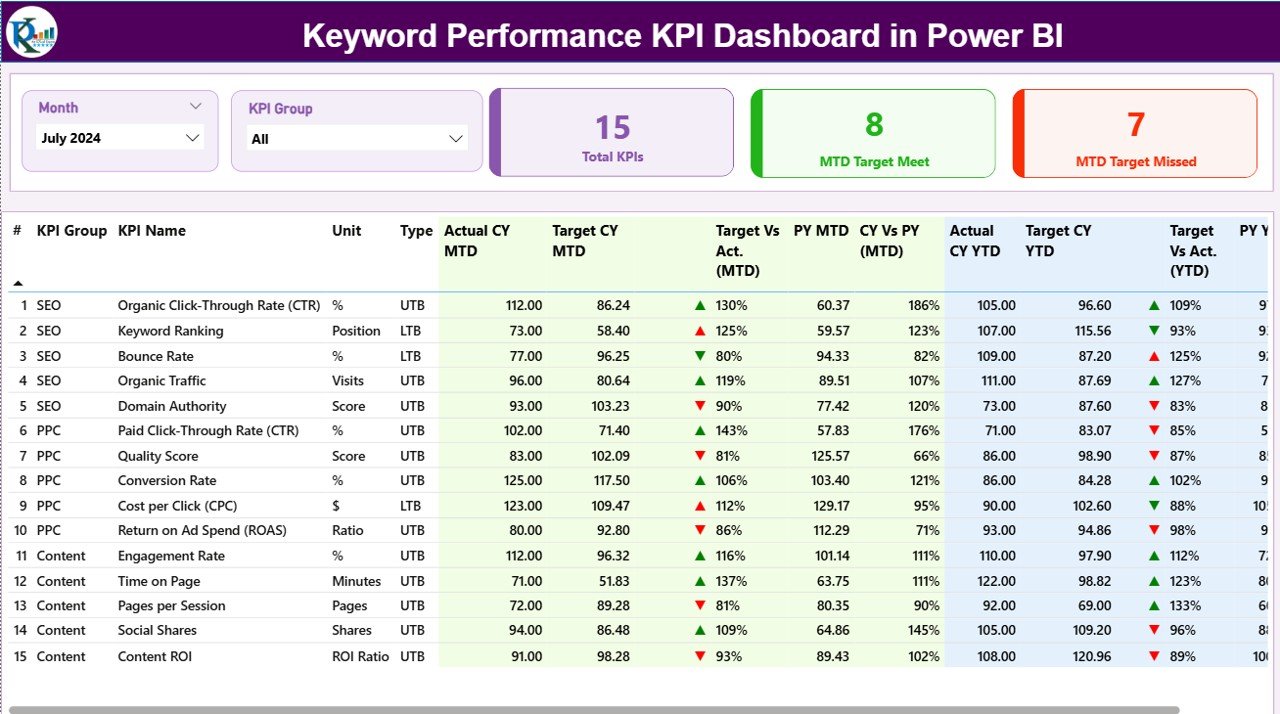
This is the main landing page of the dashboard.
Includes:
-
Slicers: Month & KPI Group
-
KPI Cards:
-
Total KPIs Count
-
MTD Target Meet Count
-
MTD Target Missed Count
-
Detailed KPI Performance Table
Each row represents a keyword KPI with complete visibility:
-
KPI Number
-
KPI Group
-
KPI Name
-
Unit
-
Type: LTB (Lower the Better) / UTB (Upper the Better)
MTD Metrics
-
Actual CY MTD
-
Target CY MTD
-
Target vs Actual (MTD)
-
MTD Performance Icon
-
PY MTD
-
CY vs PY (MTD)
YTD Metrics
-
Actual CY YTD
-
Target CY YTD
-
Target vs Actual (YTD)
-
YTD Performance Icon
-
PY YTD
-
CY vs PY (YTD)
This page answers one key question instantly:
👉 Which keywords perform, and which need action?
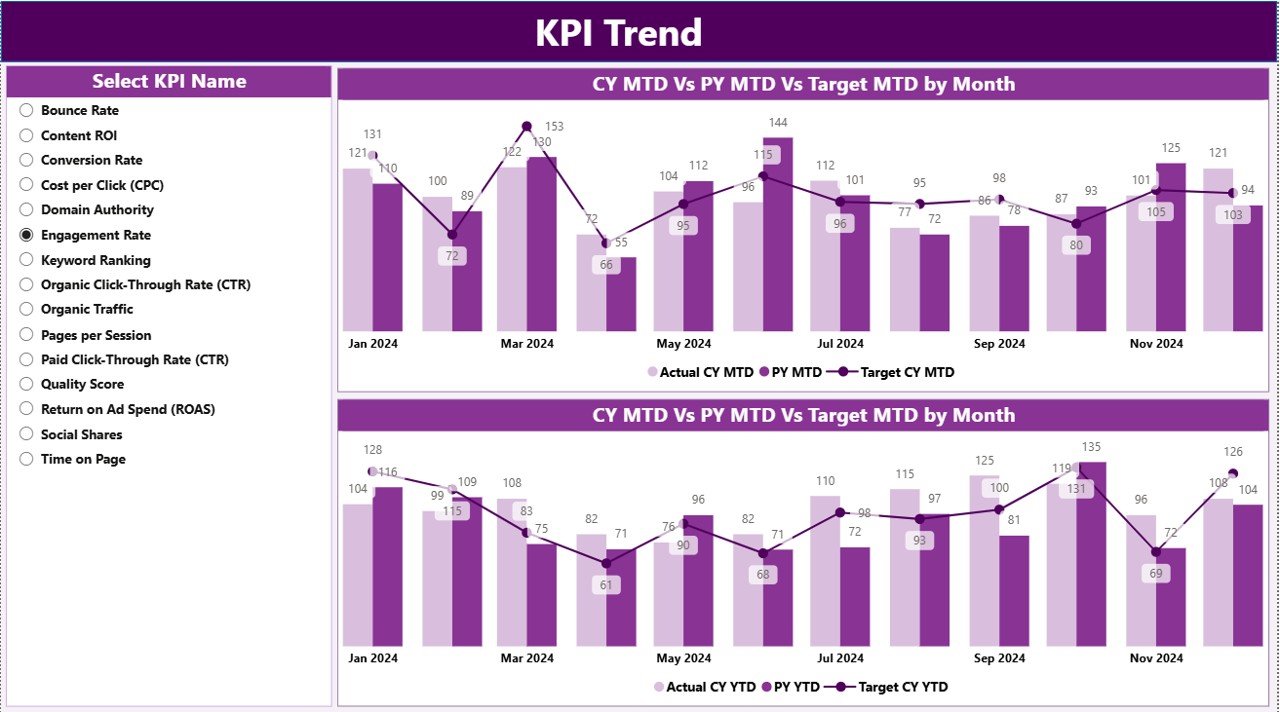
📄 2. KPI Trend Page – Keyword Performance Over Time
This page focuses on trend-based insights, not static numbers.
Includes:
-
MTD Trend Combo Chart
-
YTD Trend Combo Chart
-
KPI Name slicer on the left
Each chart compares:
-
Current Year Actual
-
Previous Year Actual
-
Target Values
This page helps you:
✔ Identify growth patterns
✔ Detect seasonal behavior
✔ Spot early performance drops
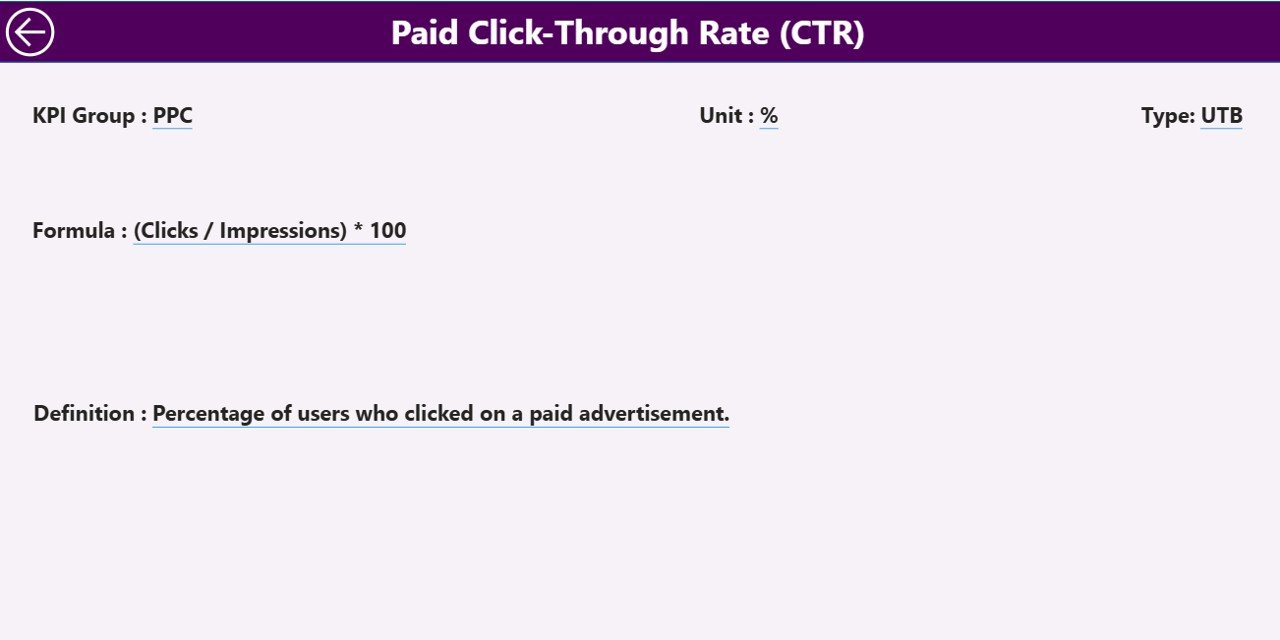
📄 3. KPI Definition Page – Clarity & Consistency
This hidden drill-through page ensures everyone understands the KPIs.
Includes:
-
KPI Definition
-
KPI Formula
-
KPI Unit
-
KPI Type (LTB / UTB)
A Back Button allows instant navigation to the Summary Page.
How to Use the Keyword Performance KPI Dashboard 🛠️
1️⃣ Enter Actual keyword data in the Excel file
2️⃣ Enter Target keyword data
3️⃣ Define KPIs and groups
4️⃣ Refresh the Power BI dashboard
5️⃣ Analyze MTD, YTD, trends, and gaps
No manual calculations. No complex modeling. Just insights.
Who Can Benefit from This Dashboard 👥
🔍 SEO Managers – Track keyword growth accurately
📣 Digital Marketers – Align keywords with campaign goals
🧠 Content Strategists – Optimize content based on trends
📊 Marketing Analysts – Simplify KPI reporting
🏢 Business Owners & Agencies – Monitor ROI-driven keywords
Perfect for small teams, agencies, and enterprise marketing teams.


Reviews
There are no reviews yet.