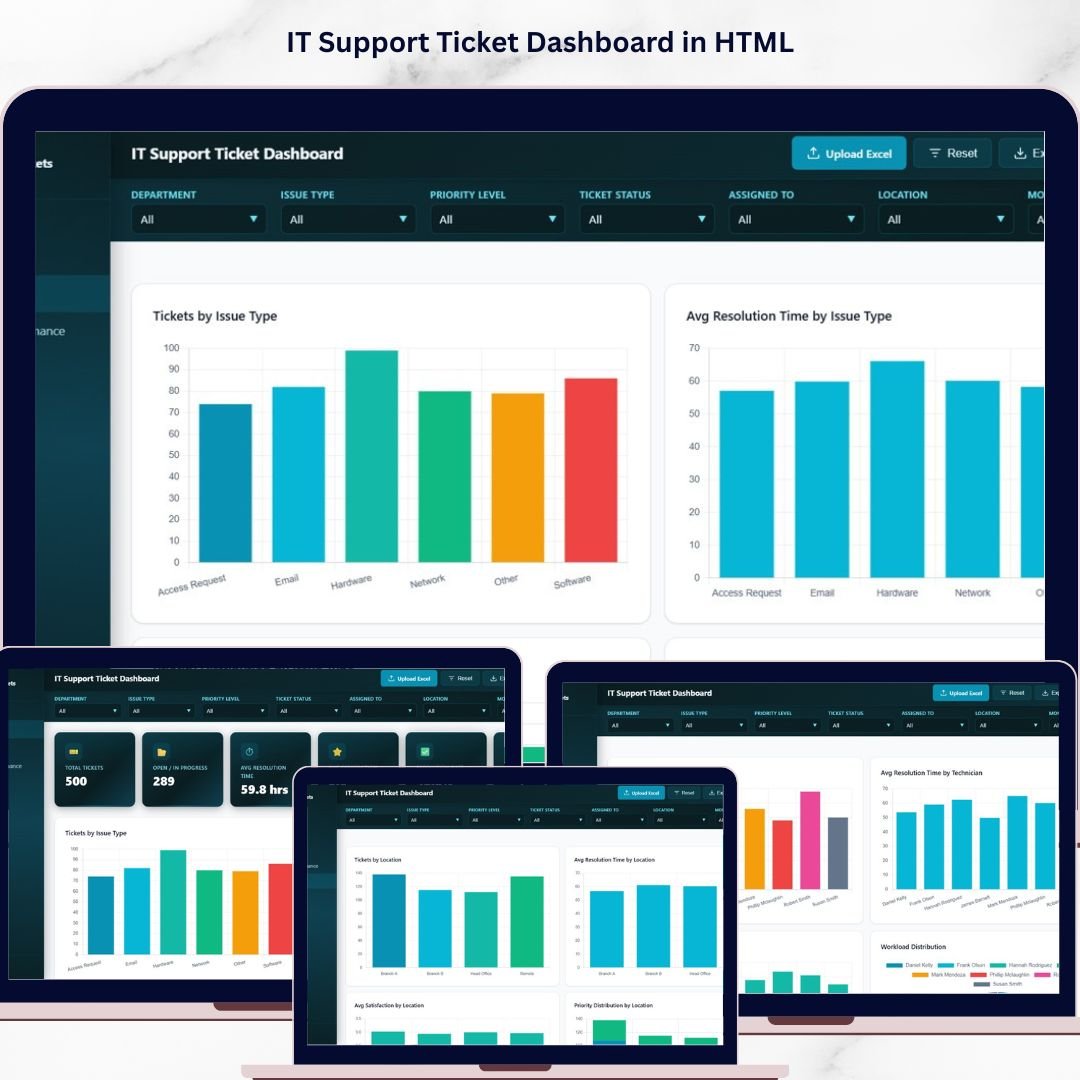

IT Support Ticket Dashboard in HTML is a professional, browser-based analytics template built for IT managers, help desk supervisors, service desk analysts, and technology leaders who want to monitor support ticket volume, resolution times, technician performance, and customer satisfaction from a single interactive interface. This dashboard transforms raw IT support data into actionable visual insights without requiring any software installation 🚀. Simply open the HTML file in Chrome, Firefox, or Edge and start exploring your IT support metrics instantly.
This template includes 5 interactive dashboard pages covering Overview, Issue Analysis, Technician Performance, Location Analysis, and a detailed Data View — making it one of the most comprehensive IT analytics solutions available. Whether you are tracking hardware failures, software bugs, network issues, or access requests, this dashboard gives you complete visibility into your IT support operations with dynamic charts, KPI cards, and smart filtering options.
🔑 Key Features of IT Support Ticket Dashboard in HTML
📊 5 Interactive Dashboard Pages – Navigate between Overview, Issue Analysis, Technician Performance, Location Analysis, and Data View tabs to explore IT support data from every angle.
📈 6 Dynamic KPI Cards – Track high-level metrics at a glance including Total Tickets, Open / In Progress tickets, Average Resolution Time, Average Satisfaction Score, Resolution Rate, and Escalated tickets.
🔍 Advanced Slicers and Filters – Filter the entire dashboard instantly by issue type, priority level, status, department, technician, and location for targeted IT support analysis.
👨💻 Technician Performance Tracking – Analyze tickets resolved by technician, average resolution time per technician, satisfaction scores, and workload distribution to identify top performers.
📍 Location-Based Analysis – Compare ticket volume, resolution times, satisfaction scores, and priority distribution across different office locations or sites.
🔧 Issue Type Deep Dive – Understand ticket patterns by issue type with resolution time analysis, priority distribution, and satisfaction breakdowns for each issue category.
📋 Data View with Export – Browse all ticket records with search, sort, pagination, and CSV export functionality for deep-dive analysis and reporting.
📦 What’s Inside the IT Support Ticket Dashboard in HTML
The IT Support Ticket Dashboard in HTML contains 5 purpose-built pages designed for complete IT service management visibility:
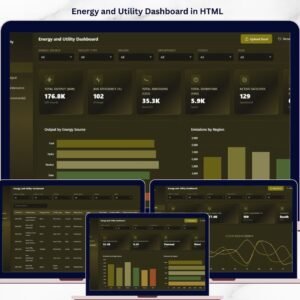
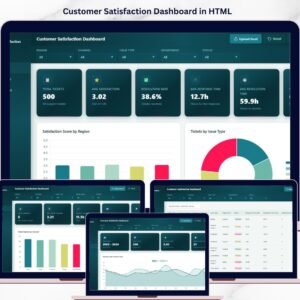
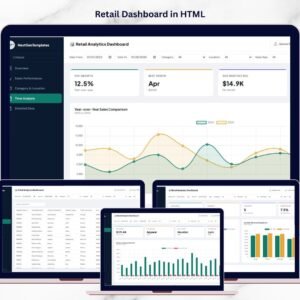
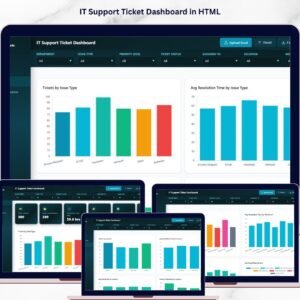
🔹 Overview Page – The central command center featuring 6 KPI cards (Total Tickets, Open / In Progress, Avg Resolution Time, Avg Satisfaction, Resolution Rate, Escalated) plus interactive charts showing Tickets by Issue Type, Tickets by Priority Level, Tickets by Status, Tickets by Department, and Monthly Ticket Trend with slicers for instant filtering.
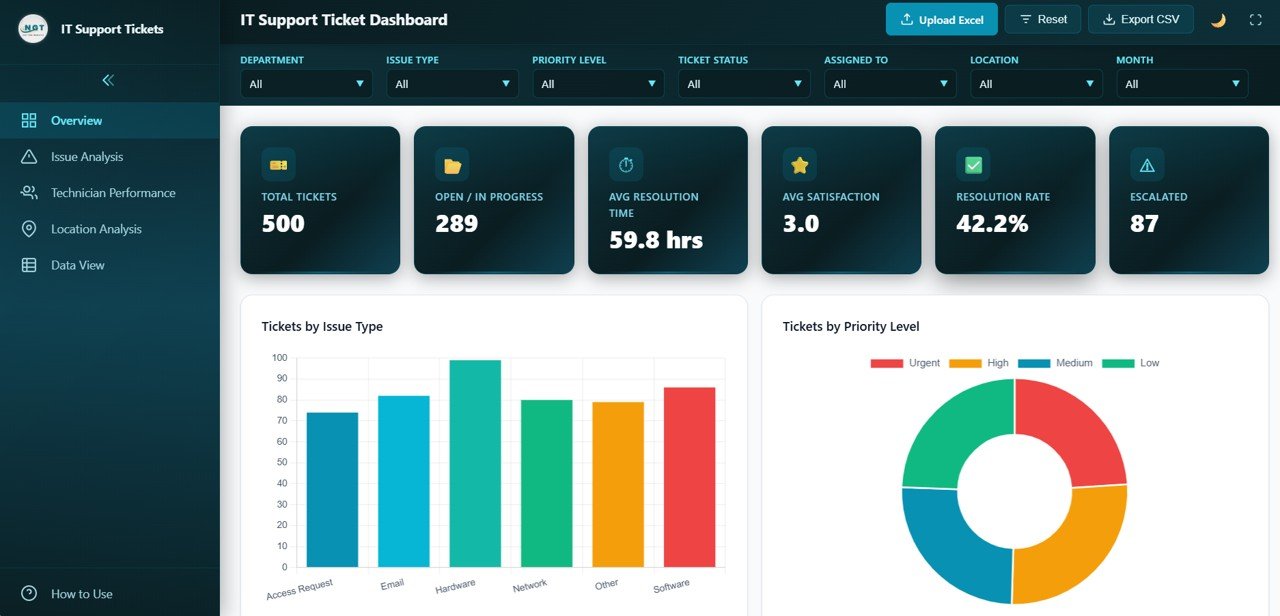 IT Support Ticket Dashboard Overview
🔹 Issue Analysis Page – Deep dive into ticket patterns with Tickets by Issue Type, Avg Resolution Time by Issue Type, Priority Distribution by Issue Type, and Avg Satisfaction by Issue Type helping identify the most problematic categories and areas needing improvement.
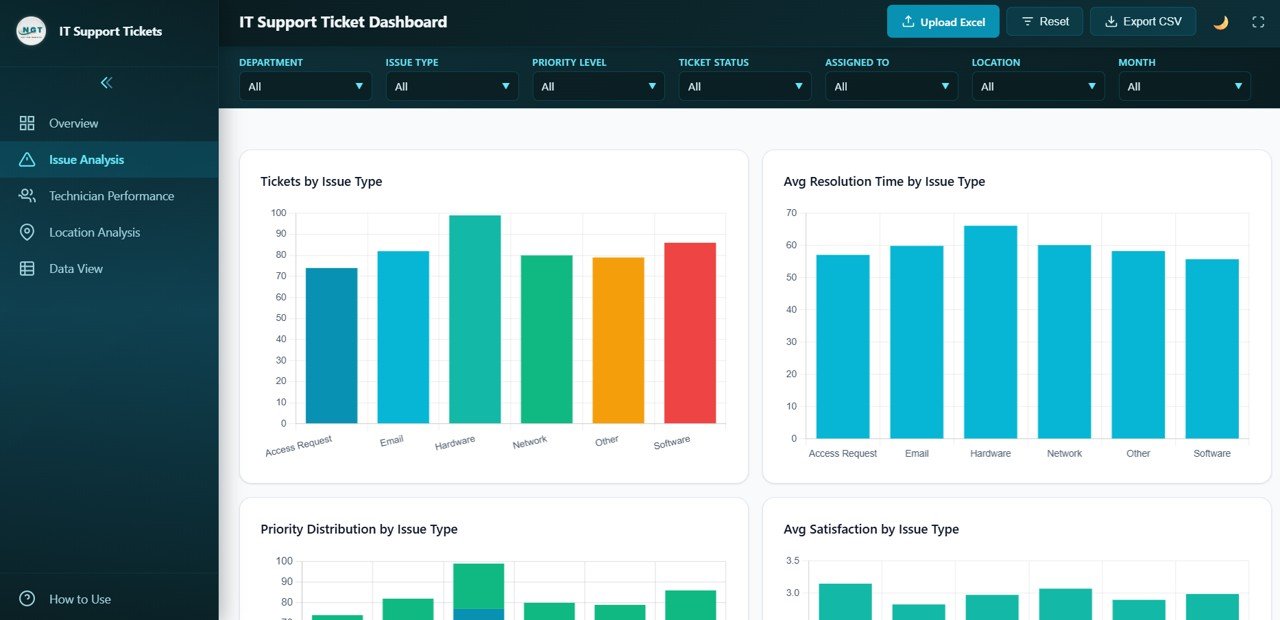 Issue Analysis
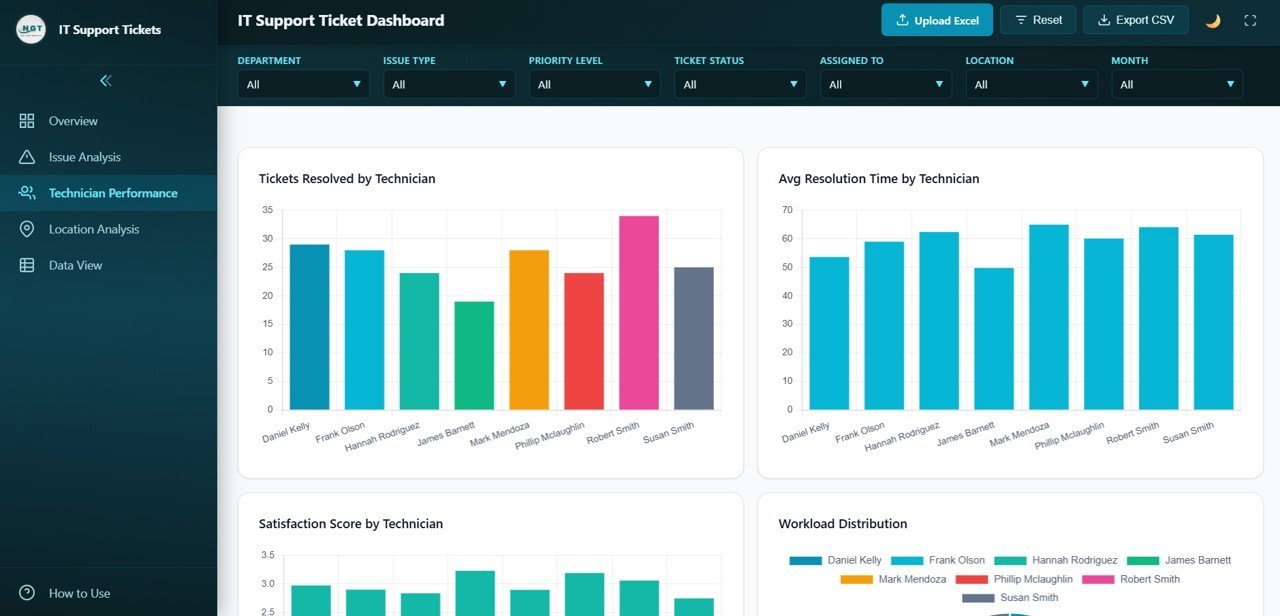
🔹 Technician Performance Page – Evaluate your IT team with Tickets Resolved by Technician, Avg Resolution Time by Technician, Satisfaction Score by Technician, and Workload Distribution charts for performance reviews and resource planning.
 Technician Performance
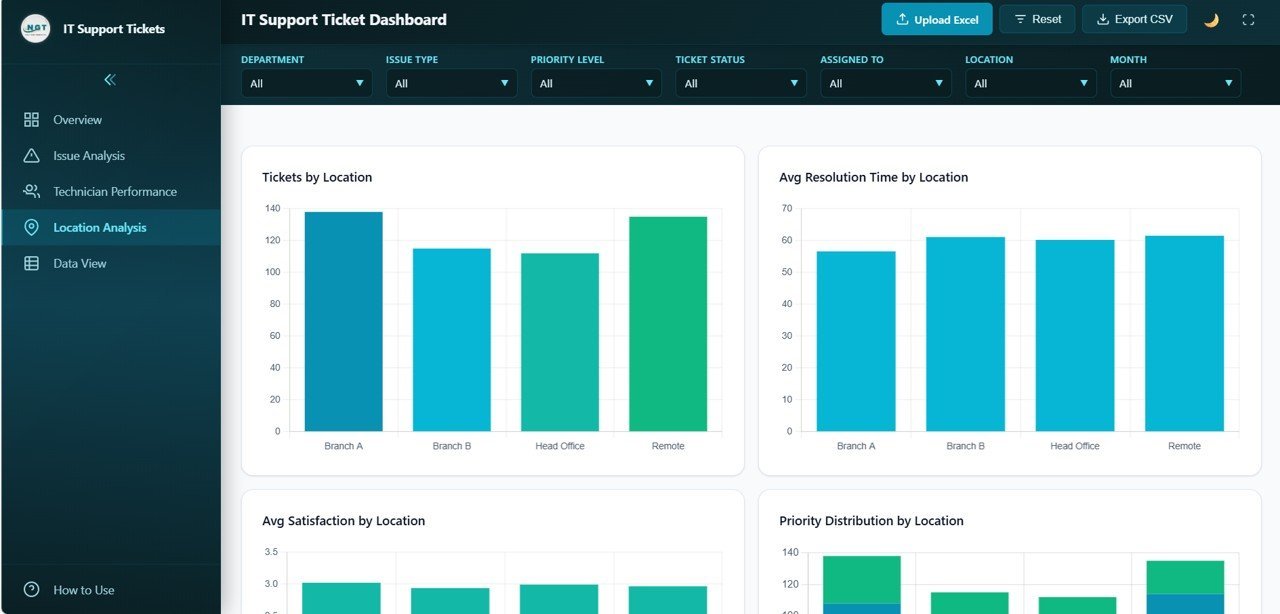
🔹 Location Analysis Page – Compare IT support metrics across sites with Tickets by Location, Avg Resolution Time by Location, Avg Satisfaction by Location, and Priority Distribution by Location.
 Location Analysis
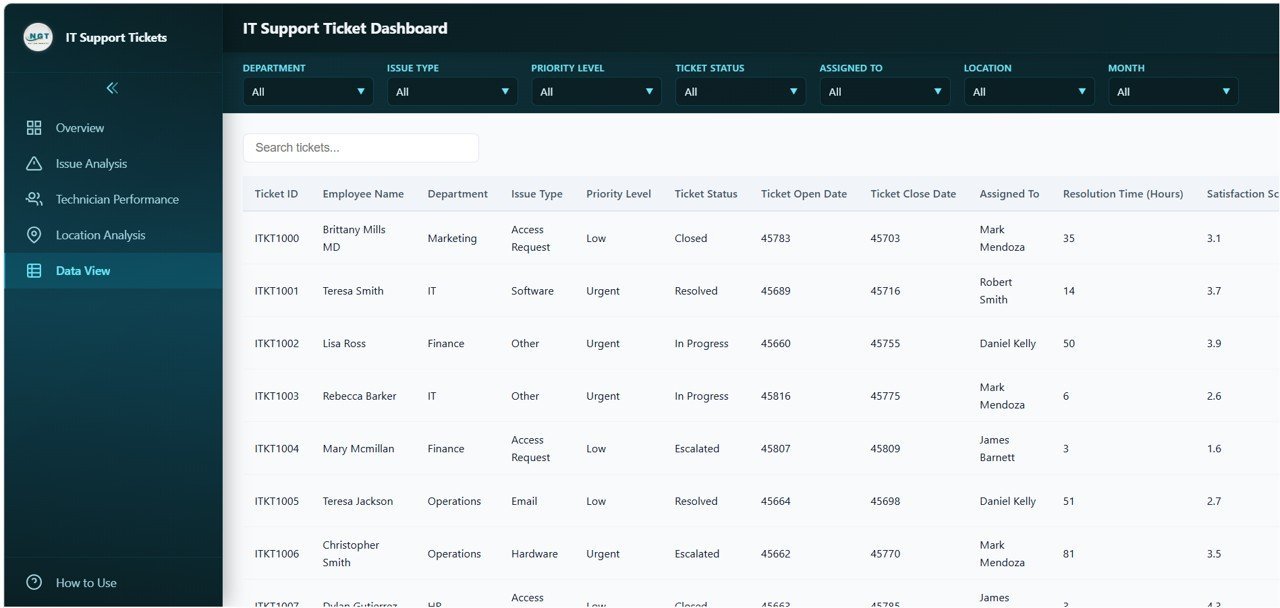
🔹 Data View – A detailed data table page with search, sort, and pagination features plus CSV export capability for all ticket records.
 Data View
⚙️ How to Use the IT Support Ticket Dashboard in HTML
1️⃣ Download and unzip the file to your computer.
2️⃣ Open the index.html file in any modern browser (Chrome, Firefox, Edge).
3️⃣ Explore the sample data across all 5 dashboard pages to understand the layout.
4️⃣ Replace the sample data in the data file with your actual IT support ticket records.
5️⃣ All charts, KPI cards, and filters will update automatically with your data.
6️⃣ Use slicers and filters to drill down into specific issue types, technicians, locations, or time periods.
7️⃣ Export filtered data to CSV from the Data View page for further reporting.
👥 Who Can Benefit from This IT Support Ticket Dashboard
🔹 IT Managers and Directors – Monitor help desk performance, resolution rates, and escalation trends across the organization.
🔹 Help Desk Supervisors – Track technician productivity, workload distribution, and satisfaction scores for team management.
🔹 Service Desk Analysts – Analyze ticket patterns by issue type, priority, and location to identify systemic problems.
🔹 CIOs and Technology Leaders – Access executive-level KPIs including resolution rates, escalation counts, and customer satisfaction trends.
🔹 IT Consultants – Deliver professional IT performance reports to clients using a ready-made dashboard solution.
❓ Frequently Asked Questions
What KPIs does the IT Support Ticket Dashboard track?
The IT Support Ticket Dashboard in HTML tracks 6 key performance indicators: Total Tickets, Open / In Progress tickets, Average Resolution Time, Average Satisfaction Score, Resolution Rate, and Escalated tickets. These KPIs are displayed on dynamic cards with supporting visualizations across 5 interactive pages.
Do I need coding skills to use this HTML dashboard?
No. Simply download the ZIP file, extract it, and open index.html in any modern browser. Replace the sample data with your actual IT ticket data and all charts and KPIs update automatically. No coding or programming knowledge is required.
Can I track technician performance with this dashboard?
Yes. The dedicated Technician Performance page shows tickets resolved, average resolution time, satisfaction scores, and workload distribution for each IT technician, enabling comprehensive team performance analysis and resource planning.
Does this dashboard work on mobile devices?
Yes. The IT Support Ticket Dashboard in HTML features a responsive layout optimized for desktops, tablets, and mobile devices so you can monitor IT support metrics from anywhere.
Can I export data from this dashboard?
Yes. The Data View page includes search, sort, pagination, and CSV export functionality, allowing you to extract filtered IT support ticket records for further analysis and executive reporting.
What types of IT issues can this dashboard track?
This dashboard can track any type of IT support issue including hardware failures, software bugs, network problems, access requests, password resets, system outages, and more. The Issue Analysis page provides detailed breakdowns by issue category.
🔗 Explore Related Templates
If you are looking for more IT and service management analytics solutions, explore these related templates from NextGenTemplates:
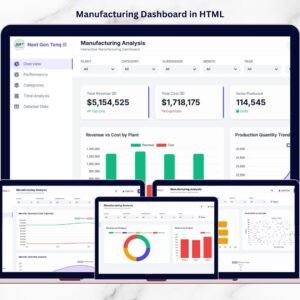
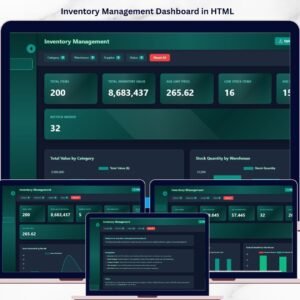
🔹 IT Services Dashboard in HTML – Track IT service delivery, SLA compliance, and operational metrics with interactive analytics.
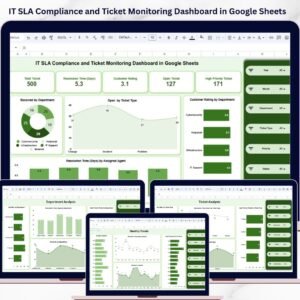
🔹 IT SLA Compliance and Ticket Monitoring Dashboard in Google Sheets – Monitor SLA performance, ticket volumes, and compliance rates in Google Sheets.
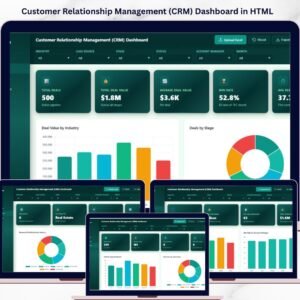
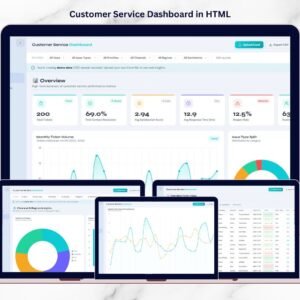
🔹 Customer Service Dashboard in HTML – Track customer service tickets, agent performance, and satisfaction scores.
📖 Click here to read the Detailed Blog Post
Watch the step-by-step video tutorial:


Reviews
There are no reviews yet.