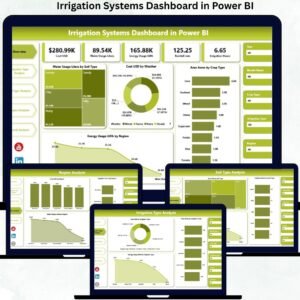
Water is one of the most valuable resources in agriculture, and Irrigation Systems Dashboard directly impacts crop yield, sustainability, operating cost, and profitability. Farmers, agribusiness companies, irrigation managers, and policy-makers continuously track water usage, energy consumption, irrigation hours, soil behavior, crop coverage, and regional performance. However, when irrigation data is scattered across spreadsheets, sensor logs, and manual records, decision-making becomes slow and unreliable. This is exactly why an Irrigation Systems Dashboard in Power BI becomes a powerful and essential solution.
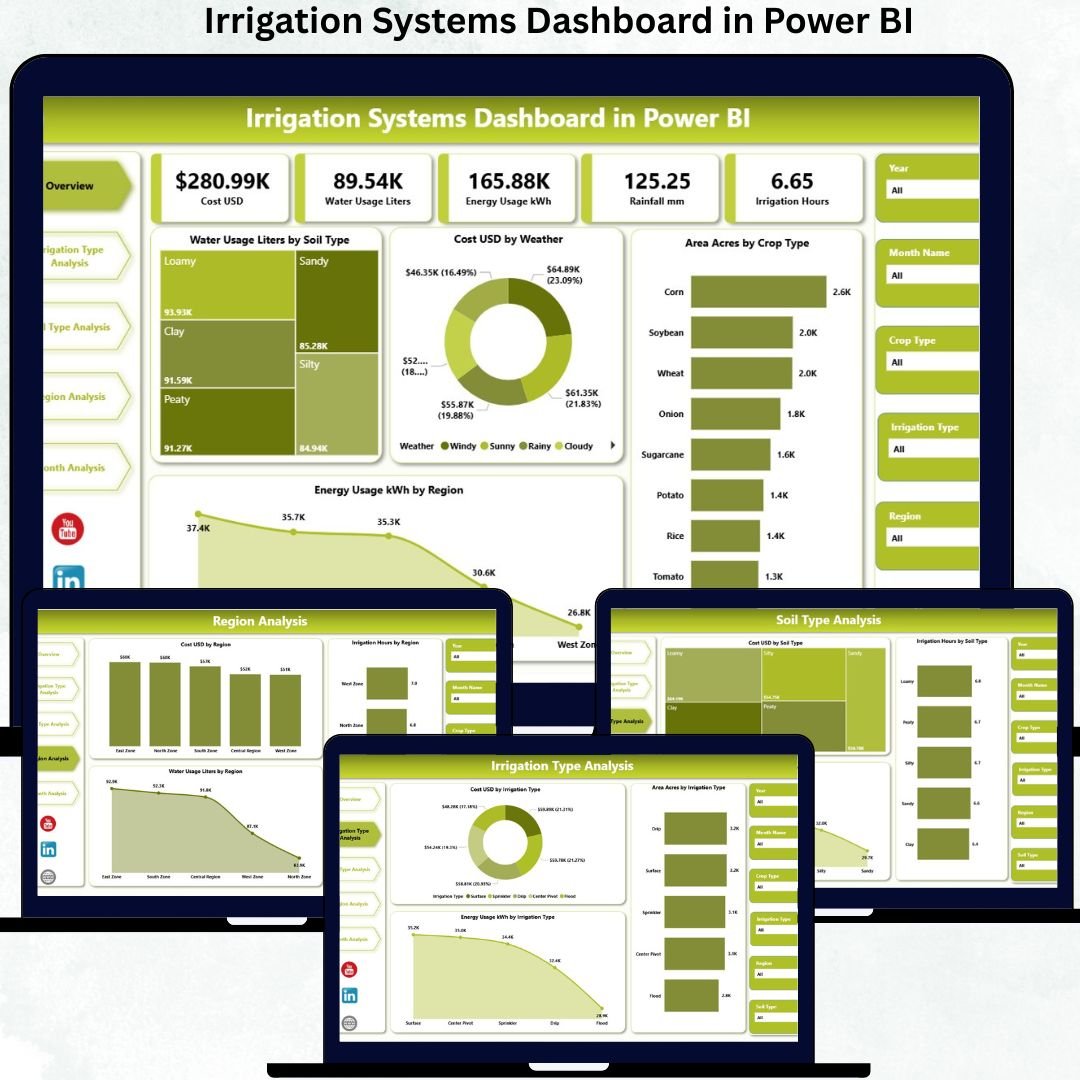
The Irrigation Systems Dashboard in Power BI is a ready-to-use, interactive analytics solution that converts complex irrigation data into clear KPIs, visual insights, and actionable trends. Built on Power BI, this dashboard allows users to monitor water usage, irrigation cost, energy consumption, soil efficiency, and crop coverage in real time. Instead of spending hours analyzing raw data, users can instantly identify inefficiencies, reduce waste, and optimize irrigation strategies.
Designed for both technical and non-technical users, this dashboard brings clarity, speed, and confidence into irrigation decision-making. Whether you manage a small farm or a large agricultural operation across regions, this dashboard helps you move from reactive irrigation management to intelligent, data-driven planning.
✨ Key Features of the Irrigation Systems Dashboard in Power BI
This professionally designed dashboard includes five powerful analytical pages, each focused on a critical irrigation question.
⭐ Overview Page – Complete Irrigation Performance Snapshot
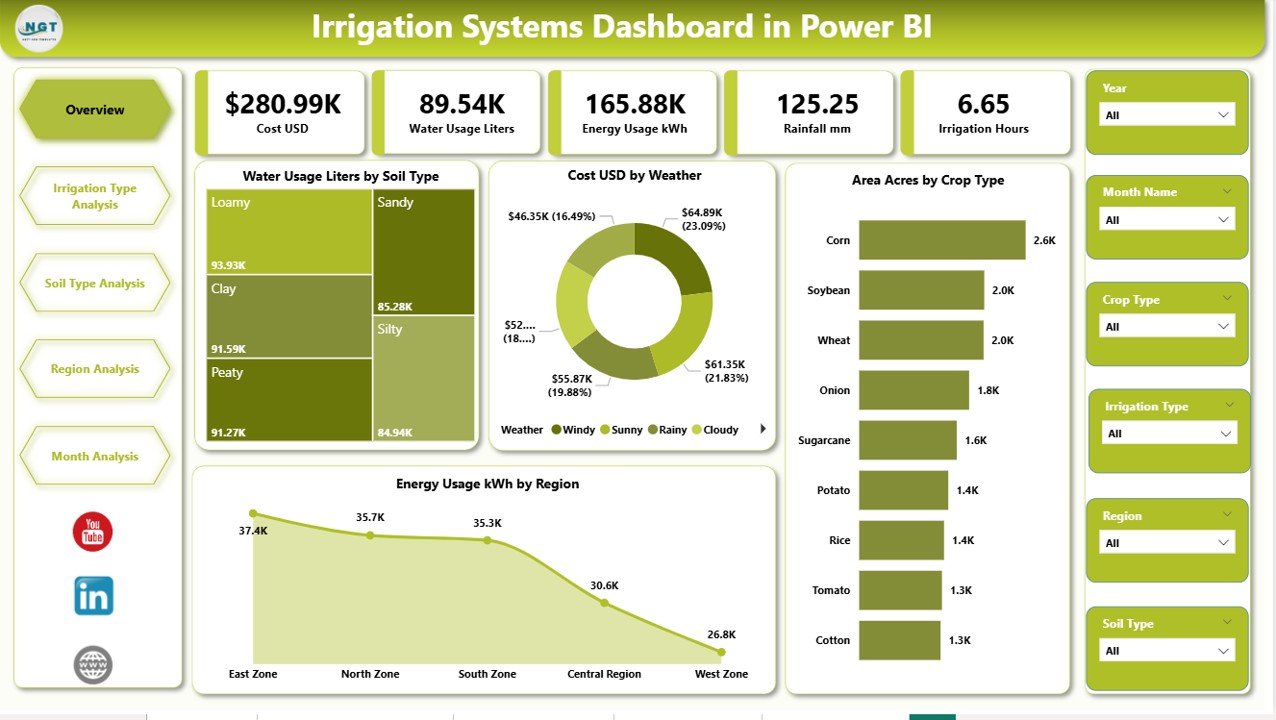
✔ Interactive slicers for Region, Crop Type, Soil Type, and Weather Condition
✔ Four KPI cards displaying:
-
Total Water Usage (Liters)
-
Total Irrigation Cost (USD)
-
Total Area Covered (Acres)
-
Total Energy Usage (kWh)
✔ Four insightful charts:
-
Water Usage by Soil Type
-
Cost USD by Weather Condition
-
Area Covered by Crop Type
-
Energy Usage by Region
This page provides instant visibility into high water-consuming areas and cost drivers.
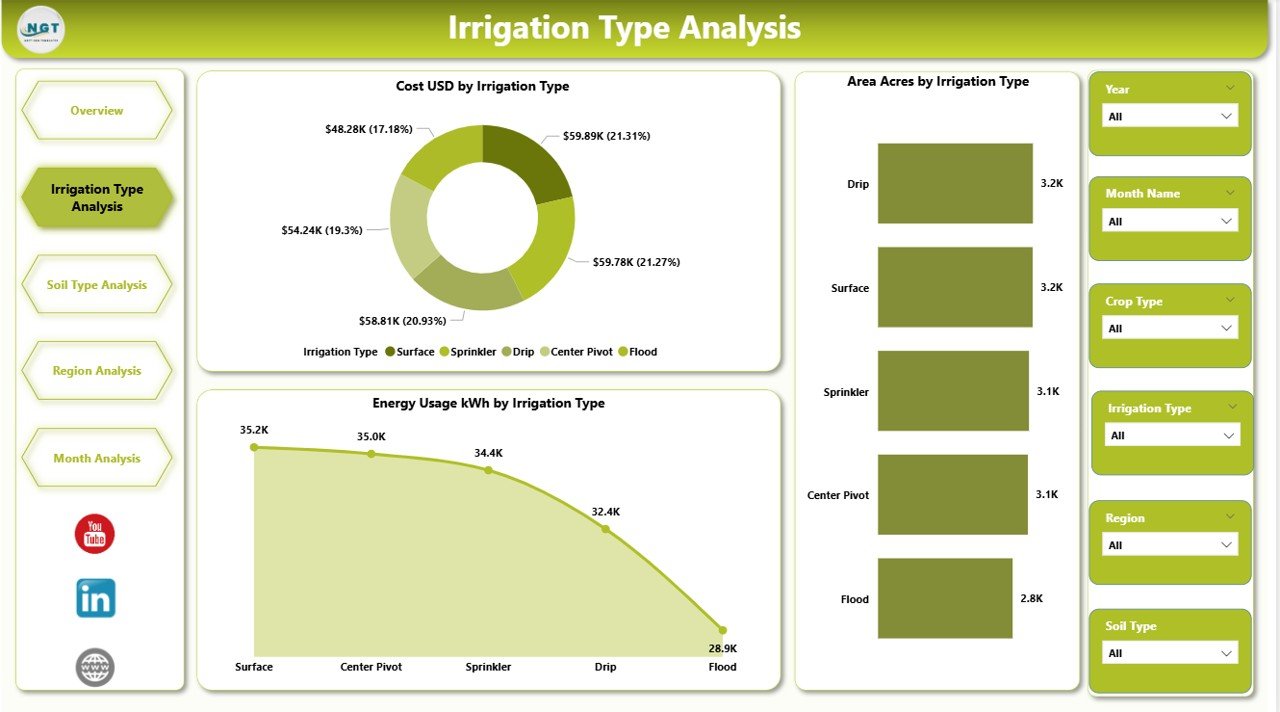
⭐ Irrigation Type Analysis Page – Compare Irrigation Technologies
✔ Cost USD by Irrigation Type
✔ Area Covered by Irrigation Type
✔ Energy Usage kWh by Irrigation Type
This analysis helps identify cost-effective and energy-efficient irrigation methods such as drip, sprinkler, surface, or pivot systems.
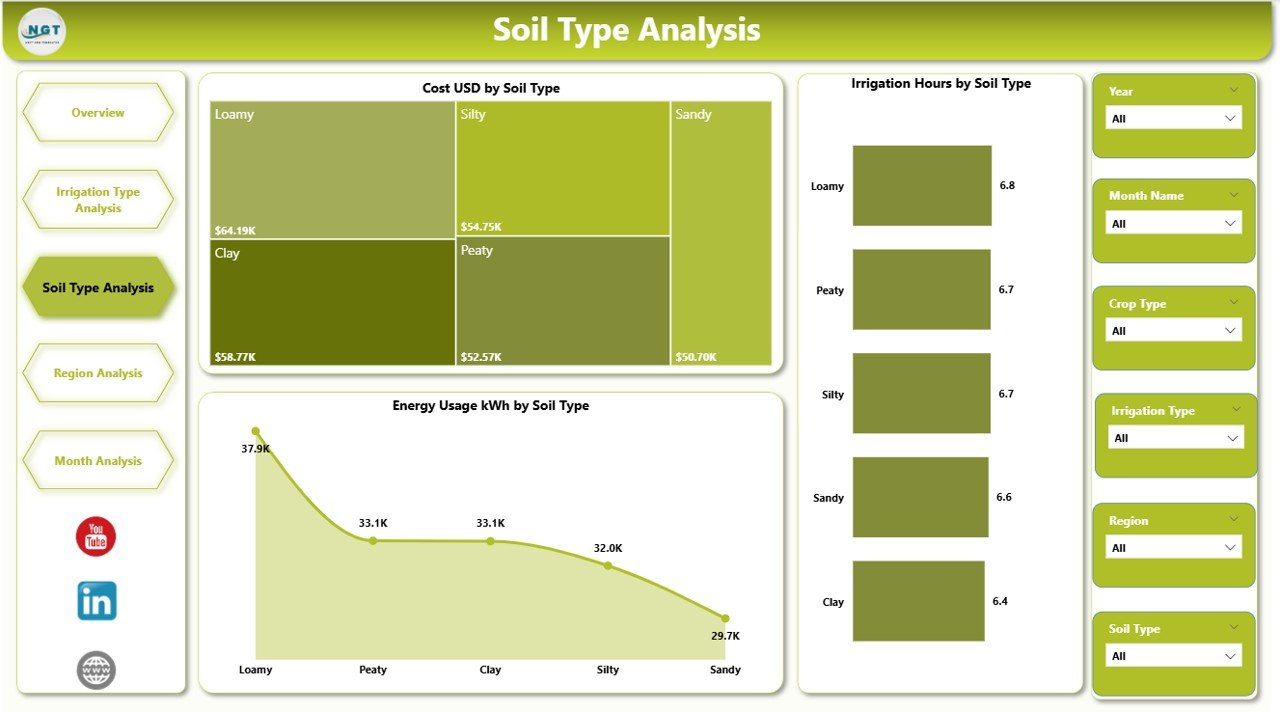
⭐ Soil Type Analysis Page – Understand Soil-Based Irrigation Needs
✔ Cost USD by Soil Type
✔ Irrigation Hours by Soil Type
✔ Energy Usage kWh by Soil Type
This page helps users adjust irrigation duration and volume based on soil behavior, preventing over- or under-irrigation.
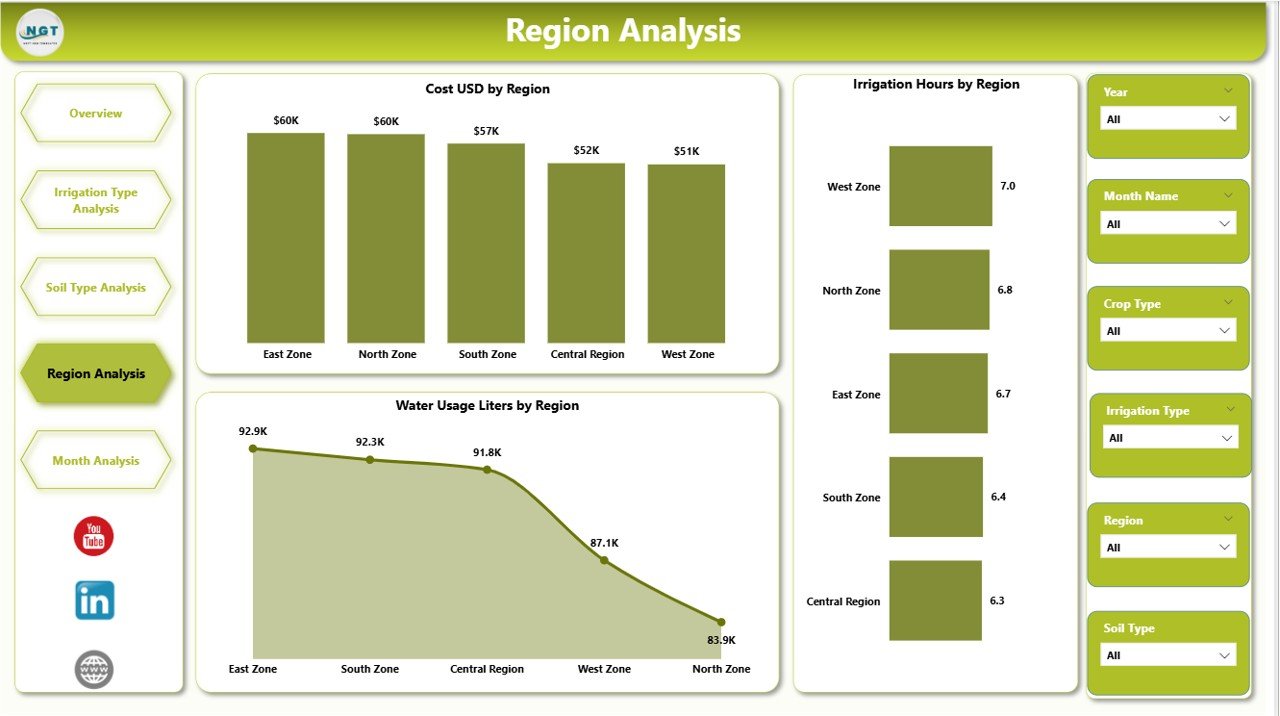
⭐ Region Analysis Page – Regional Water & Energy Insights
✔ Cost USD by Region
✔ Irrigation Hours by Region
✔ Water Usage Liters by Region
With this analysis, organizations can optimize region-specific irrigation strategies and resource allocation.
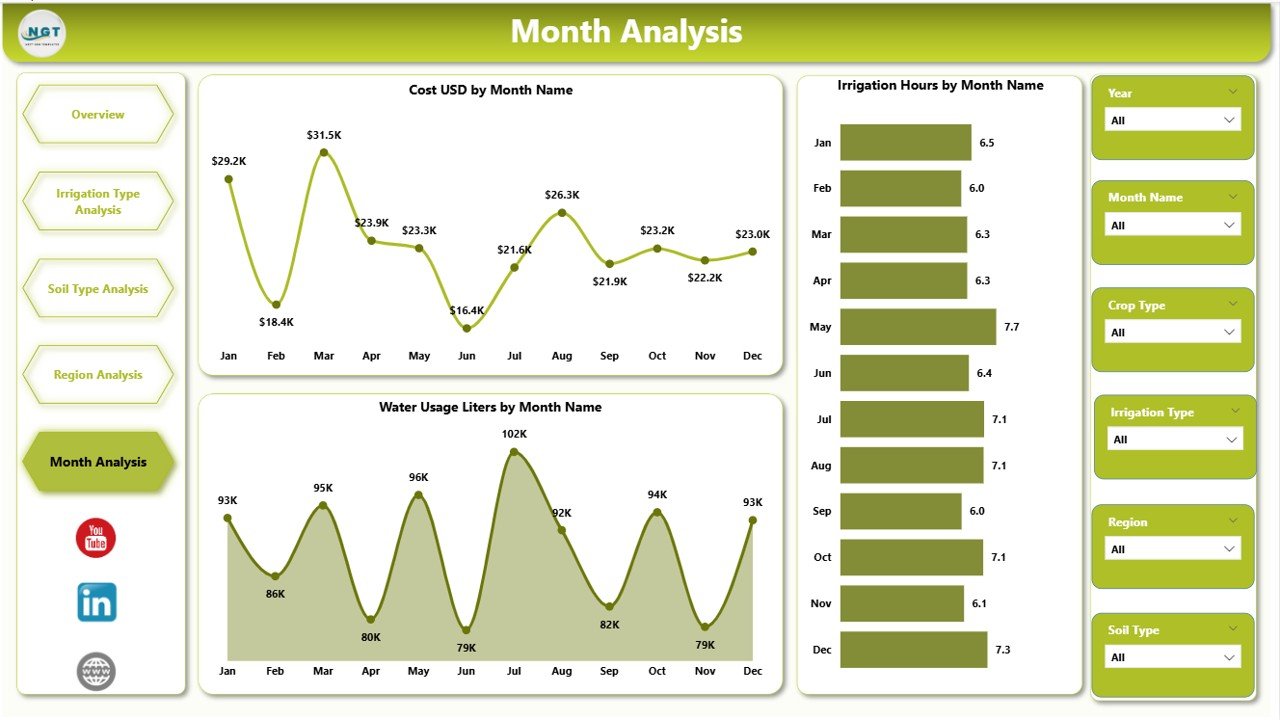
⭐ Monthly Trends Page – Seasonal and Time-Based Analysis
✔ Cost USD by Month
✔ Irrigation Hours by Month
✔ Water Usage Liters by Month
This page highlights seasonal patterns, peak irrigation periods, and long-term trends for improved forecasting.
📦 What’s Inside the Irrigation Systems Dashboard in Power BI
When you download this product, you receive:
✨ A ready-to-use Power BI dashboard (.pbix)
✨ Five fully interactive analytics pages
✨ KPI cards for instant performance tracking
✨ Dynamic slicers for deep analysis
✨ Clear visuals for water, cost, and energy management
✨ Scalable design suitable for farms of any size
Everything is designed for accuracy, clarity, and ease of use.
🛠️ How to Use the Irrigation Systems Dashboard in Power BI
1️⃣ Connect irrigation data from Excel, sensors, or systems
2️⃣ Refresh the Power BI dashboard
3️⃣ Navigate across dashboard pages
4️⃣ Use slicers to filter by region, soil, crop, or month
5️⃣ Review KPIs and charts
6️⃣ Identify high-cost or high-water-usage areas
7️⃣ Take corrective actions and optimize irrigation plans
No advanced Power BI skills are required—basic usage is enough.
👥 Who Can Benefit from This Irrigation Systems Dashboard in Power BI
This dashboard is ideal for:
✔ Farmers and farm owners
✔ Irrigation managers
✔ Agribusiness companies
✔ Water resource planners
✔ Sustainability consultants
✔ Government agriculture departments
✔ Research and policy organizations
Both small-scale and enterprise-level users gain immediate value.
### 📘 Click here to read the Detailed blog post
🎥 Visit our YouTube channel to learn step-by-step video tutorials
👉 Youtube.com/@PKAnExcelExpert

Reviews
There are no reviews yet.