Managing international trade operations is no longer simple. Businesses must track exports, imports, logistics timelines, compliance performance, operational efficiency, and profitability simultaneously. When information is scattered across multiple spreadsheets, decision-making becomes slow and performance risks increase.
The International Trade KPI Scorecard in Excel is a powerful, ready-to-use performance monitoring solution designed to help organizations track global trade operations through structured Key Performance Indicators (KPIs). Instead of spending hours preparing reports, this smart Excel-based scorecard converts raw trade data into clear visual insights — enabling faster, smarter, and more confident business decisions.
Whether you manage shipments, oversee compliance, or analyze trade profitability, this scorecard centralizes everything into one interactive dashboard.
🚀 Key Feature of International Trade KPI Scorecard in Excel
✅ Interactive KPI Dashboard – Monitor export, import, logistics, and operational KPIs from one centralized scorecard.
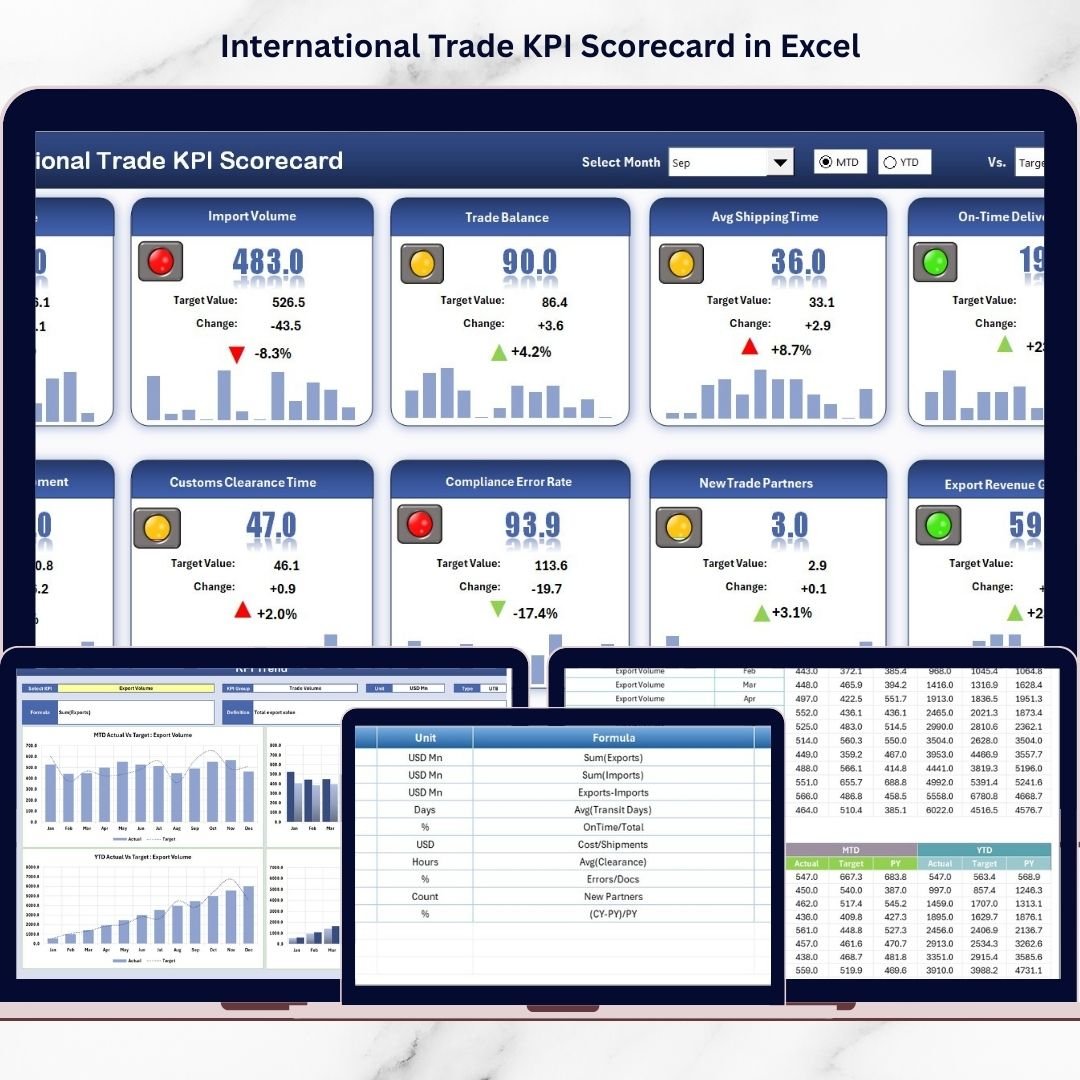
📊 MTD & YTD Analysis – Instantly switch between Month-to-Date and Year-to-Date performance views using dropdown selections.
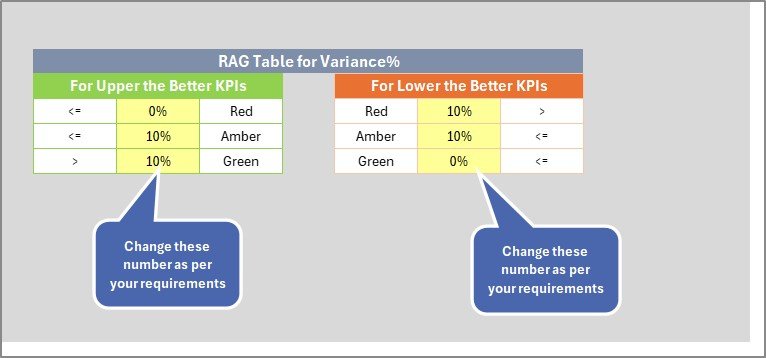
🎯 Actual vs Target Tracking – Quickly identify performance gaps with automated comparisons.
🟢 Color-Coded Performance Indicators – Green, Yellow, and red indicators instantly highlight KPI status.
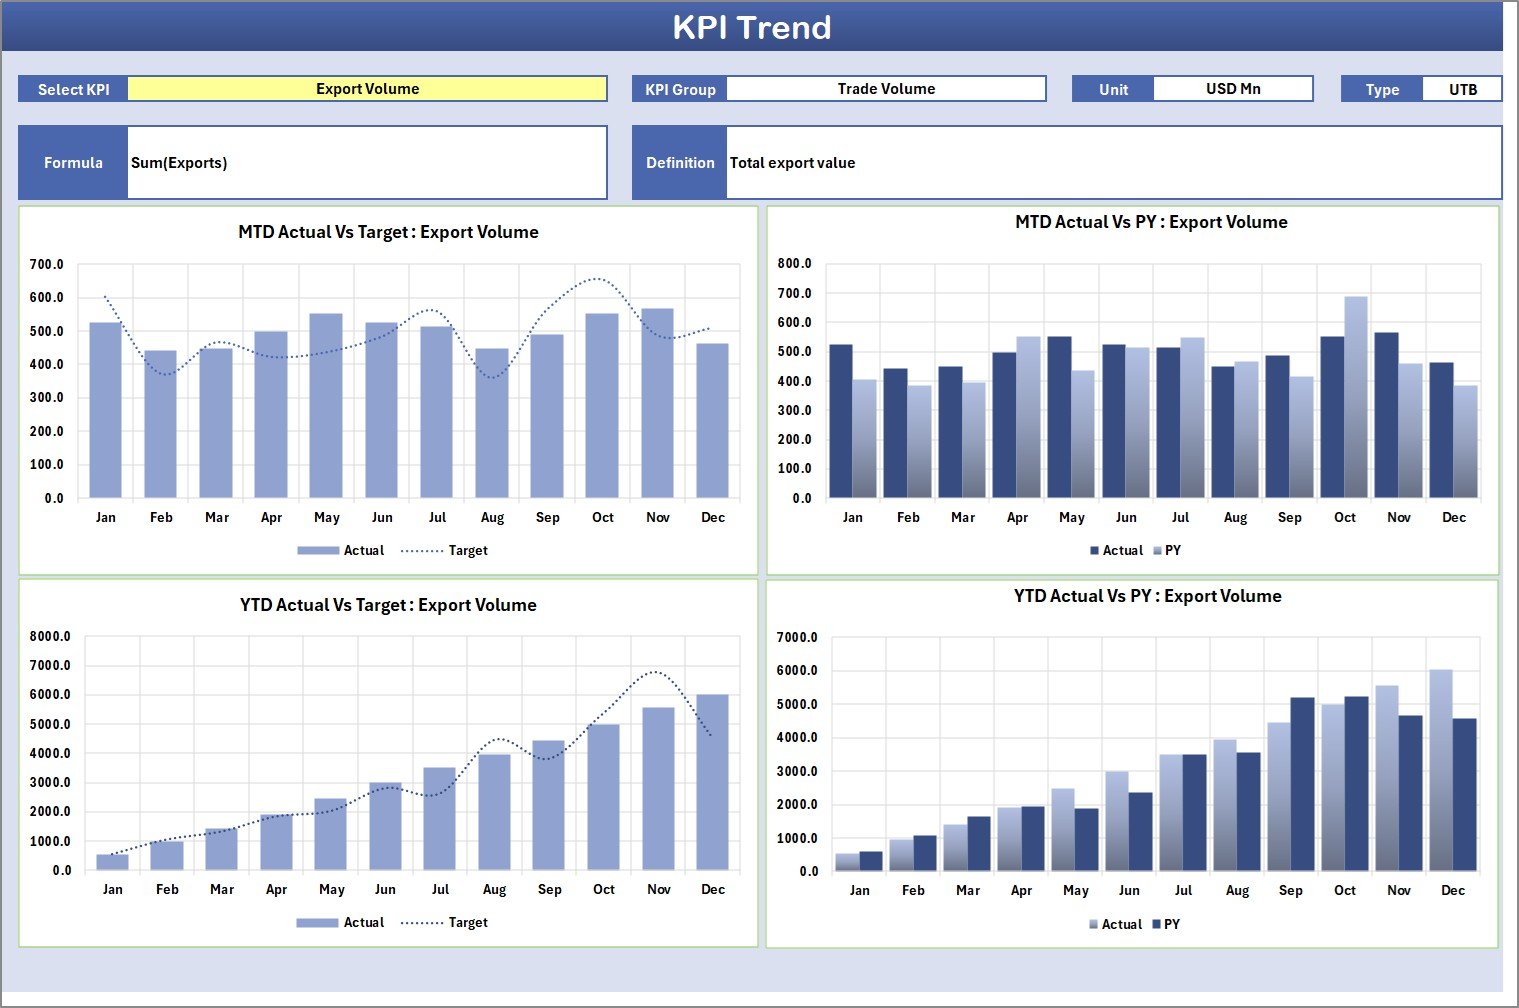
📈 Automated Trend Analysis – Visual charts display Actual, Target, and Previous Year comparisons.
🔄 Auto-Updating Reports – Update input data once and the entire dashboard refreshes automatically.
📂 Structured KPI Management – Standardized KPI definitions ensure clarity across teams.
💼 Fully Customizable Template – Modify KPIs according to your industry or operational needs.
📦 What’s Inside the International Trade KPI Scorecard in Excel
This professionally designed Excel template includes four structured worksheets:
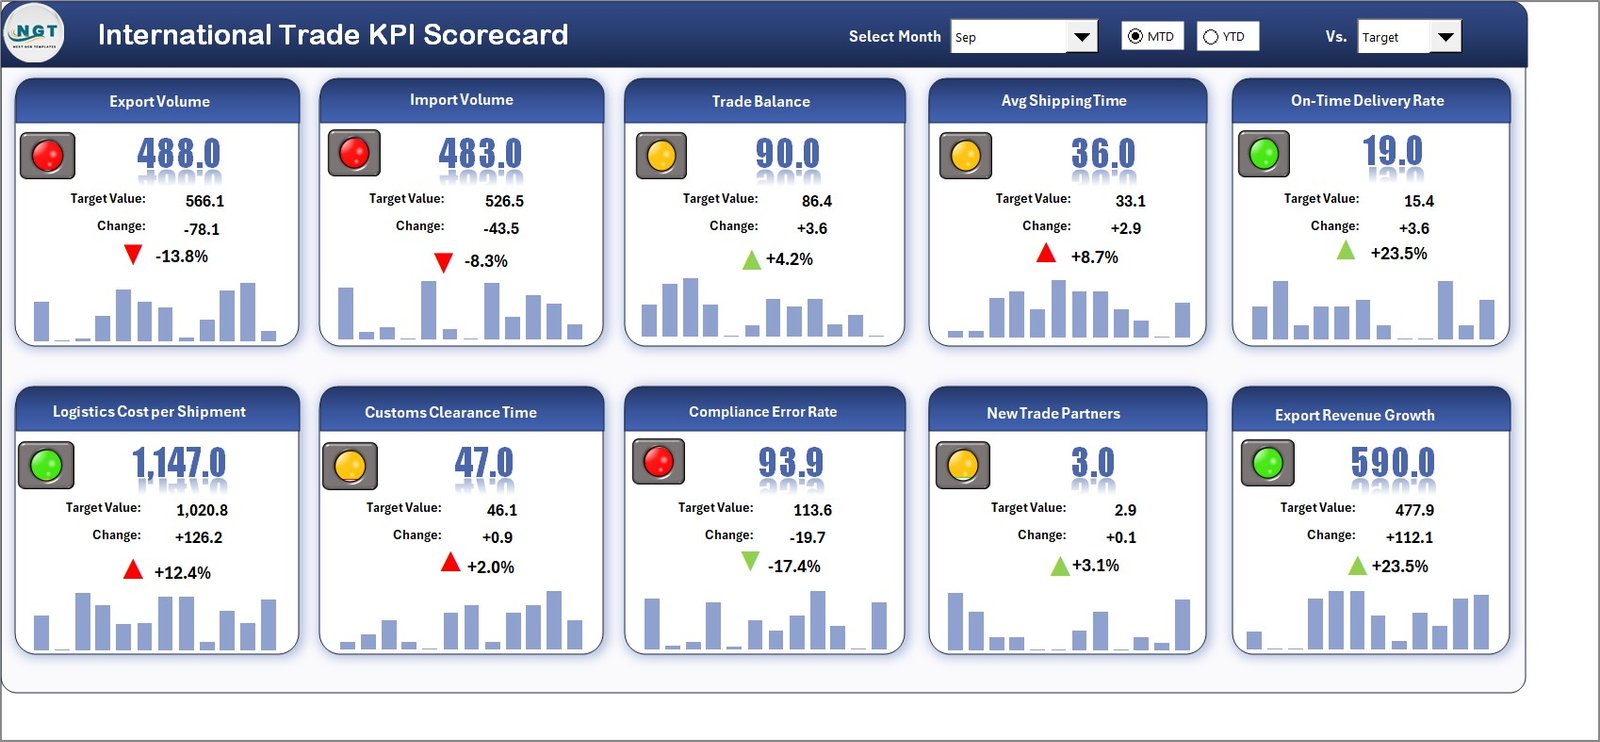
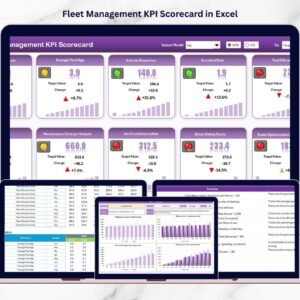
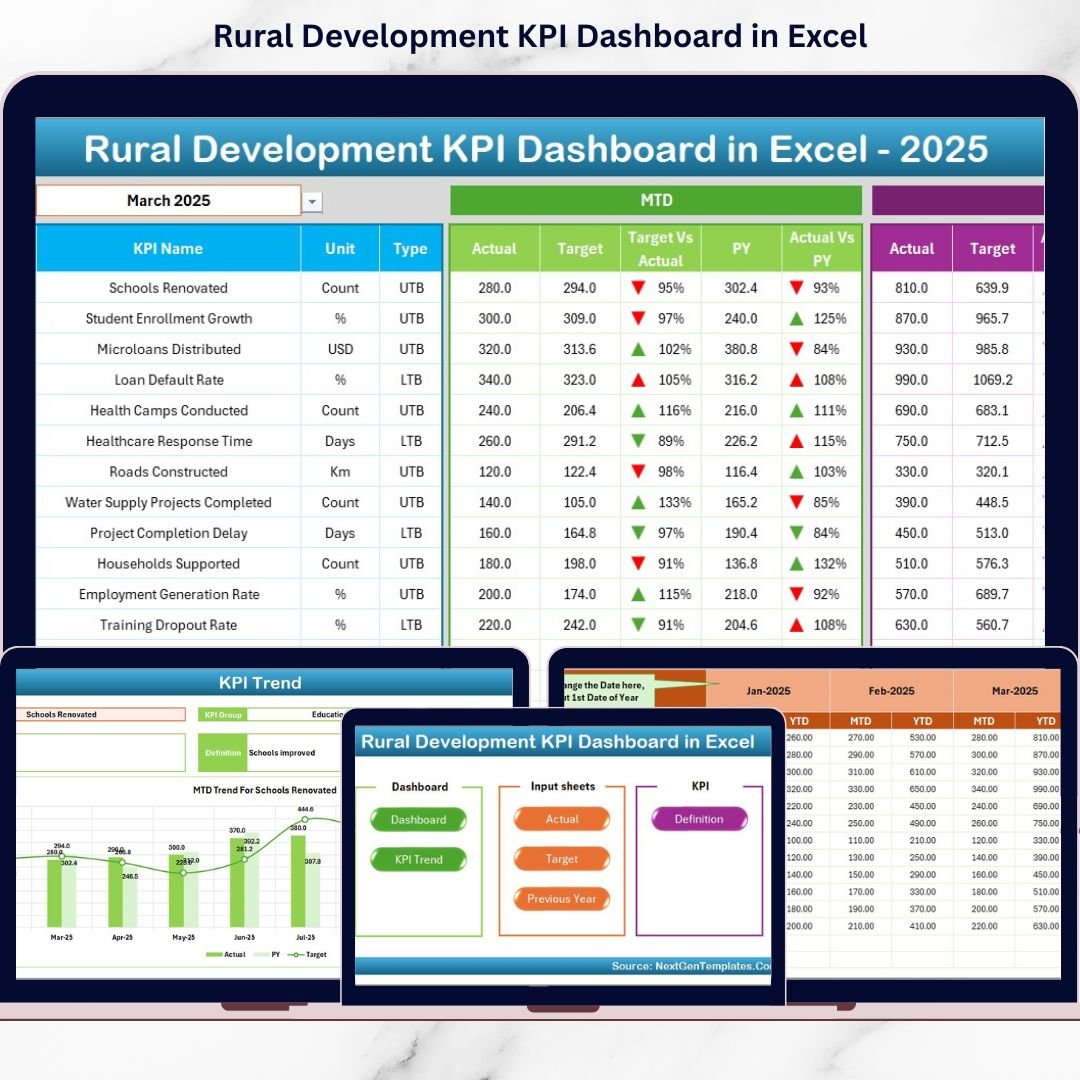
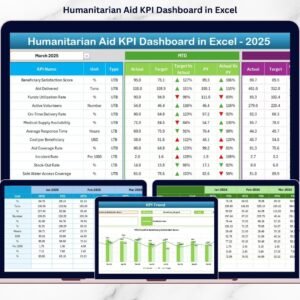
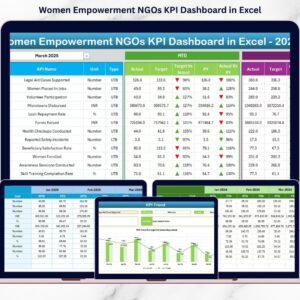
📊 Scorecard Sheet (Main Dashboard)
The central performance monitoring page displaying KPI groups, units, MTD/YTD results, and performance indicators for quick executive review.
📈 KPI Trend Sheet
Analyze performance patterns over time with dynamic charts showing Actual vs Target vs Previous Year data.
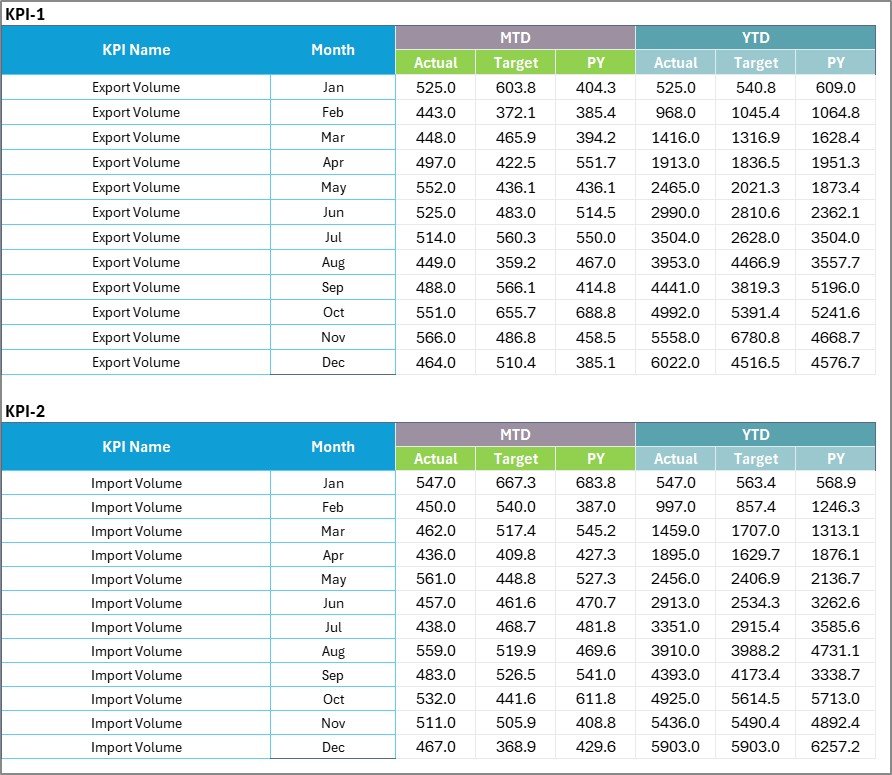
📝 Input Data Sheet
The data entry hub where users record KPI values, targets, and monthly performance metrics.
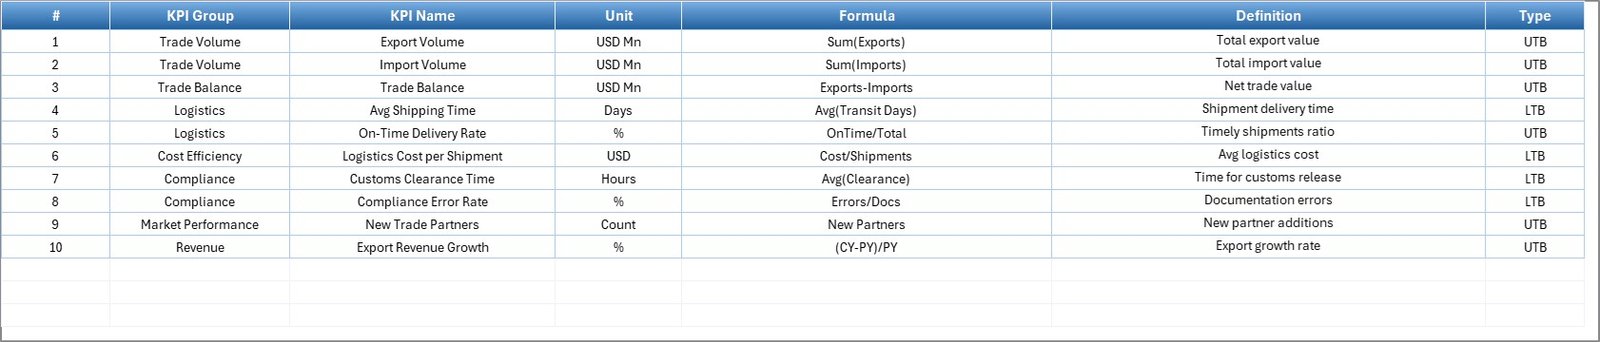
📘 KPI Definition Sheet
A standardized reference area capturing KPI formulas, definitions, units, and KPI types (LTB or UTB).
Together, these sheets create a complete trade analytics system inside Excel.
⚙️ How to Use the International Trade KPI Scorecard in Excel
Using the scorecard requires no advanced technical skills.
1️⃣ Define KPIs aligned with trade objectives.
2️⃣ Enter KPI details in the KPI Definition sheet.
3️⃣ Update monthly Actual and Target data in the Input sheet.
4️⃣ Select Month, MTD, or YTD from dropdown filters.
5️⃣ Review dashboard visuals and trend charts for insights.
Within minutes, decision-makers gain a clear overview of international trade performance.
👥 Who Can Benefit from This International Trade KPI Scorecard in Excel
This scorecard is ideal for organizations involved in global trade operations, including:
🌍 Export & Import Companies
🚚 Logistics and Supply Chain Teams
📦 Freight & Shipping Managers
⚖️ Trade Compliance Officers
📊 Operations Managers
💰 Financial & Business Analysts
🌐 International Business Consultants
Any organization seeking structured performance monitoring can benefit from this ready-to-use solution.
The scorecard not only simplifies reporting but also improves operational visibility, reduces delays, strengthens compliance monitoring, and enhances profitability tracking. Because it is built entirely in Excel, businesses can deploy it immediately without investing in expensive business intelligence tools.
By transforming complex trade data into actionable insights, the International Trade KPI Scorecard in Excel empowers organizations to manage global operations with clarity, accuracy, and confidence.
## Click here to read the Detailed blog post
Visit our YouTube channel to learn step-by-step video tutorials:
👉 https://youtube.com/@PKAnExcelExpert