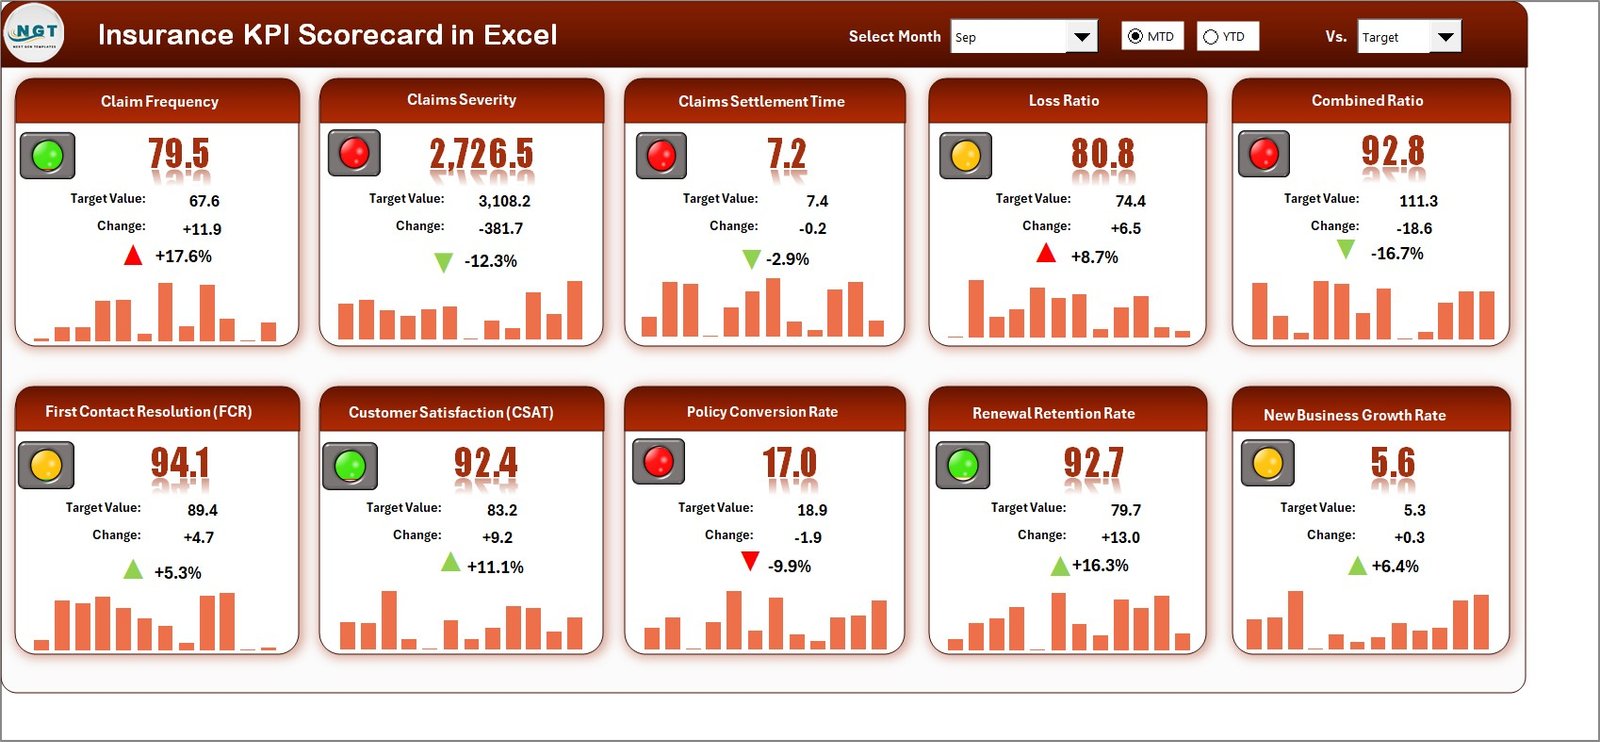
Tracking insurance performance shouldn’t be a guessing game — it should be data-driven 📊. The Insurance KPI Scorecard in Excel transforms how insurers, brokers, and financial analysts evaluate their business results. From claims management to underwriting efficiency, this all-in-one Excel template makes performance monitoring effortless, visual, and actionable.
With powerful automation, dynamic drop-downs, and color-coded indicators, it empowers decision-makers to focus on what matters most — driving profitability, improving customer satisfaction, and optimizing every insurance process.
Key Features of Insurance KPI Scorecard in Excel
✅ Smart Performance Dashboard:
Easily view all your critical KPIs — from claim settlement time to premium growth rate — in one centralized view.
✅ MTD & YTD Tracking:
Monitor both Month-to-Date and Year-to-Date results to understand short-term progress and long-term performance trends.
✅ Dynamic Drop-Down Filters:
Select months, KPIs, and performance periods instantly to see exactly what you need.
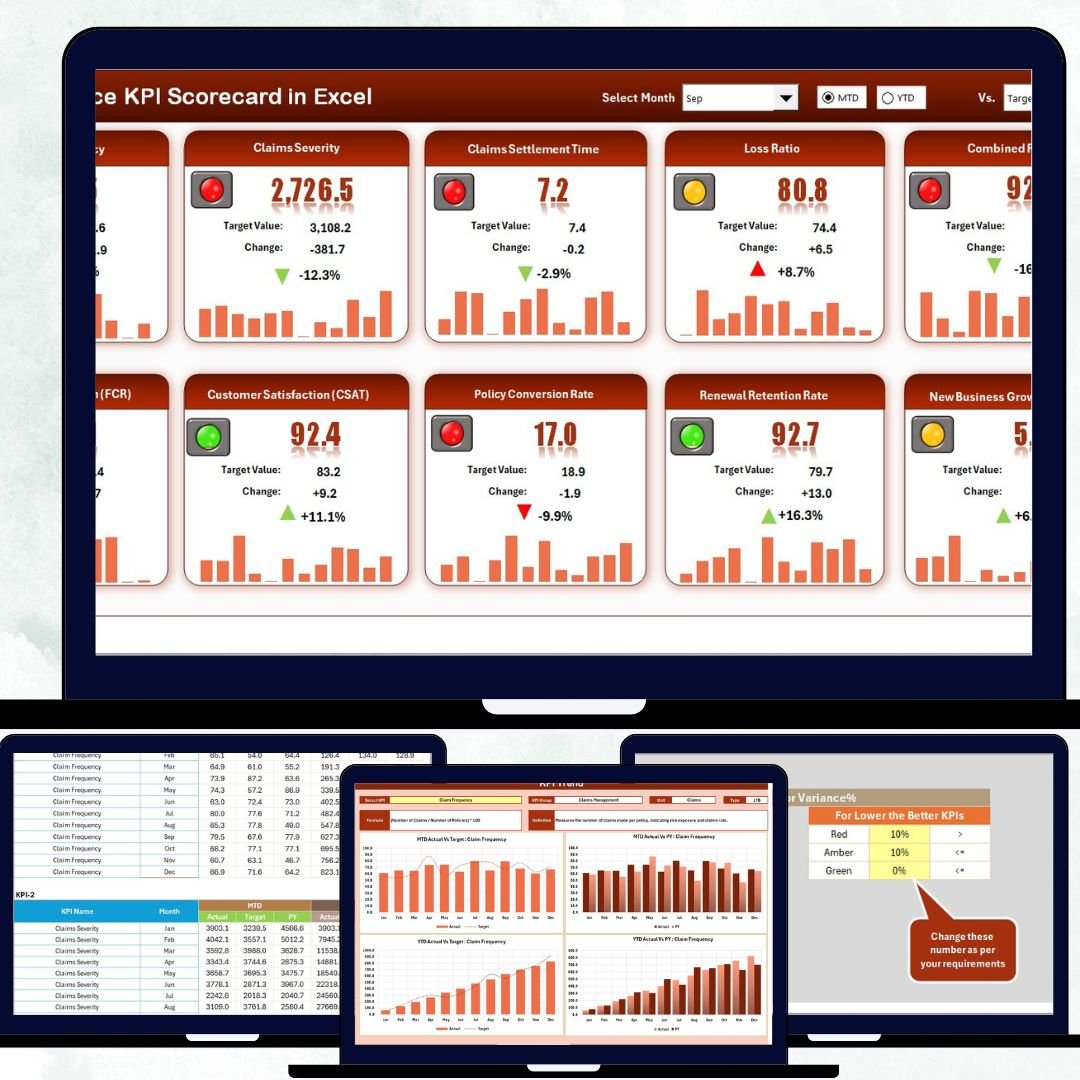
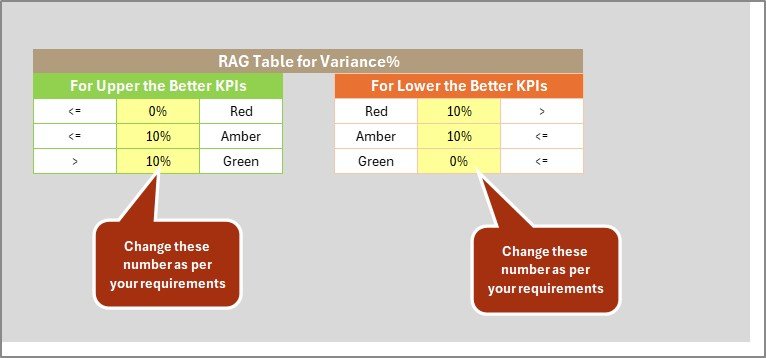
✅ Visual Performance Indicators:
Color-coded traffic-light symbols (🟢🟡🔴) highlight whether your KPIs are on track, at risk, or lagging.
✅ Automated Calculations:
No need to crunch numbers manually — all charts and summaries update automatically when you change data.
✅ Fully Customizable Template:
Add, edit, or remove KPIs to match your organization’s reporting structure.
✅ Cost-Effective Solution:
Skip expensive software — Excel delivers the same level of analytical insight at zero extra cost.
✅ Data-Driven Insights:
Instantly identify underperforming areas and take timely corrective action.
📦 What’s Inside the Insurance KPI Scorecard in Excel
📊 Scorecard Sheet – The main dashboard where you can select the month, choose between MTD or YTD, and instantly view visual KPI performance with actual vs target comparisons.
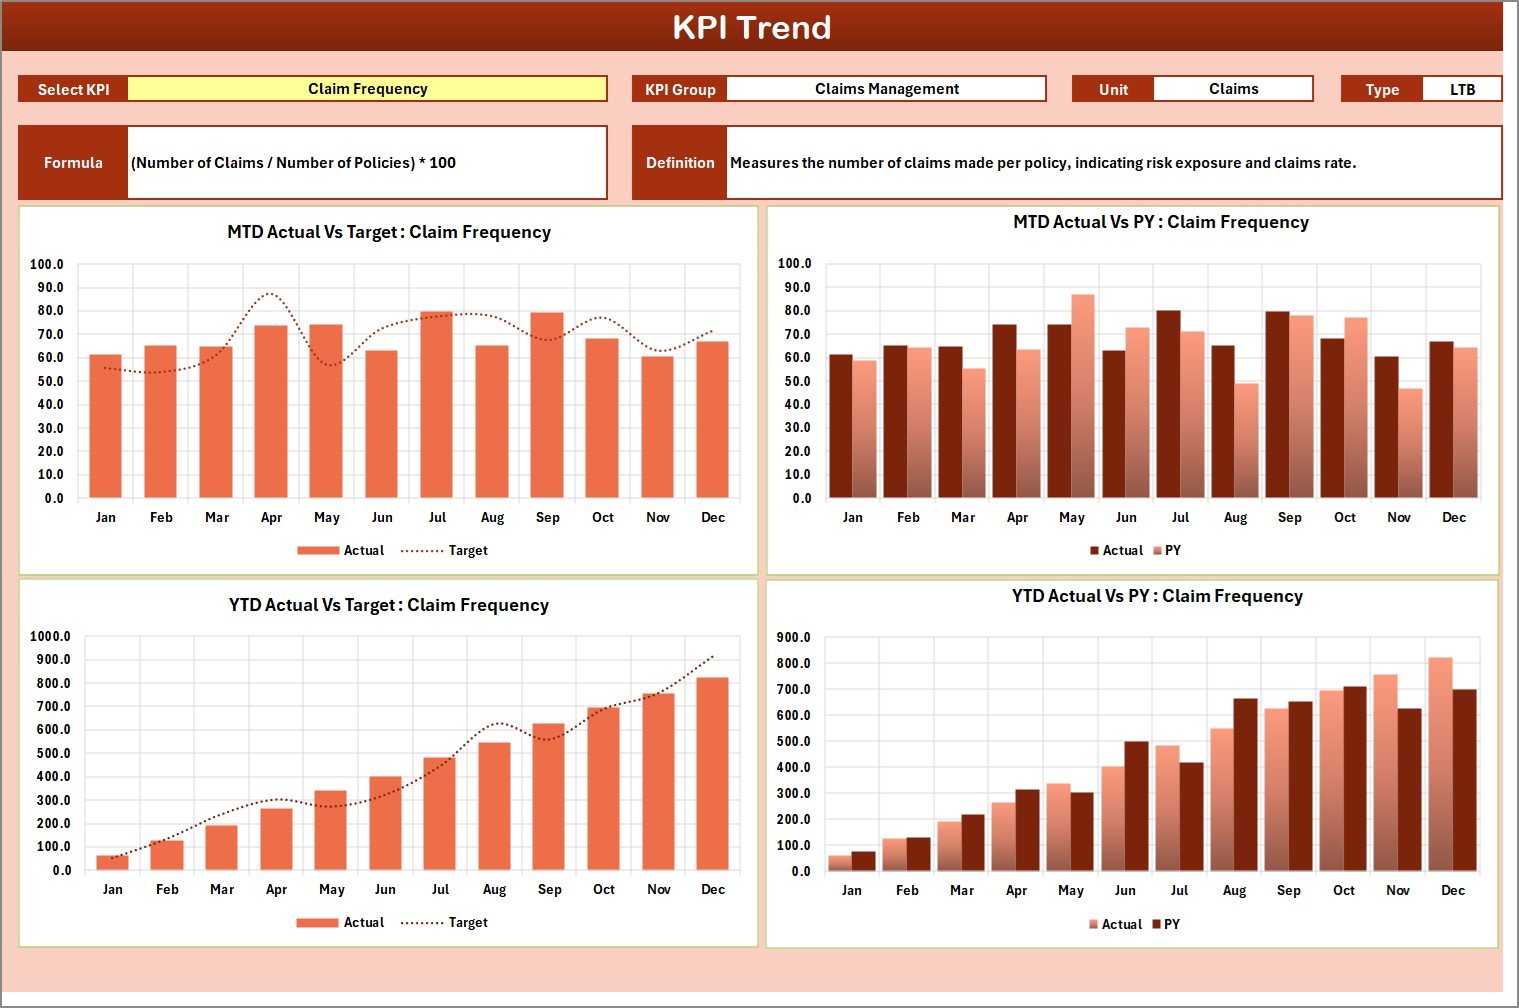
📈 KPI Trend Sheet – Deep dive into each KPI. Choose a KPI from the dropdown (cell C3) and see trend charts comparing Actual, Target, and Previous Year values.
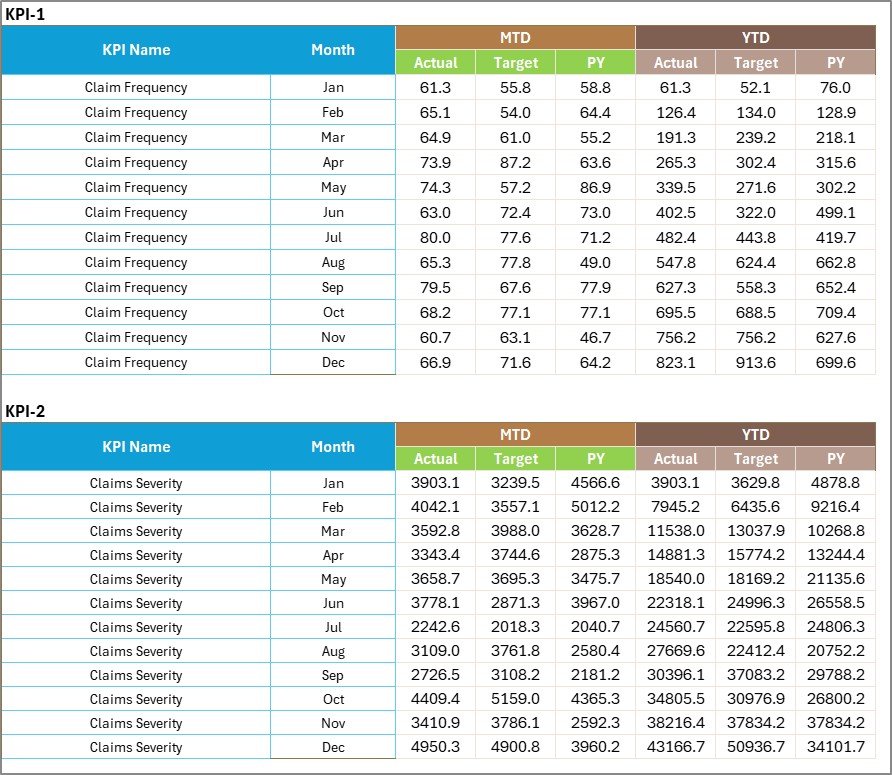
🧾 Input Data Sheet – The data backbone. Enter or import your KPI values, and the dashboard auto-updates with zero manual recalculation.
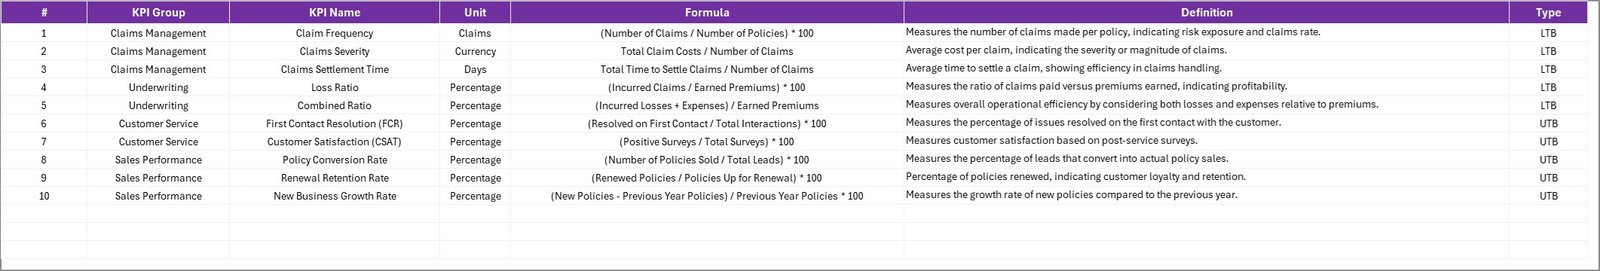
📘 KPI Definition Sheet – A standardized list defining each KPI’s formula, type (LTB/UTB), and description for organization-wide clarity.
This structured layout ensures consistency, transparency, and instant updates across all sheets — making it perfect for executives, analysts, and department heads alike.
🧭 How to Use the Insurance KPI Scorecard in Excel
1️⃣ Download & Open the Excel file.
2️⃣ Enter Your Data in the Input Data Sheet — include Actual, Target, and Previous Year values.
3️⃣ Go to the Scorecard Sheet and pick your desired month from the dropdown.
4️⃣ Analyze KPI Trends in the KPI Trend Sheet for detailed MTD/YTD insights.
5️⃣ Customize KPIs in the Definition Sheet to align with your internal metrics.
💡 Within minutes, you’ll have a professional, automated, and visually rich performance scorecard ready to share with your leadership team.
👥 Who Can Benefit from This Insurance KPI Scorecard
🏢 Insurance Executives — Get an instant snapshot of company-wide performance across all functions.
📑 Department Managers — Evaluate claims, underwriting, or customer service efficiency in one place.
💼 Financial Analysts — Monitor profitability, expense ratio, and loss ratio trends easily.
📊 Consultants & Brokers — Present performance insights to clients with clarity and credibility.
🧠 Business Strategists — Use MTD/YTD data for forecasting, budgeting, and resource optimization.
👨💻 Data Professionals — Convert Excel data into Power BI dashboards or integrate with ERP systems.
Whether you’re managing life, health, or general insurance operations, this scorecard adapts perfectly to your workflow.
💥 Why You’ll Love This Template
✔ No coding or technical expertise needed.
✔ Fully Excel-based — compatible with all versions.
✔ Designed for real-world business users.
✔ Boosts productivity, accuracy, and accountability.
✔ Ideal for KPI reporting, management reviews, and monthly dashboards.


Reviews
There are no reviews yet.