Monitoring infrastructure performance has never been easier! 🚀 The Infrastructure KPI Scorecard in Excel is a powerful, ready-to-use performance management tool built to help project managers, engineers, and executives track, analyze, and improve key metrics across infrastructure projects — all in one place.
From roads and bridges to utilities and construction projects, this Excel-based scorecard brings data to life through smart visuals, dynamic filters, and insightful analytics — helping you make confident, data-driven decisions every single time.
⚙️ Key Features of the Infrastructure KPI Scorecard in Excel
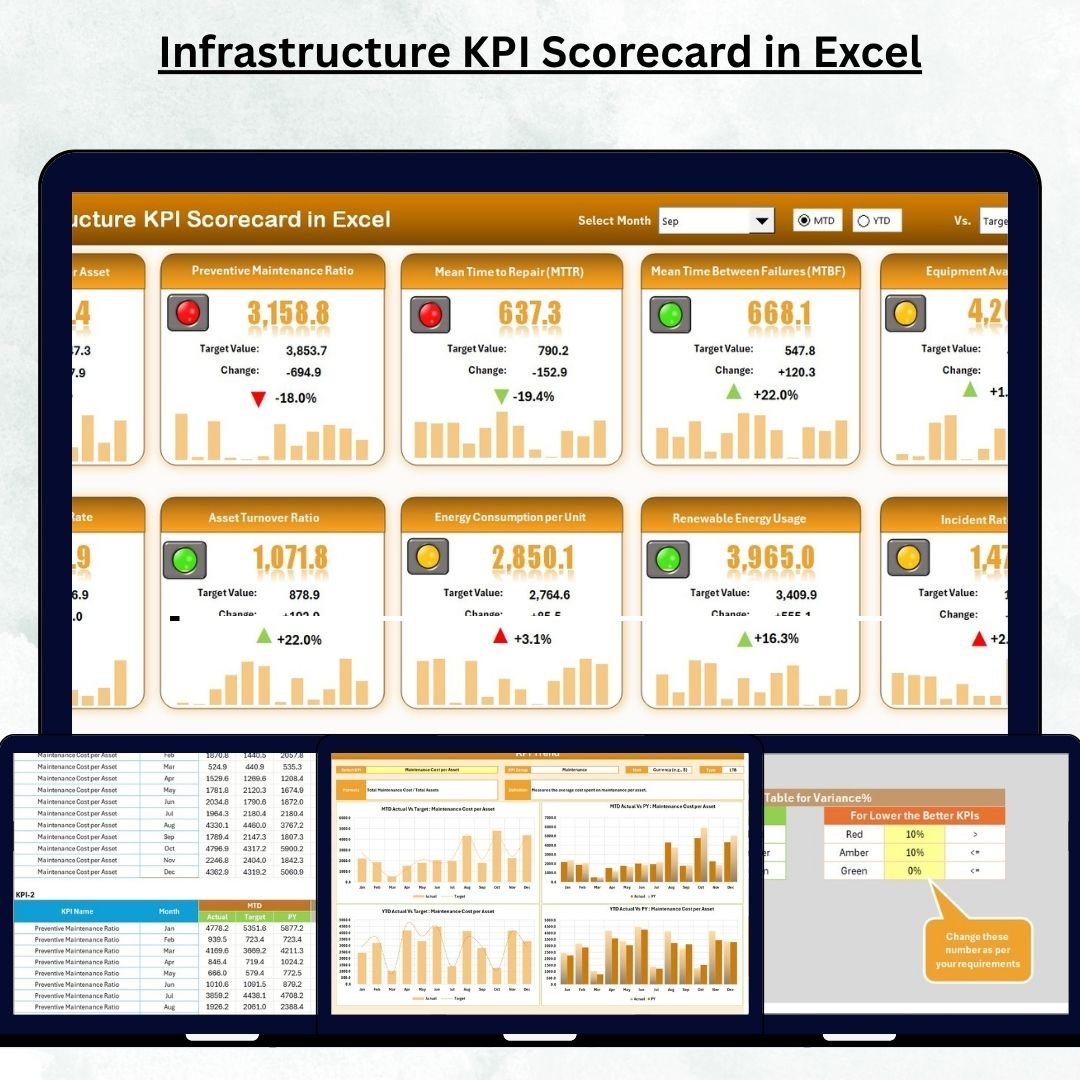
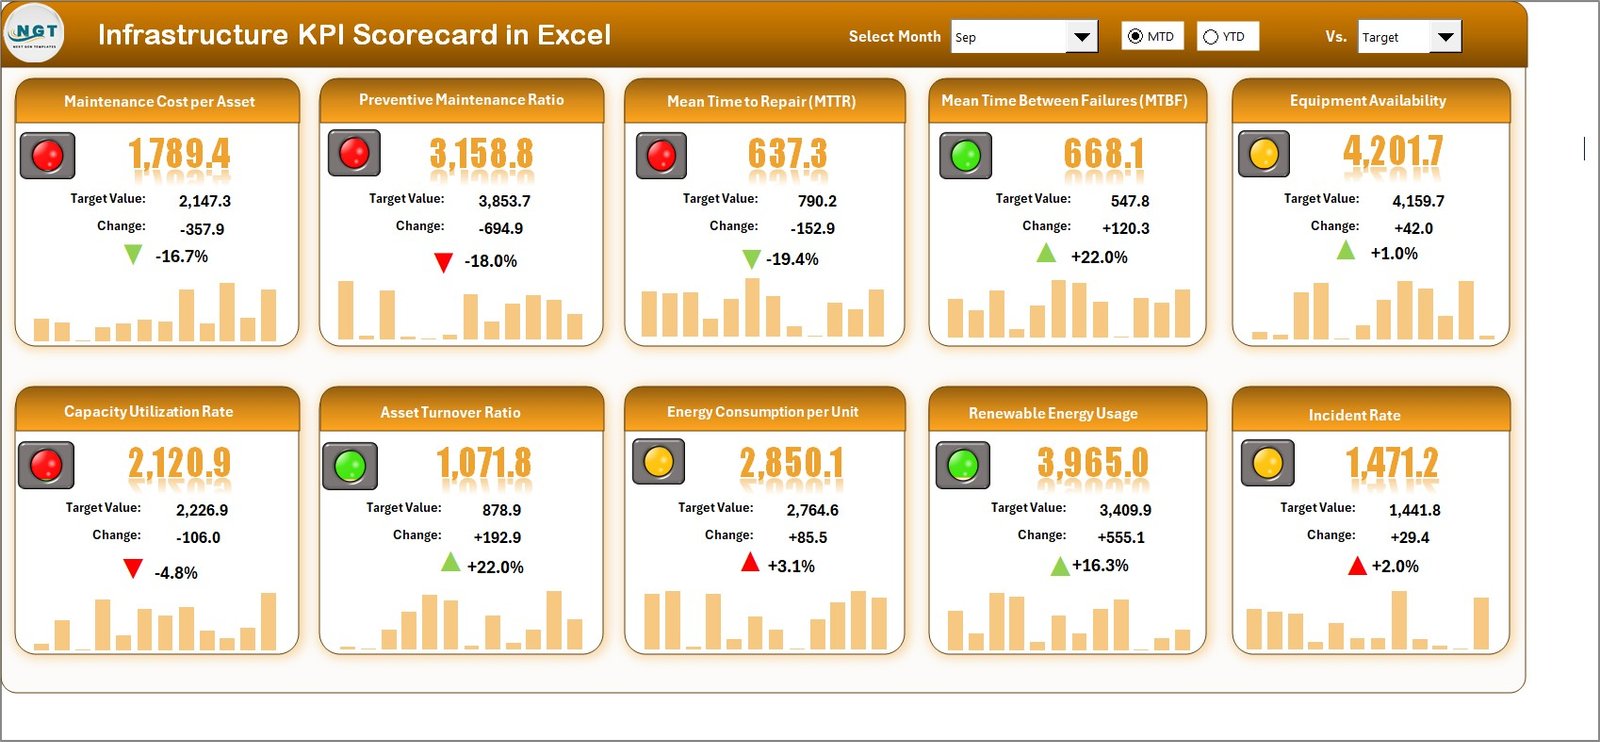
✨ Interactive Dashboard: Get a clear overview of 10 critical KPIs with visual indicators that instantly show performance status (Green ✅ for on-track, Yellow ⚠️ for moderate variance, Red 🔴 for underperforming).
📊 Actual vs Target Comparison: Compare real results with targets to identify performance gaps quickly.
📅 Month-to-Date & Year-to-Date Analysis: Use dropdown filters to switch between MTD and YTD performance for flexible reporting.
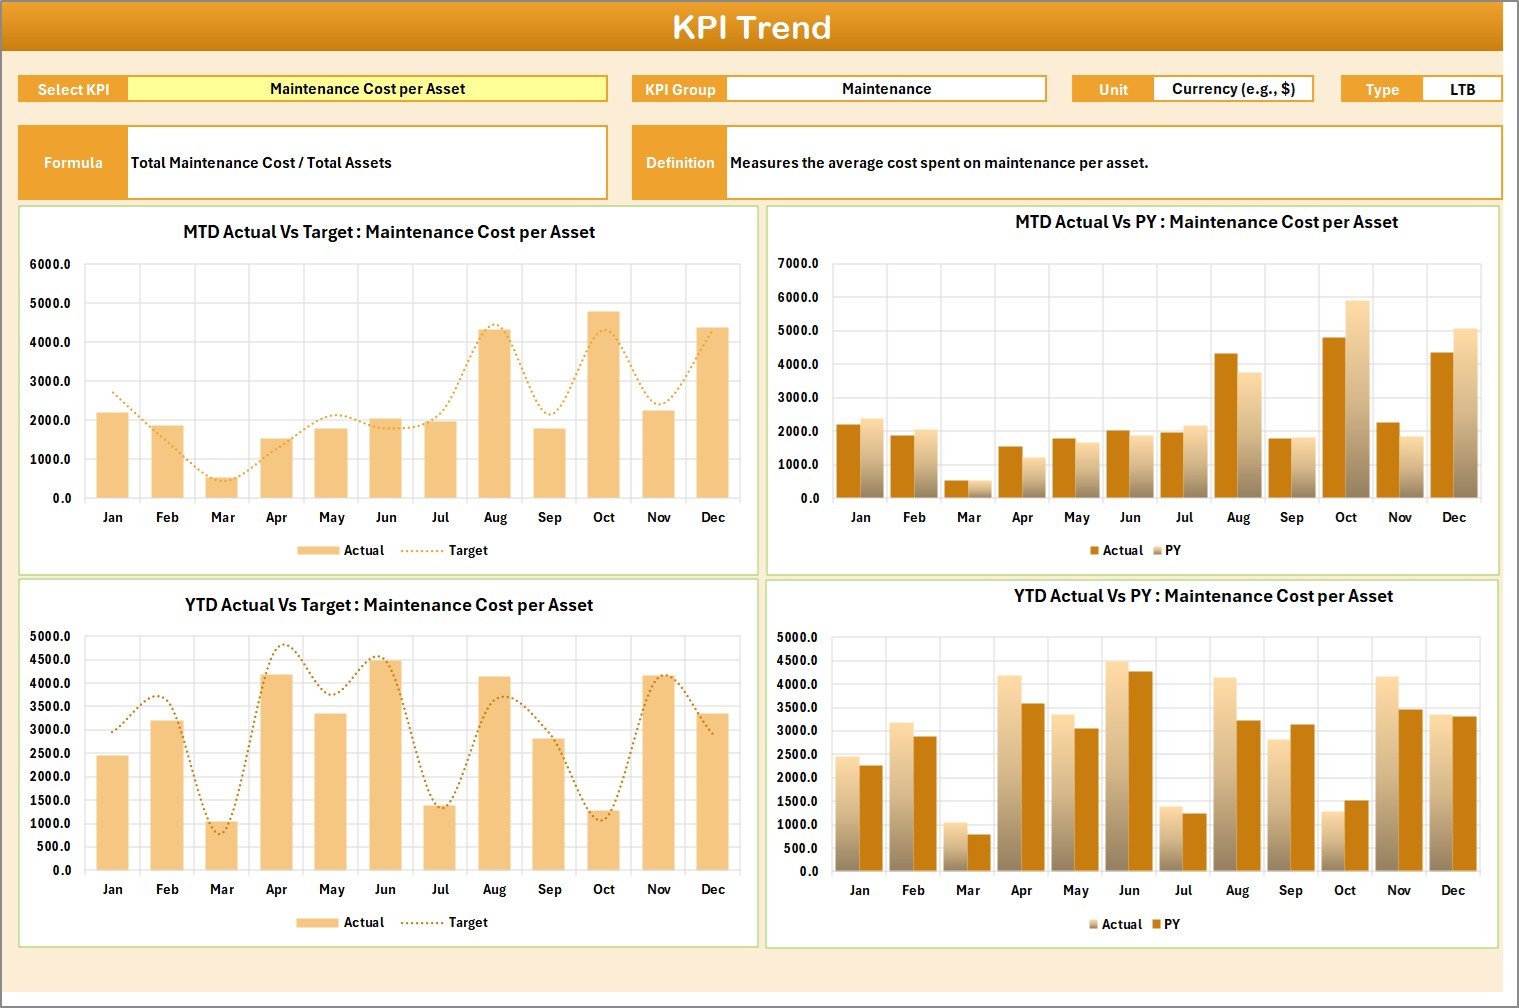
📈 Dynamic Trend Charts: Visualize KPI progress over time through automatically updating line and bar charts.
📁 Comprehensive Data Integration: The entire system links seamlessly — update one sheet and all visuals refresh instantly.
💡 Color-Coded Insights: Conditional formatting instantly highlights areas that need attention, making analysis quick and easy.
🔒 No Coding Required: Everything works using built-in Excel formulas, ensuring zero setup complexity.
🧮 Fully Customizable: Add or modify KPIs, formulas, or visuals based on your organization’s unique goals.
📂 What’s Inside the Infrastructure KPI Scorecard in Excel
This professional-grade Excel template includes four well-structured worksheets designed for complete project performance management:
1️⃣ Scorecard Sheet:
The heart of the system — a centralized dashboard displaying all key metrics, comparisons, and variance indicators in one glance.
2️⃣ KPI Trend Sheet:
Analyze performance trends over months or years. Use dropdowns (cell C3) to select KPIs and explore MTD/YTD visuals against targets and previous years.
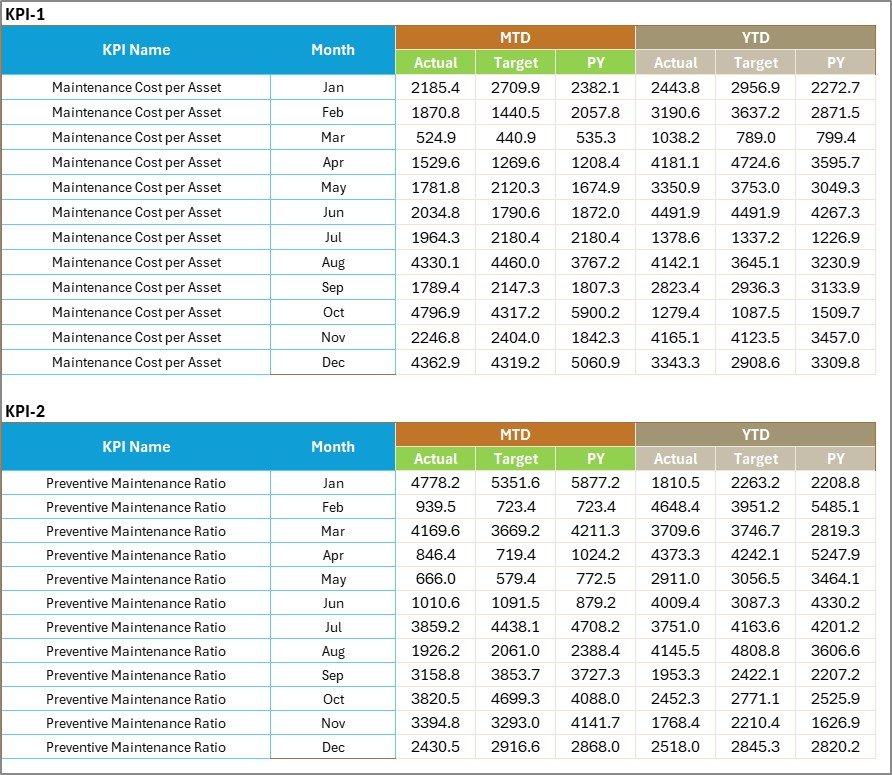
3️⃣ Input Data Sheet:
Enter actuals, targets, and previous year data here. The sheet automatically feeds the entire scorecard, keeping everything updated in real time.
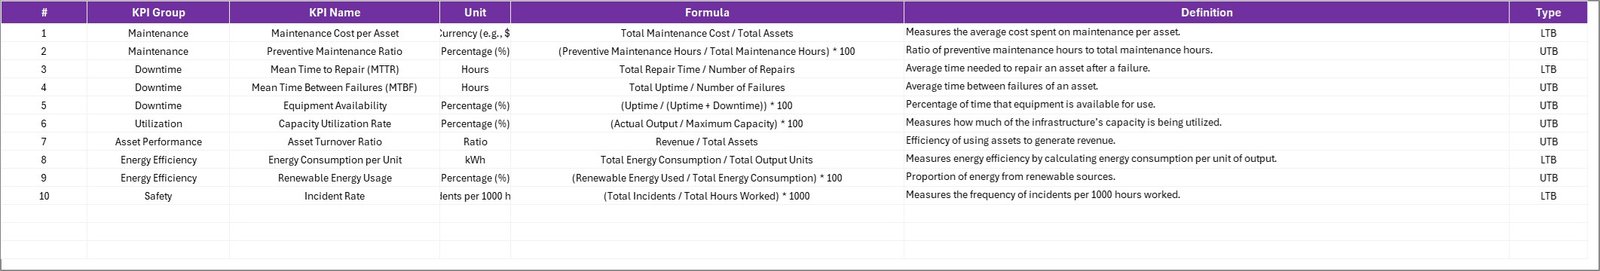
4️⃣ KPI Definition Sheet:
Define each KPI clearly — including unit, formula, and explanation — to maintain standardization and ensure data accuracy across all teams.
Together, these sheets create a complete, easy-to-use performance tracking ecosystem suitable for any infrastructure project.
🧭 How to Use the Infrastructure KPI Scorecard in Excel
✅ Step 1: Open the KPI Definition Sheet and define all metrics with their formulas, units, and target directions.
✅ Step 2: Go to the Input Data Sheet and record actual, target, and previous year data for each month.
✅ Step 3: Switch to the Scorecard Sheet to view live performance comparisons with color-coded visuals.
✅ Step 4: Use the KPI Trend Sheet to analyze progress, spot patterns, and understand long-term changes.
✅ Step 5: Present results in management meetings, adjust plans, and implement data-driven improvements!
Within minutes, you’ll transform complex performance data into meaningful insights ready for reporting, presentations, and decision-making.
👥 Who Can Benefit from This Infrastructure KPI Scorecard
🏗️ Project Managers: Track construction timelines, budgets, and progress efficiently.
⚙️ Engineers & Site Leads: Monitor resource utilization, safety metrics, and maintenance schedules.
💼 Executives & Decision-Makers: Get quick, high-level visibility of organizational performance.
🏢 Government & Public Sector Officials: Evaluate public works and infrastructure projects objectively.
💡 Consultants & Analysts: Customize KPIs to fit multiple client needs and project types.
📊 Financial Controllers: Track budget variance and cost efficiency seamlessly.
🔍 Quality & Safety Teams: Identify trends and ensure compliance with safety and operational standards.
Whether you manage roads, bridges, energy plants, or utilities — this scorecard gives you clarity, accuracy, and control over every KPI that matters.


Reviews
There are no reviews yet.