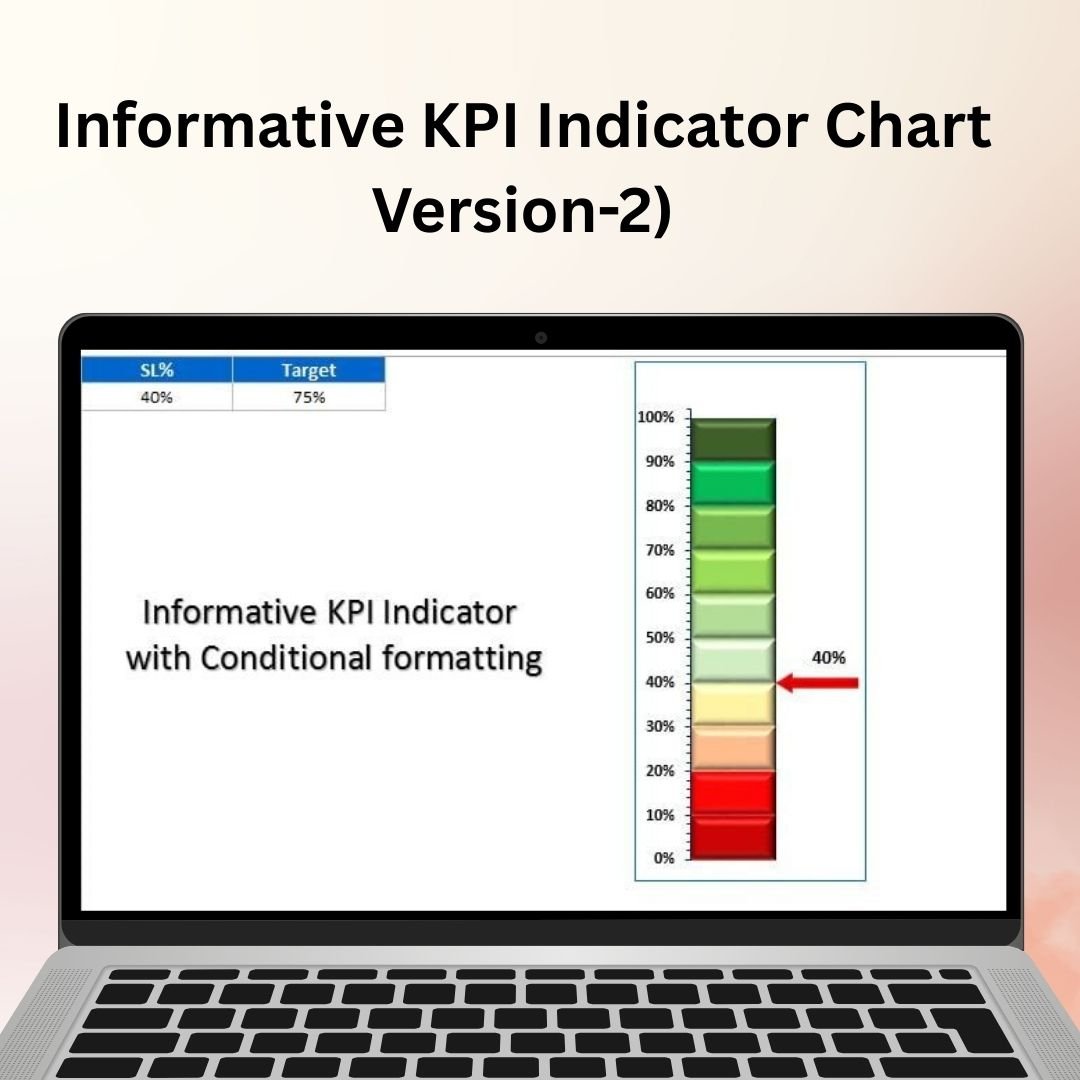
The Informative KPI Indicator Chart – Version 2 is an advanced Excel tool designed to help you visually track and display key performance indicators (KPIs) in a clean, informative, and dynamic way. Whether you’re a business owner, a team leader, or a project manager, this chart makes it easy to assess performance, identify trends, and make data-driven decisions with just a glance.
This version of the KPI indicator chart offers advanced features that provide an in-depth analysis of your data. From progress indicators to target tracking, the chart is fully customizable, allowing you to tailor it to your specific KPIs, whether they’re related to sales, project progress, team performance, or any other metric important to your business. With dynamic visualizations and intuitive data inputs, you’ll be able to present data that’s clear, actionable, and engaging for stakeholders.
Key Features of the Informative KPI Indicator Chart – Version 2:
📊 Dynamic KPI Tracking
Track up to 5 different KPIs at once, each displayed with progress bars, color-coded indicators, and numerical values. With the ability to adjust target values, this chart allows you to monitor multiple key metrics in a single view.
🔄 Real-Time Data Updates
This Excel chart automatically updates and recalculates as you input new data, allowing you to track real-time progress for each KPI. This ensures that your performance indicators are always up to date without the need for manual adjustments.
📈 Visually Appealing Dashboard
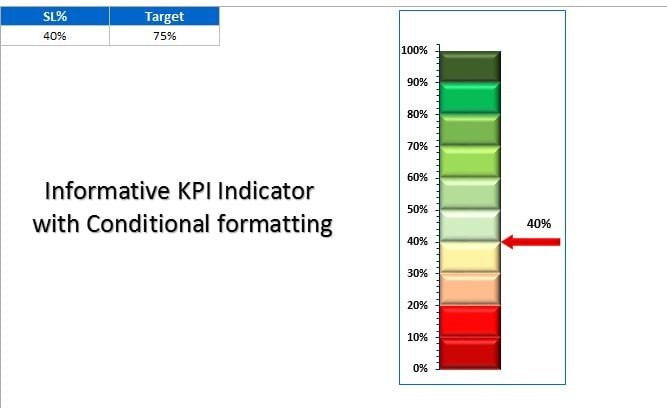
The chart includes visually engaging indicators such as progress bars, trend lines, and target markers that make it easier to spot performance trends, highlight areas of improvement, and communicate results effectively.
🛠️ Customizable Input Fields
The chart allows you to adjust the values, targets, and KPIs to suit your business needs. Whether you’re tracking sales revenue, customer satisfaction, project timelines, or any other performance measure, you can easily customize the chart to reflect your unique goals.
⚙️ Easy-to-Use Interface
With a simple, user-friendly layout, this chart ensures that anyone, regardless of Excel expertise, can use it efficiently. The intuitive design and clear structure allow you to quickly navigate through data inputs and performance tracking.
Why You’ll Love This Informative KPI Indicator Chart:
✅ Simplifies KPI Tracking – Track multiple KPIs in one place, making it easier to keep a close eye on your business performance. ✅ Boosts Decision-Making – With clear visual indicators, quickly identify trends and performance gaps that need attention, enabling timely decisions. ✅ Customizable for Any Business – Adjust targets and values for any KPI, whether you’re in sales, marketing, operations, or project management. ✅ Real-Time Performance Updates – The chart refreshes automatically as new data is entered, ensuring you always have the most accurate information. ✅ Professional & Engaging Visuals – Present performance data in a visually compelling way, making it easier to communicate insights to stakeholders.
What’s Inside the Informative KPI Indicator Chart – Version 2:
- KPI Tracking – Track up to 5 different KPIs at once with progress bars and target markers.
- Real-Time Calculations – Input data and watch the chart automatically update with recalculated values.
- Customizable KPIs – Add, remove, or modify KPIs to suit your business needs.
- Progress Bars & Trend Lines – Visual indicators to show progress against targets.
- User-Friendly Dashboard – A clean, intuitive layout designed for easy data input and performance monitoring.
How to Use the Informative KPI Indicator Chart – Version 2:
1️⃣ Download the Template – Access your Excel file instantly after purchase. 2️⃣ Input Your Data – Add your current performance data for each KPI. 3️⃣ Track Progress – Watch the chart automatically update with new data. 4️⃣ Monitor Trends & Gaps – Use the visual indicators to spot areas that need improvement and take action.
Who Can Benefit from the Informative KPI Indicator Chart – Version 2?
- Business Owners
- Project Managers
- Sales and Marketing Teams
- Operations Managers
- HR and Performance Managers
- Small and Medium Businesses (SMBs)
- Large Enterprises
Track your KPIs effortlessly and make data-driven decisions that improve performance across your team or organization with this easy-to-use, visually engaging Excel chart.
Click here to read the Detailed blog post
https://www.pk-anexcelexpert.com/informative-kpi-indicator-chart-version-2/


Reviews
There are no reviews yet.