


Managing housing and urban development projects requires accuracy, quick insights, and continuous monitoring. From occupancy rates to project completion, from budget utilization to resident satisfaction—every KPI matters. But when this information spreads across multiple files, tracking performance becomes slow, confusing, and time-consuming.
That’s why we created the Housing & Urban Development KPI Dashboard in Excel—a complete, ready-to-use performance tracking system designed to simplify your entire reporting process. Whether you manage housing authorities, development boards, municipalities, or construction operations, this dashboard helps you make faster, smarter, and more confident decisions.
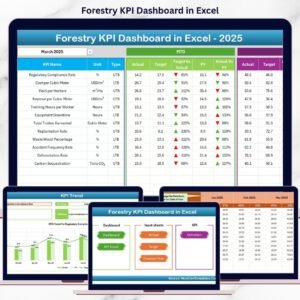
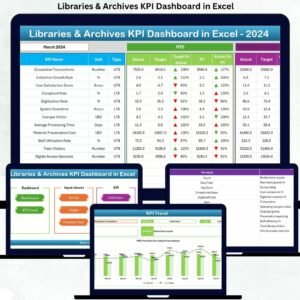
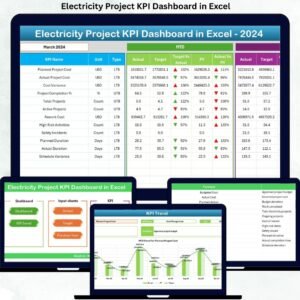
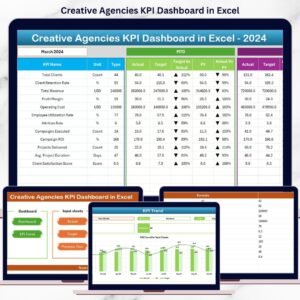
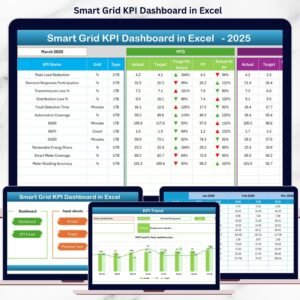
This powerful digital template brings MTD, YTD, Target, and Previous Year comparisons into one interactive and automated Excel dashboard. With built-in navigation, KPI definitions, trend charts, and structured data sheets, this tool replaces complicated manual reporting with simple, visual, and intuitive analysis.
🌟 Key Features of the Housing & Urban Development KPI Dashboard in Excel
This dashboard includes 7 intelligently designed worksheets, each built to streamline performance monitoring and support better decision-making.
📌 Summary Page
A quick navigation hub with 6 smart buttons that help you move through sheets instantly—improving user experience and workflow.
📊 Dashboard Page
Your main performance screen that updates instantly when selecting any month from a drop-down.
You’ll view:
-
MTD Actual, Target & Previous Year (PY)
-
YTD Actual, Target & PY
-
Target vs Actual (with arrow indicators)
-
PY Comparison (with conditional formatting)
This is your complete picture of housing performance in one clean layout.
📈 Trend Page
Select a KPI from the drop-down and instantly see:
-
KPI Group
-
Unit
-
Formula
-
KPI Type (UTB or LTB)
-
MTD Trend Chart
-
YTD Trend Chart
Perfect for monthly and yearly review meetings.
🧮 Actual Numbers Sheet
Enter MTD and YTD performance data month-by-month.
The entire dashboard reads and updates from this sheet.
🎯 Target Sheet
Record monthly and yearly targets for each KPI.
The dashboard automatically calculates performance achievement vs target.
📅 Previous Year Sheet
Compare last year’s results with current numbers to understand progress, gaps, and trends.
📘 KPI Definition Sheet
A complete KPI dictionary to maintain clarity across all departments.
You define KPI Name, Unit, Formula, Description, and Type.

📦 What’s Inside the Housing & Urban Development KPI Dashboard in Excel
When you download this product, you receive:
-
✔️ Fully automated Excel dashboard
-
✔️ Summary page with quick navigation
-
✔️ Dynamic KPI visuals & trend charts
-
✔️ Structured sheets for Actual, Target & PY
-
✔️ Auto-updating month selector
-
✔️ Clean & professional design
-
✔️ Complete KPI definition library
-
✔️ Pre-built formulas, drop-downs & conditional formatting
-
✔️ Easy-to-edit structure for your KPIs
Everything is already built for you—just input your data and start tracking!
🛠️ How to Use the Housing & Urban Development KPI Dashboard in Excel
Using this dashboard is extremely simple—even for beginners:
-
Select the first month of the financial year in the Actual Numbers sheet.
-
Enter MTD and YTD Actual values every month.
-
Go to the Target Sheet and enter monthly/yearly targets.
-
Add Previous Year data to enable PY comparison.
-
Review performance on the Dashboard Page (MTD, YTD, Target, PY).
-
Use the Trend Page for detailed KPI analysis.
-
Refer to the KPI Definition Sheet to maintain clarity.
No advanced Excel skills required—everything is automated!
🎯 Who Can Benefit from This Housing & Urban Development KPI Dashboard in Excel
This dashboard is perfect for:
-
🏢 Housing Authorities
-
🏙️ Urban Development Boards
-
🧱 Construction & Infrastructure Teams
-
🏠 Real Estate Developers
-
🏘️ Community Development Departments
-
🏗️ Municipal Corporations
-
💼 Project Managers & Operational Teams
If you track KPIs, budgets, occupancy, or development timelines—this dashboard will dramatically improve your workflow, accuracy, and reporting efficiency.
Click here to read the Detailed Blog Post
Watch the step-by-step video tutorial:


Reviews
There are no reviews yet.