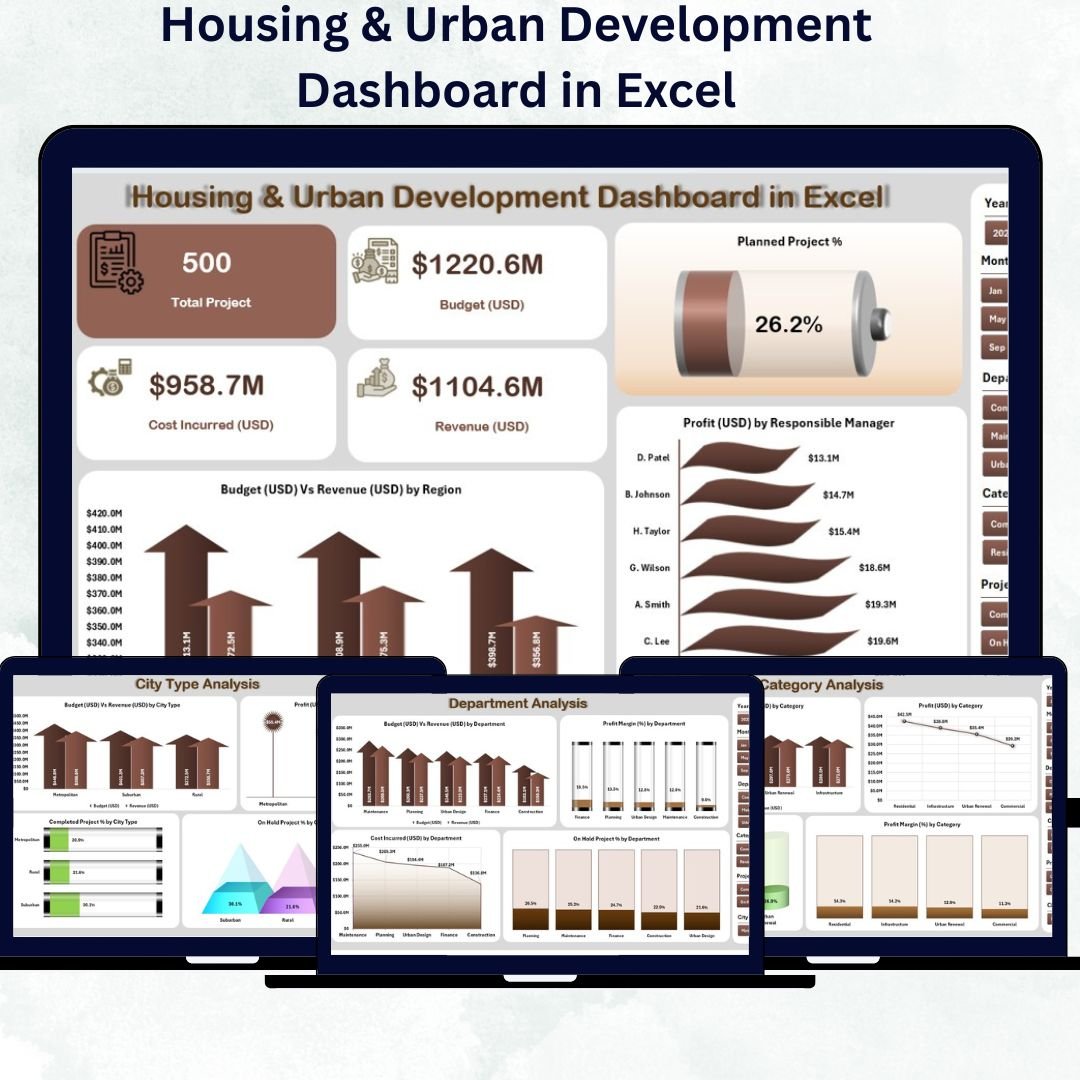
💡 Housing & Urban Development Dashboard in Excel – Plan Smarter, Build Better, Manage Efficiently!
City planning and infrastructure development demand clarity, accountability, and data-driven decisions. The Housing & Urban Development Dashboard in Excel brings all of that together in one elegant, ready-to-use reporting system.
Built entirely in Microsoft Excel, this dashboard helps planners, analysts, and policy makers track budgets, monitor projects, compare revenue vs. costs, and evaluate performance across departments and regions — without needing any complex software or technical skills.
With dynamic charts, KPI cards, and interactive slicers, it transforms raw housing data into clear, visual insights that accelerate decision-making and improve urban development outcomes.
⚙️ Key Features of the Housing & Urban Development Dashboard in Excel
✅ 📊 Five Analytical Pages + Support Sheet – A complete analytical structure for performance, finance, and trend tracking.
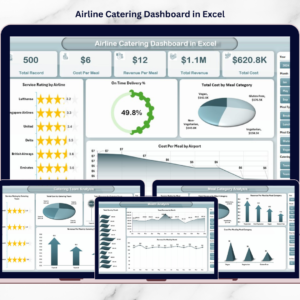
🏠 1. Overview Page – The Main Control Center
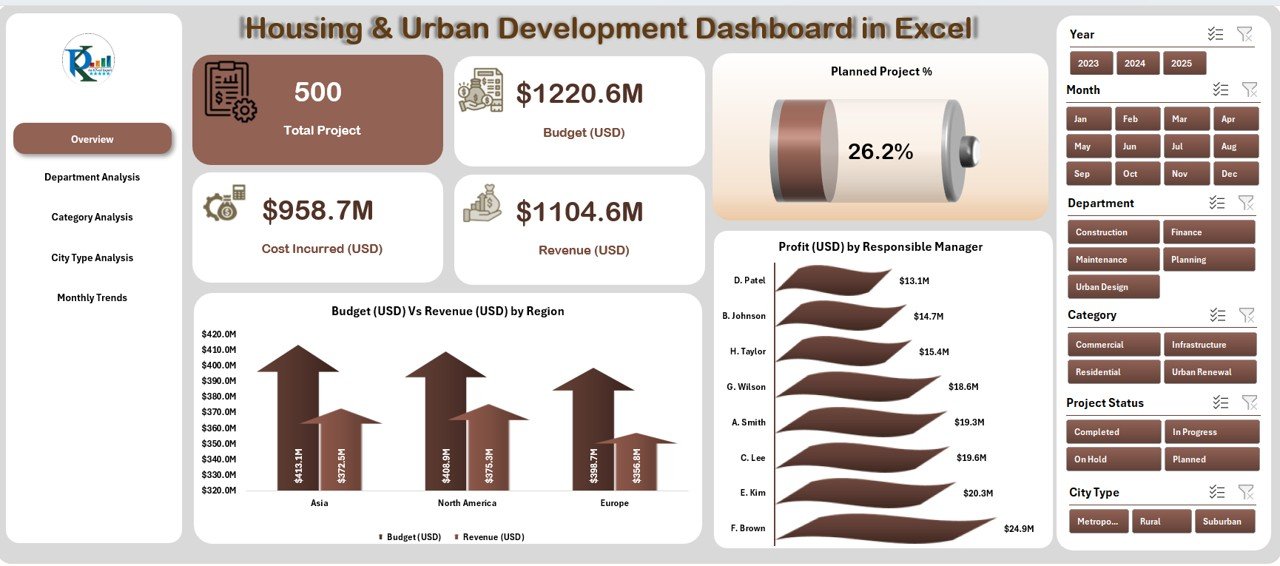
Get a snapshot of your entire housing program at a glance.
Key Highlights:
-
🎛️ Left-side Page Navigator for quick access to all sections.
-
💬 KPI Cards showing Total Projects, Budget Utilization %, and Profit Margin %.
-
📈 Charts included:
-
Planned Project (%)
-
Budget (USD) vs Revenue (USD) by Region
-
Profit (USD) by Responsible Manager
-
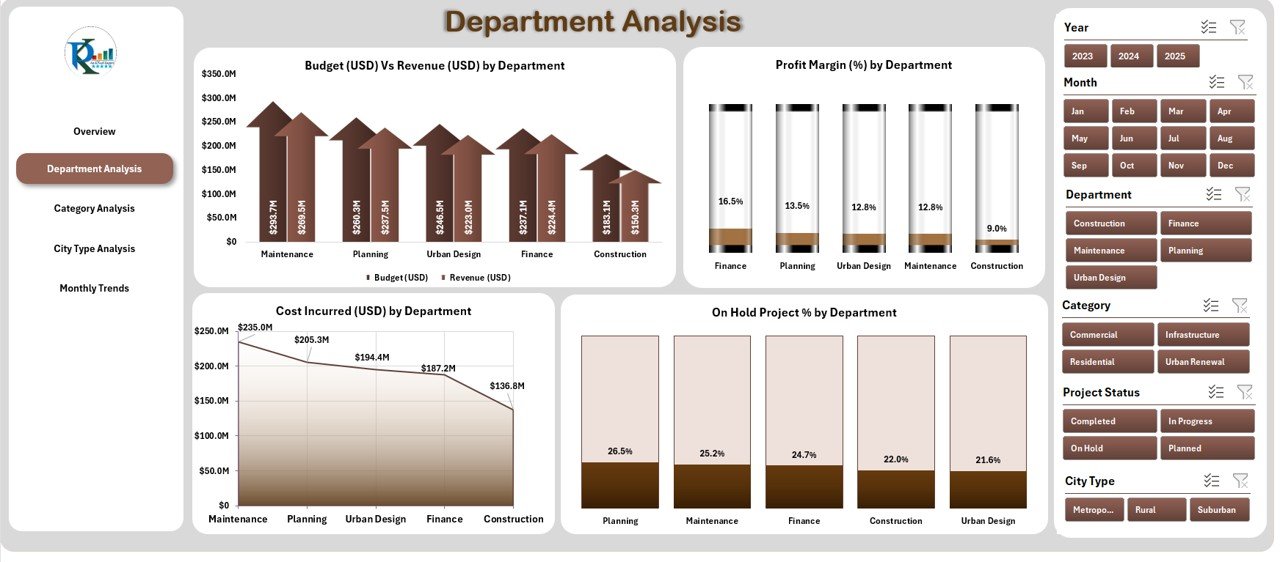
🏢 2. Department Analysis Page
Drill down into department-level performance.
Charts:
-
Budget vs Revenue by Department
-
Profit Margin (%) by Department
-
Cost Incurred (USD) by Department
-
On-Hold Project (%) by Department
Quickly identify which departments drive growth and which need attention.
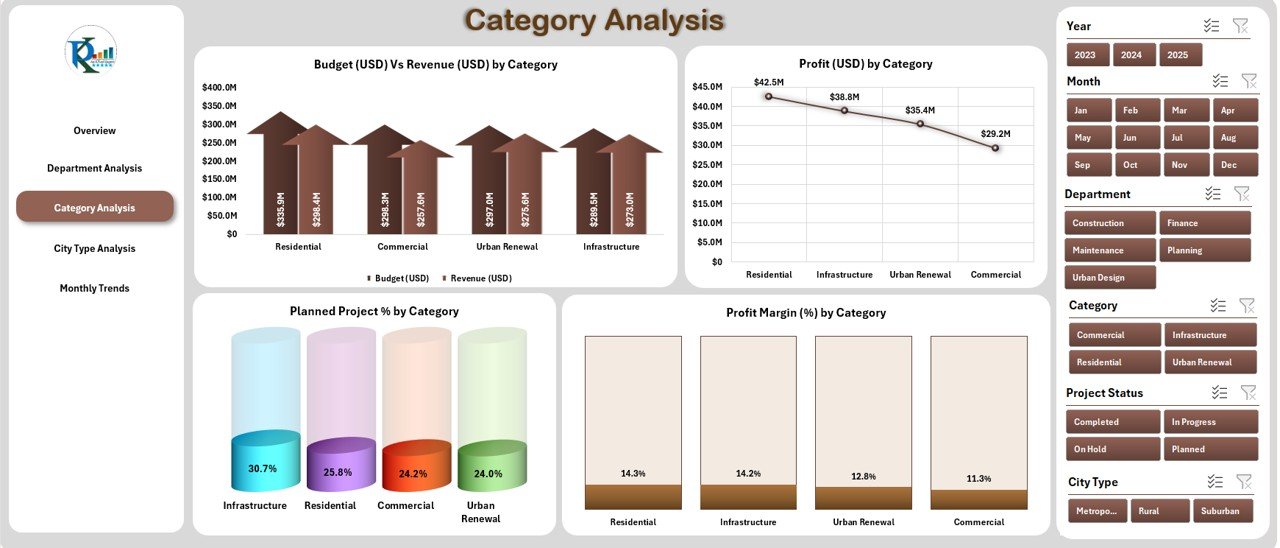
🏗️ 3. Category Analysis Page
Compare project categories like Affordable Housing, Urban Renewal, and Smart City initiatives.
Visuals include:
-
Budget vs Revenue by Category
-
Profit Margin (%) by Category
-
Planned Project (%) by Category
-
Cost Incurred (USD) by Category
Perfect for assessing which project types deliver the highest returns or need strategic support.
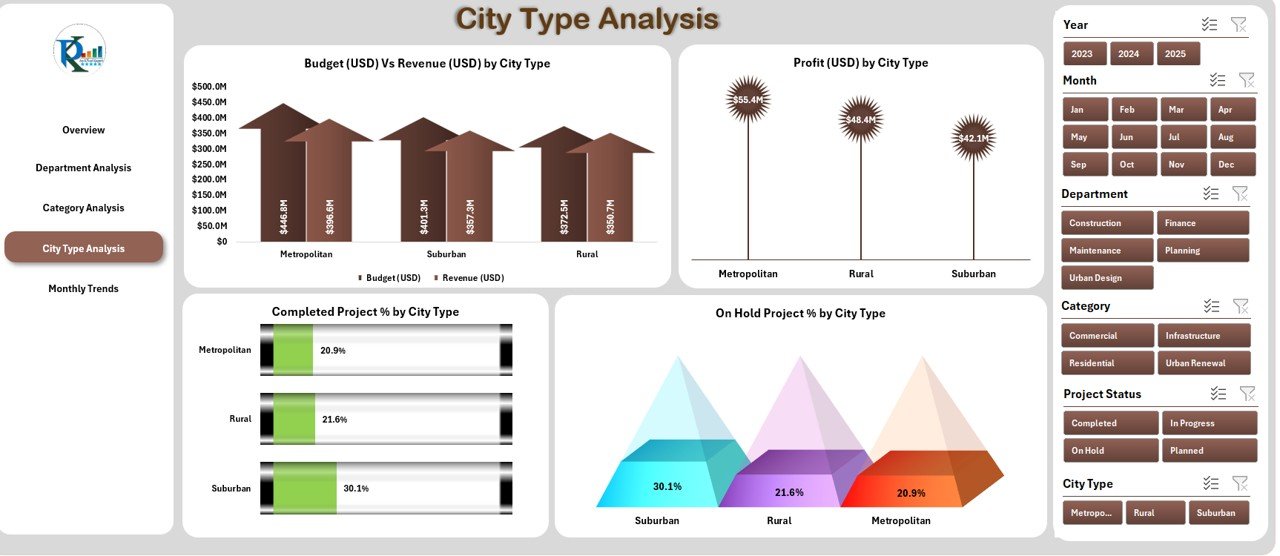
🌆 4. City Type Analysis Page
Analyze performance by urban, suburban, and rural projects.
Charts:
-
Budget vs Revenue by City Type
-
Profit Margin (%) by City Type
-
Completed Project (%) by City Type
-
On-Hold Project (%) by City Type
Enables data-backed resource allocation for each city segment.
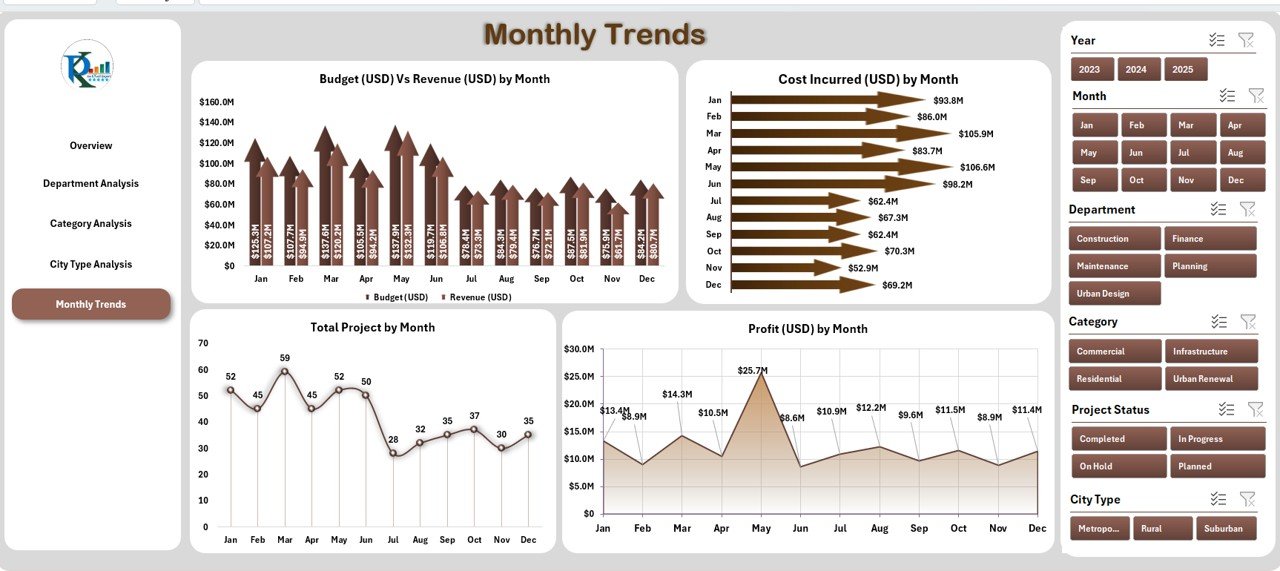
📅 5. Monthly Trends Page
Track progress throughout the year with:
-
Budget vs Revenue by Month
-
Cost Incurred by Month
-
Total Projects by Month
-
Profit (USD) by Month
Ideal for forecasting and evaluating seasonal performance patterns.
🧩 Support Sheet & Data Sheet
-
Data Sheet: Enter project details — budget, revenue, cost, city type, department, status.
-
Support Sheet: Manages dropdowns and slicer references for error-free inputs.
All visuals auto-refresh from these sheets — just update your data and analyze.
🧠 How to Use the Dashboard
1️⃣ Add or import data into the Data Sheet.
2️⃣ Click Refresh All to update charts and KPIs.
3️⃣ Navigate via the page navigator on the left.
4️⃣ Filter by region, month, or category to explore specific segments.
5️⃣ Use results for budget reviews or policy planning sessions.
💼 Benefits of Using This Dashboard
-
📊 Centralized Reporting: All project data in one Excel file.
-
⚡ Instant Analysis: Automatic charts and trend tracking.
-
💰 Financial Control: Monitor budget utilization and revenue growth.
-
🎯 Data-Driven Decisions: Spot issues and take corrective action quickly.
-
🧩 Customizable: Add KPIs or change themes as needed.
-
📈 Scalable: Ideal for local or national housing projects.
-
🕒 Time-Saving: No manual analysis — everything auto-updates.
🌍 Who Can Use It
🏛️ Government Agencies – Monitor urban development projects and housing schemes.
🏢 Real Estate Developers – Track multi-city construction and budget performance.
🏙️ Municipal Corporations – Manage public infrastructure and facilities.
📊 Consulting Firms – Analyze and report city development KPIs for clients.
🧩 Best Practices
-
Maintain data consistency and units.
-
Apply conditional formatting for overruns.
-
Refresh monthly or quarterly.
-
Use data validation for clean entries.
-
Protect formulas to avoid accidental changes.
🔗 Click here to read the Detailed blog post
📺 Visit our YouTube channel for a step-by-step tutorial
👉 YouTube.com/@PKAnExcelExpert


Reviews
There are no reviews yet.