Managing home healthcare operations requires accuracy, speed, and clear visibility. With growing patient needs, daily visits, staff coordination, treatment planning, and compliance requirements, manual reporting often leads to confusion, delays, and errors. The Home Healthcare KPI Dashboard in Power BI solves these challenges with a clean, interactive, and ready-to-use reporting system designed especially for home care teams.
This powerful dashboard centralizes all key performance indicators—patient service metrics, home visit compliance, staff workload, satisfaction levels, and year-on-year improvements—into a single, easy-to-navigate platform. Built using a simple Excel data source, it requires zero technical skills to maintain, making it ideal for nurses, care coordinators, hospitals, clinics, and home healthcare agencies.
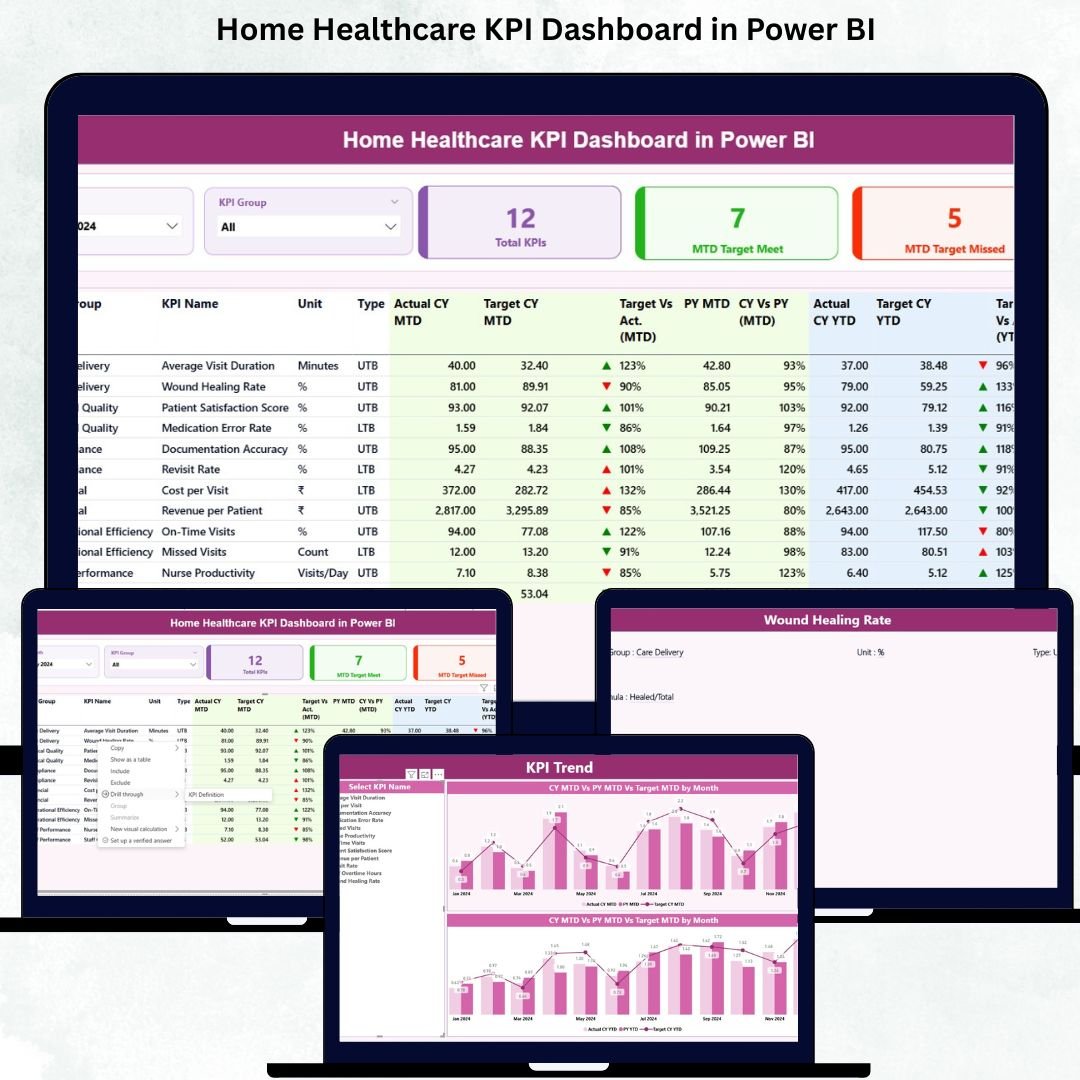
This product description will guide you through the dashboard’s features, benefits, key components, and how you can use it to transform your healthcare reporting.Home Healthcare KPI Dashboard in Power BI
✨ Key Features of the Home Healthcare KPI Dashboard in Power BI
The Home Healthcare KPI Dashboard includes three powerful pages, each designed to simplify decision-making and improve service quality.
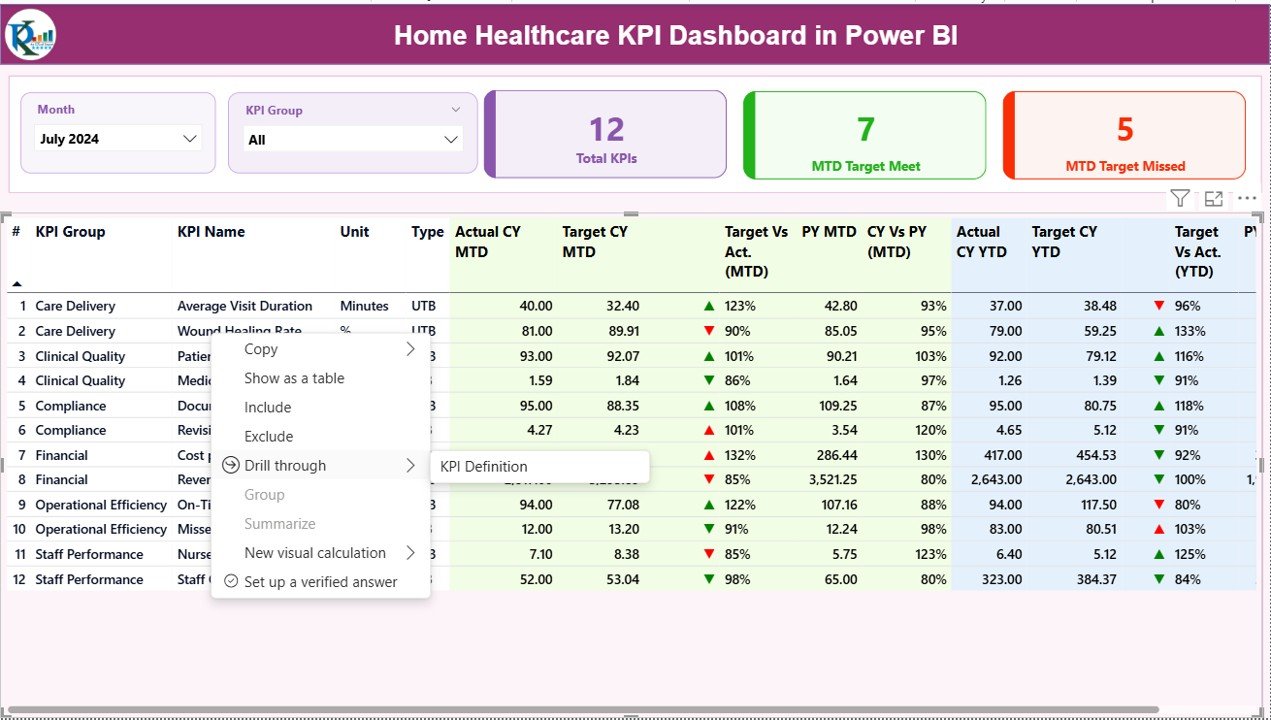
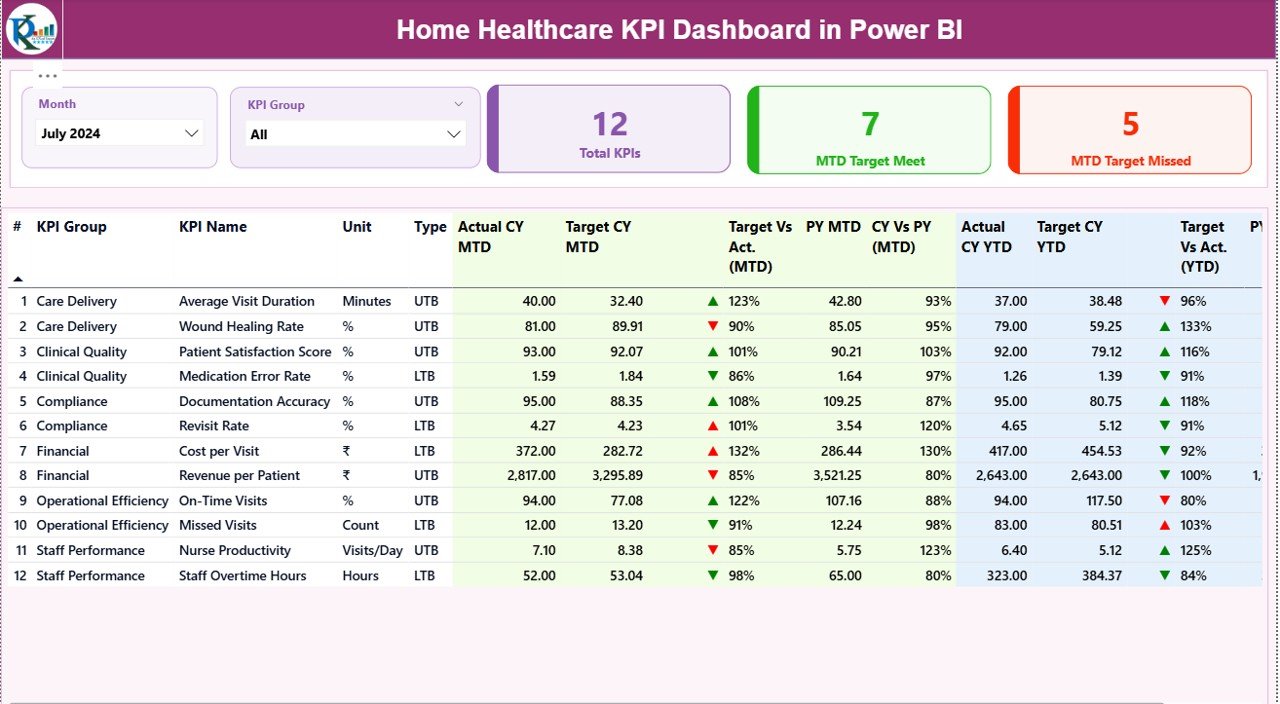
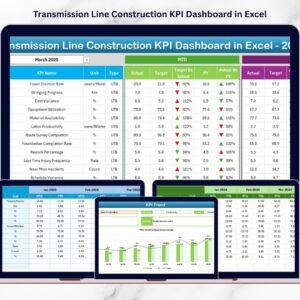
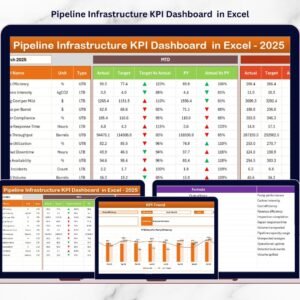
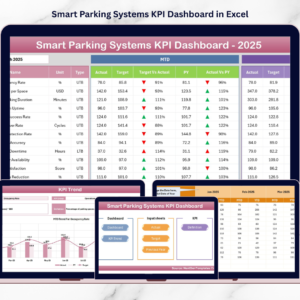
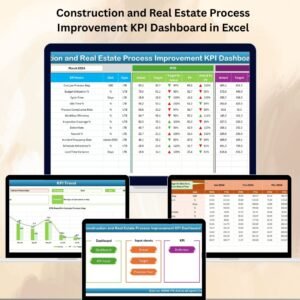
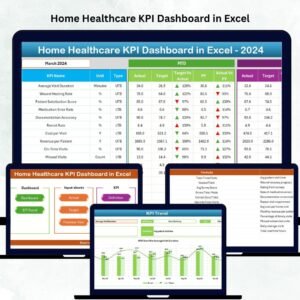
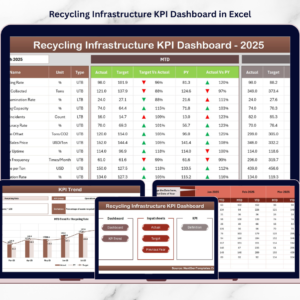
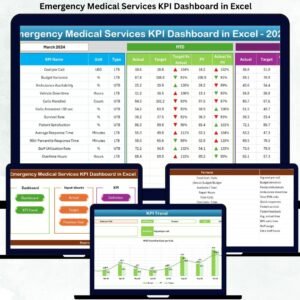
1️⃣ Summary Page – Instant Overview of Monthly & Yearly Performance
This is the main landing page of the dashboard. It includes:
-
Month & KPI Group slicers for quick filtering
-
KPI cards showing:
-
Total KPIs Count
-
MTD Target Met
-
MTD Target Missed
-
-
Comprehensive KPI Table showing:
-
KPI Group, Name, Unit & Type
-
MTD Actual vs Target
-
YTD Actual vs Target
-
Previous Year comparisons
-
Condition-based icons (▲▼ with colors) for performance clarity
-
This page helps teams instantly understand whether operations are on track.
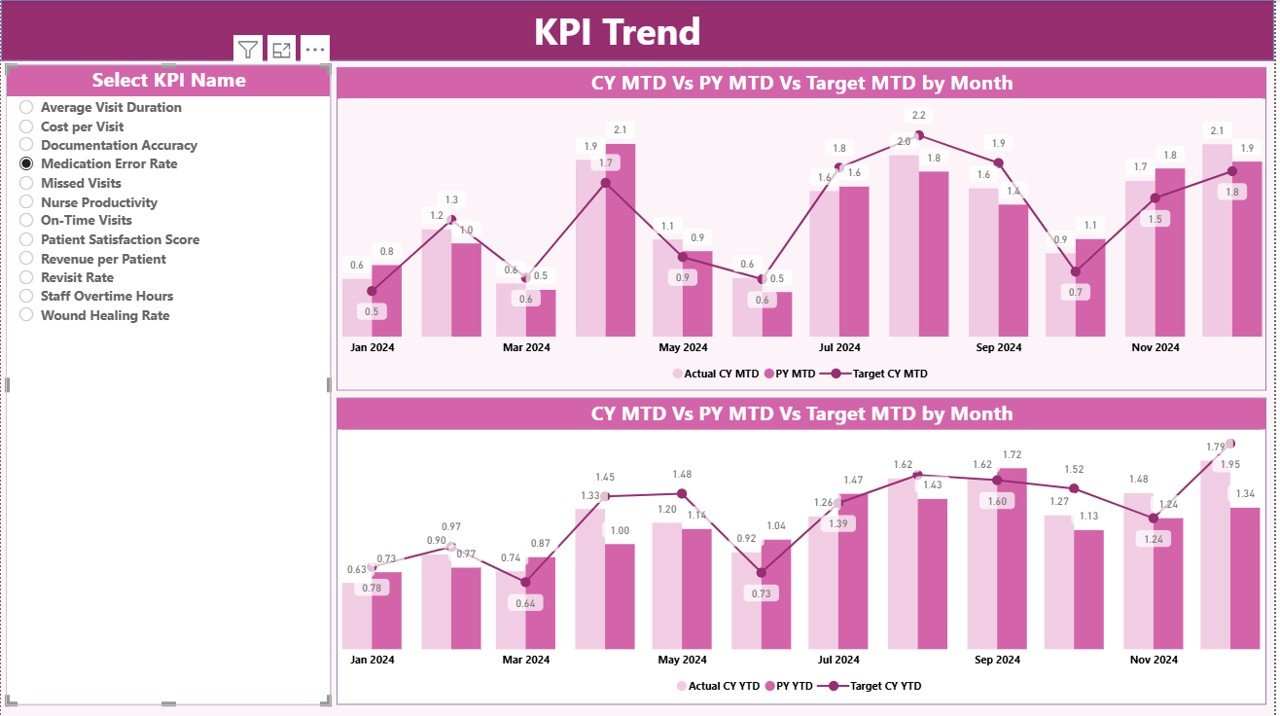
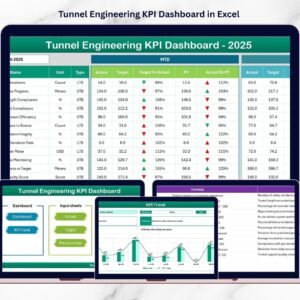
2️⃣ KPI Trend Page – Visualizing Performance Over Time 📈
This page includes two combo charts:
-
MTD Trend Chart (Current Year Actual, Target, PY Actual)
-
YTD Trend Chart (Current Year Actual, Target, PY Actual)
With the KPI Name slicer, users can quickly study long-term patterns and improvement areas.
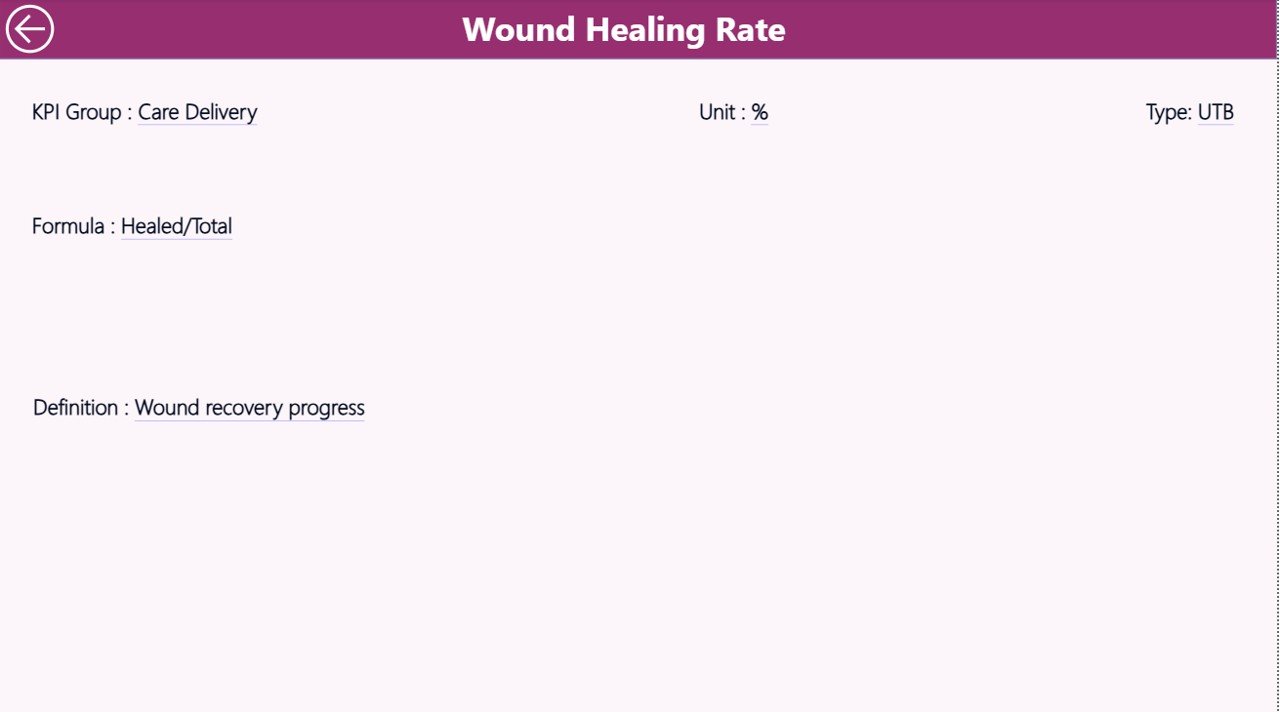
3️⃣ KPI Definition Page – Understand KPIs Clearly 🔍
A hidden drill-through page that shows:
-
KPI Unit
-
KPI Formula
-
Type (UTB or LTB)
-
Definition
Just right-click any KPI on the Summary Page → Drill Through → KPI Definition.Home Healthcare KPI Dashboard in Power BI
📦 What’s Inside the Home Healthcare KPI Dashboard
This digital product includes everything you need to track operations smoothly:
✔ Power BI Desktop File (.pbix)
Fully built dashboard with:
-
Summary
-
KPI Trend
-
KPI Definition (drill-through)
✔ Excel Data File (.xlsx)
Includes these 3 sheets:
-
Input_Actual – MTD & YTD actual values
-
Input_Target – MTD & YTD targets
-
KPI Definition – KPI Number, Group, Name, Unit, Formula & TypeHome Healthcare KPI Dashboard in Power BI
✔ Ready-to-use Visuals
Combo charts, cards, conditional formatting arrows, slicers, and structured KPI tables.
✔ Clean Navigation & User-Friendly Layout
Optimized for easy filtering and quick insights.
🛠 How to Use the Home Healthcare KPI Dashboard
Using this dashboard is effortless—even for beginners.
Step 1: Update Excel File
Fill three sheets:
-
KPI Definition
-
Actual Data
-
Target Data
Step 2: Refresh Power BI
Press Refresh and all visuals update instantly.
Step 3: Navigate Between Pages
Use slicers → View KPI definitions → Analyze trends.
Step 4: Review Monthly & Yearly Performance
Compare current values with targets and previous year numbers.
Step 5: Share the Dashboard
Export PDF or share via Power BI for team reporting.
No coding, no DAX formulas, no complexity. Just plug in the data and start analyzing.
👥 Who Can Benefit from This Home Healthcare Dashboard?
This dashboard is designed for all types of healthcare teams, including:
🏥 Home Healthcare Agencies
Track patient visits, scheduling efficiency, and care delivery in real-time.
👩⚕ Nurses & Field Staff
Monitor workload, efficiency, and visit completion rates.
🏨 Hospitals & Clinics
Improve patient satisfaction and treatment outcomes.
📊 Healthcare Administrators & Coordinators
Monitor KPIs, identify performance gaps, and support faster decision-making.
🚀 Healthcare Startups
Use structured reporting to scale operations smoothly.
If your organization deals with home visits, compliance, patient care, and performance monitoring—this dashboard is a must-have tool.
### Click here to read the Detailed blog post
### Visit our YouTube channel to learn step-by-step video tutorials


Reviews
There are no reviews yet.