Running a successful home décor store is no longer just about beautiful designs and attractive product displays. In today’s competitive retail market, store owners must closely monitor sales performance, margins, operational efficiency, and growth trends. However, when data is spread across Excel files, emails, and manual reports, decision-making becomes slow and unclear.
That is exactly why the Home Decor Stores KPI Dashboard in Power BI becomes a powerful, data-driven solution for modern retail management.
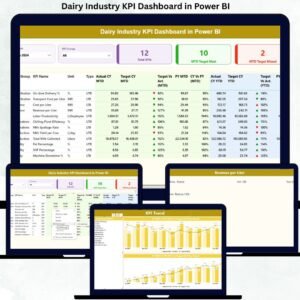
This ready-to-use Power BI dashboard helps home décor store owners and retail managers track, analyze, and compare key performance indicators (KPIs) from one centralized, interactive report. Instead of guessing what is working and what is not, decision-makers gain clear visibility into performance using professional visuals, comparisons, and trends.
Most importantly, this dashboard connects easily with Excel data, making it simple to maintain, scalable, and cost-effective for both small and large home décor businesses.
📊 Key Features of Home Decor Stores KPI Dashboard in Power BI
📈 MTD & YTD Performance Tracking
Track Month-to-Date and Year-to-Date KPIs clearly in one view.
🎯 Target vs Actual Comparison
Instantly identify which KPIs meet targets and which fall behind.
🔄 Current Year vs Previous Year Analysis
Measure growth, decline, and seasonality accurately.
🚦 Visual Performance Indicators
Green and red arrows make KPI status easy to understand.
🧠 Interactive Filters & Slicers
Analyze performance by month and KPI group instantly.
🧩 Excel-Driven Data Model
Update data in Excel and refresh Power BI—no complexity.
📦 What’s Inside the Home Decor Stores KPI Dashboard in Power BI?
This dashboard includes three professionally structured pages, designed for clarity and business impact.
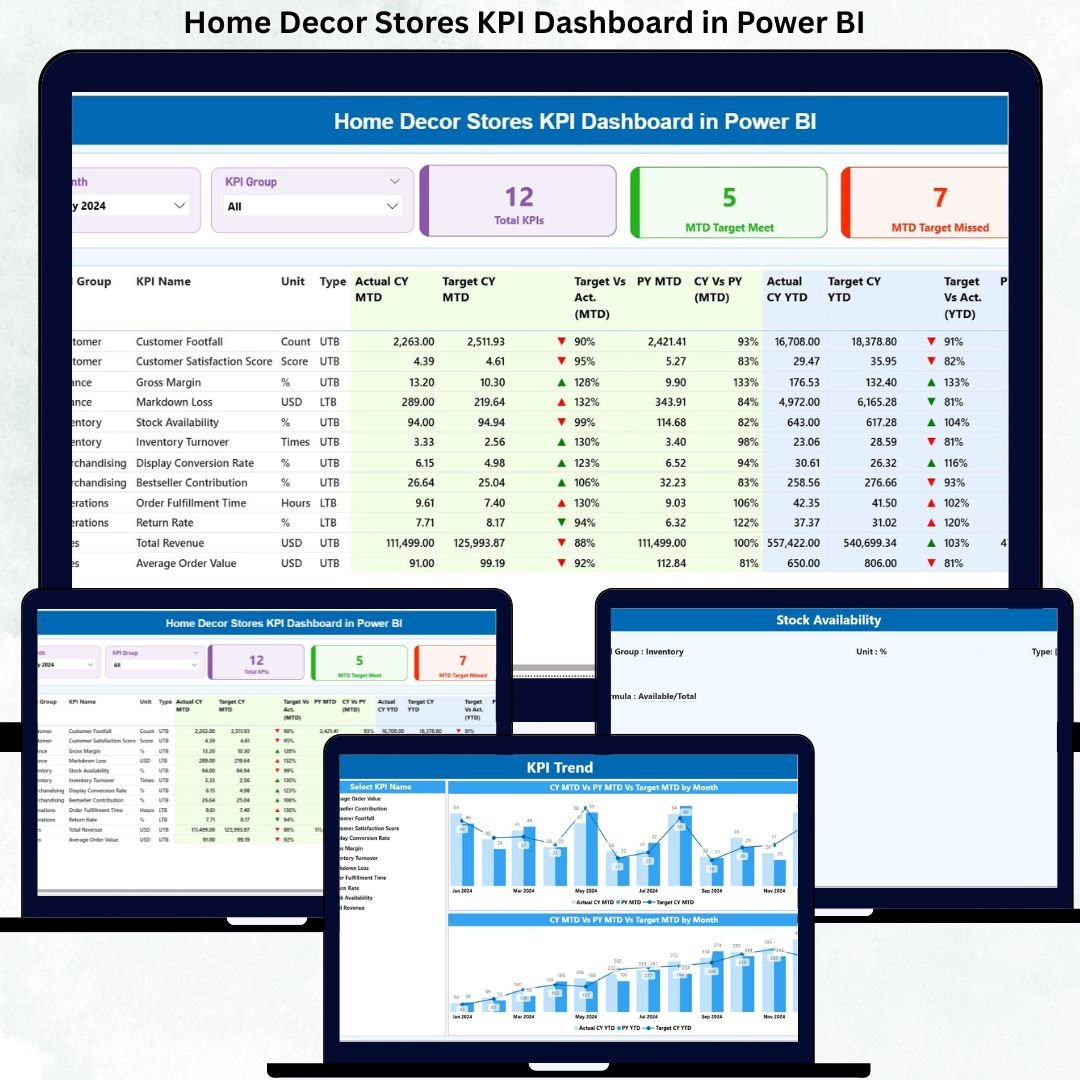
🧾 1. Summary Page – Complete Performance Snapshot
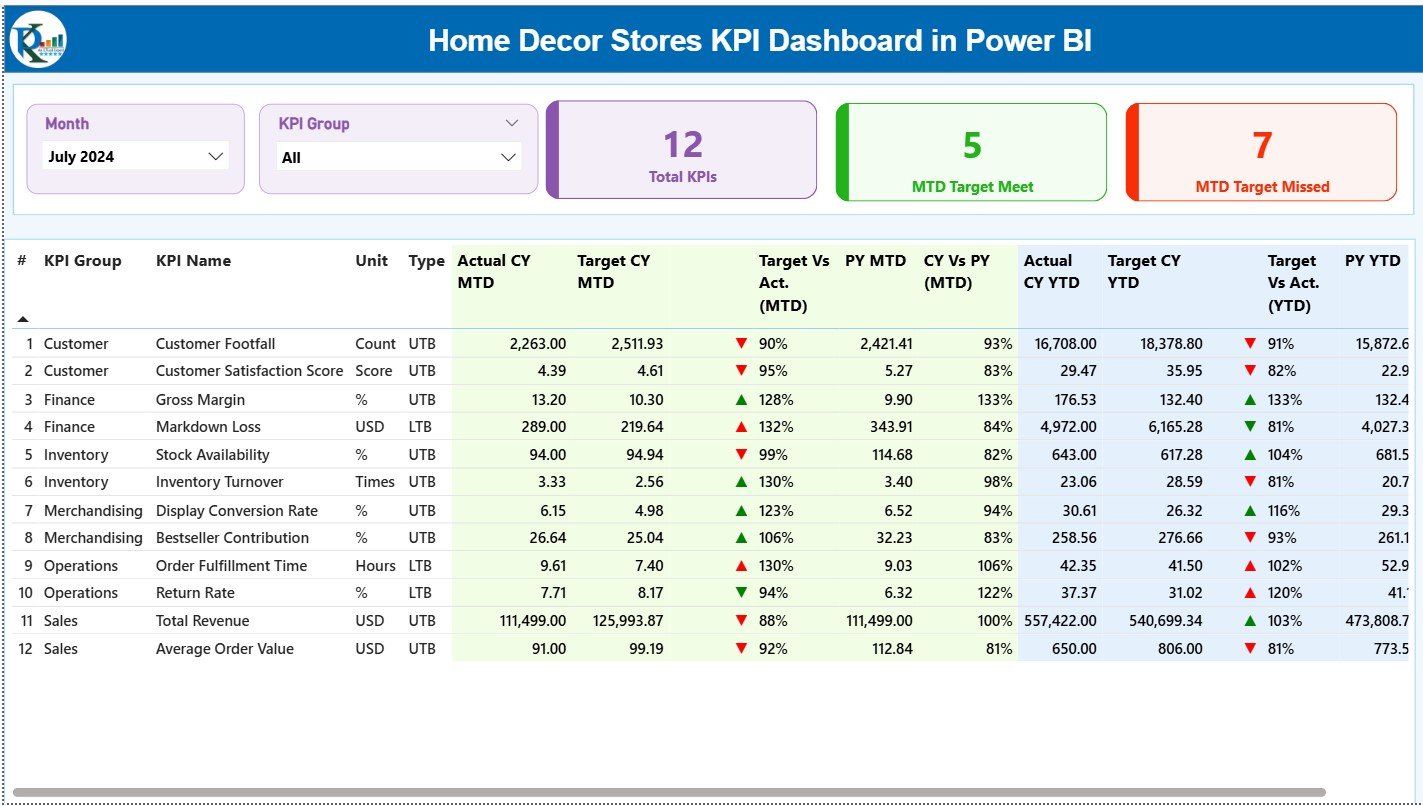
The Summary Page acts as the main control center.
Top Slicers
-
📅 Month Slicer
-
📊 KPI Group Slicer
KPI Cards
-
🔢 Total KPIs Count
-
✅ MTD Target Met Count
-
❌ MTD Target Missed Count
Detailed KPI Table Includes
-
KPI Number
-
KPI Group
-
KPI Name
-
Unit
-
KPI Type (LTB / UTB)
MTD Metrics
-
Actual CY MTD
-
Target CY MTD
-
▲ / ▼ Performance Icon
-
Target vs Actual %
-
PY MTD
-
CY vs PY %
YTD Metrics
-
Actual CY YTD
-
Target CY YTD
-
▲ / ▼ Performance Icon
-
Target vs Actual %
-
PY YTD
-
CY vs PY %
This page allows managers to spot performance gaps instantly.
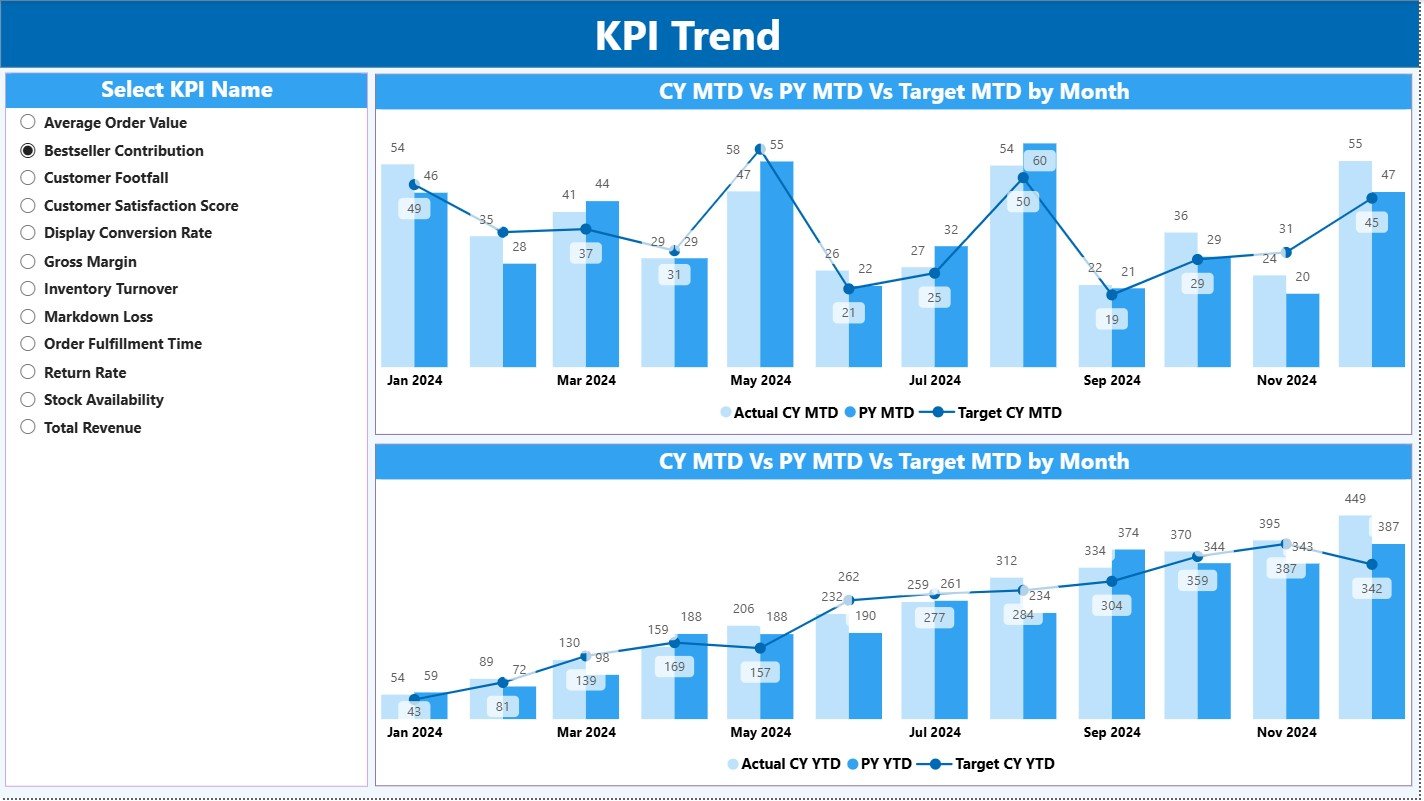
📉 2. KPI Trend Page – Performance Over Time
The KPI Trend Page focuses on trend-based insights.
Key Elements
-
🎯 KPI Name slicer
-
📈 MTD Trend Combo Chart
-
📊 YTD Trend Combo Chart
Each chart compares:
-
Current Year Actual
-
Previous Year Actual
-
Target
This page helps identify seasonal demand, growth momentum, and declining KPIs before they become serious issues.
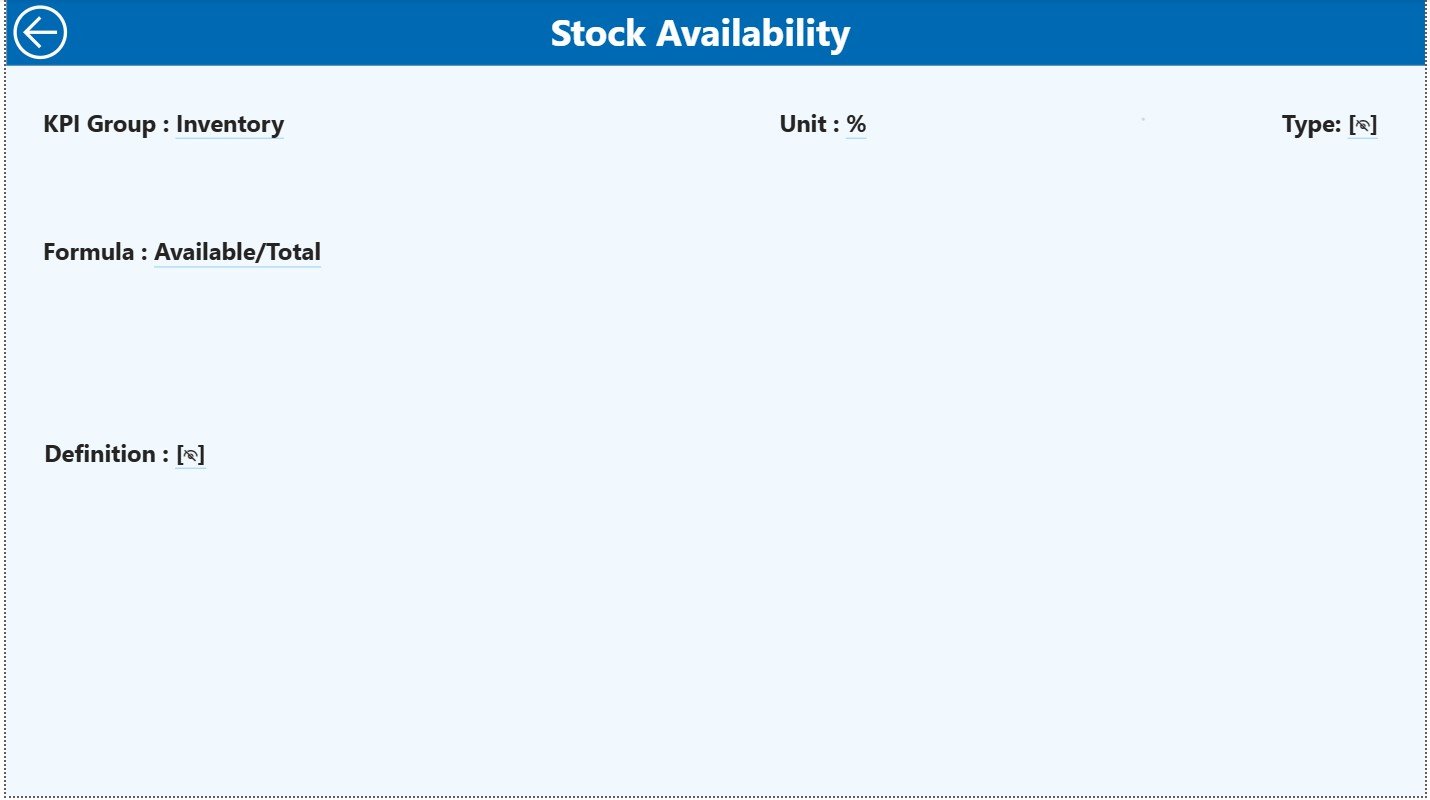
📘 3. KPI Definition Page – Complete KPI Clarity
The KPI Definition Page ensures transparency and standard understanding.
Details Displayed
-
KPI Formula
-
KPI Definition
-
KPI Unit
-
KPI Type (LTB / UTB)
This drill-through page prevents misinterpretation and keeps all stakeholders aligned.
⚙️ How to Use the Home Decor Stores KPI Dashboard in Power BI
1️⃣ Update Actual KPI data in the Excel file
2️⃣ Enter Target KPI values in Excel
3️⃣ Maintain KPI logic in the KPI Definition sheet
4️⃣ Refresh the Power BI dashboard
5️⃣ Analyze performance using slicers and visuals
No advanced Power BI skills required.
👥 Who Can Benefit from This Dashboard?
✔ Home décor store owners
✔ Retail managers
✔ Sales & operations teams
✔ Regional heads
✔ Business analysts
✔ Retail consultants
Ideal for single-store and multi-store operations.
🌟 Advantages of Home Decor Stores KPI Dashboard in Power BI
✔ Centralized KPI monitoring
✔ Faster, data-driven decisions
✔ Clear target tracking
✔ Easy Excel-based data updates
✔ Professional Power BI visuals
✔ Scalable and customizable structure
Conclusion
The Home Decor Stores KPI Dashboard in Power BI transforms raw store data into clear, actionable business insights. It replaces manual reporting with automation, improves accountability, and empowers managers to act confidently.
If you want clarity, control, and growth in your home décor retail business, this dashboard becomes an essential management tool.


Reviews
There are no reviews yet.