Home décor retail is fast-moving, trend-driven, and highly competitive. Store owners and managers must track sales performance, profit margins, operating costs, customer satisfaction, and promotional effectiveness—often across multiple regions and product categories. However, when this information is spread across multiple spreadsheets, reports become slow, confusing, and difficult to trust. That is exactly why the Home Décor Stores Dashboard in Excel becomes an essential performance management and decision-support tool.
This ready-to-use Excel dashboard converts raw home décor retail data into a centralized, interactive, and visually intuitive reporting system. Instead of manually compiling reports, managers can instantly see which products drive profit, which promotions work, which regions perform best, and how customers perceive the brand. As a result, decisions become faster, smarter, and data-driven.
Because the dashboard is built entirely in Microsoft Excel, it remains easy to use, flexible, and cost-effective. You do not need advanced BI tools, coding skills, or complex integrations. Simply update the data, use slicers, and analyze performance in real time.
🔑 Key Features of Home Décor Stores Dashboard in Excel
🏡 Centralized Retail Performance View – Track sales, profit, costs, promotions, and customer satisfaction in one Excel dashboard.
📊 Visual KPI Cards & Charts – Instantly understand business health through clean, executive-ready visuals.
🎛️ Interactive Right-Side Slicers – Filter insights by region, product category, promotion type, or month in seconds.
📈 Multi-Dimensional Analysis – Analyze performance by category, region, promotion, and time.
⚡ Automated Excel Reporting – Eliminate repetitive manual reporting and reduce errors.
📂 What’s Inside the Home Décor Stores Dashboard in Excel
This professionally designed dashboard includes five structured analytical pages, supported by backend data sheets:
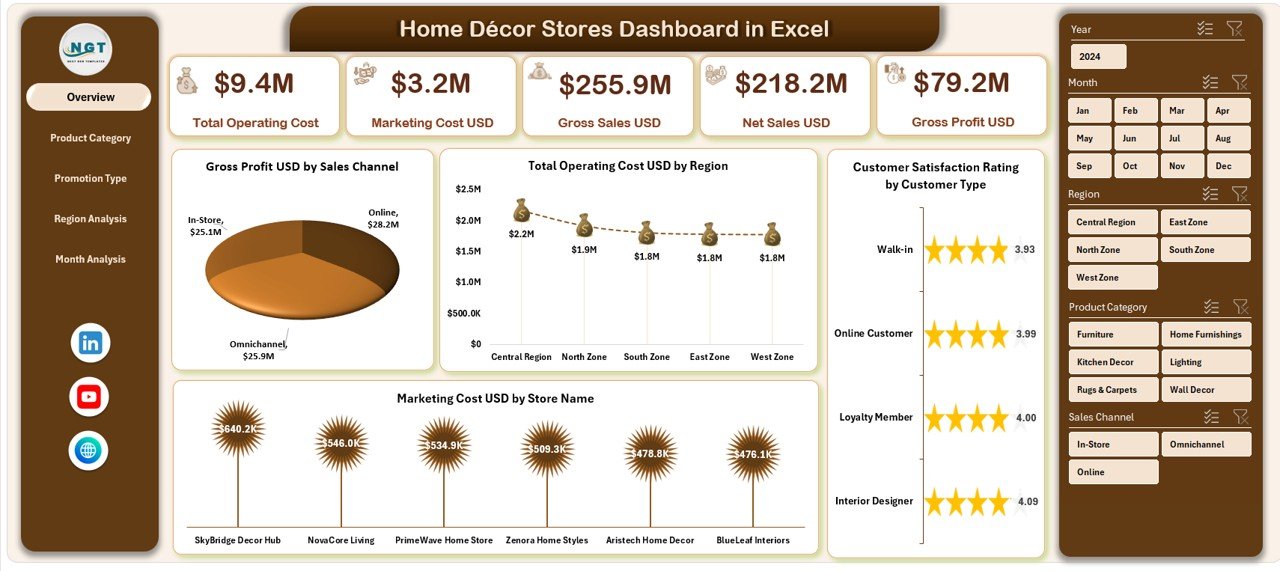
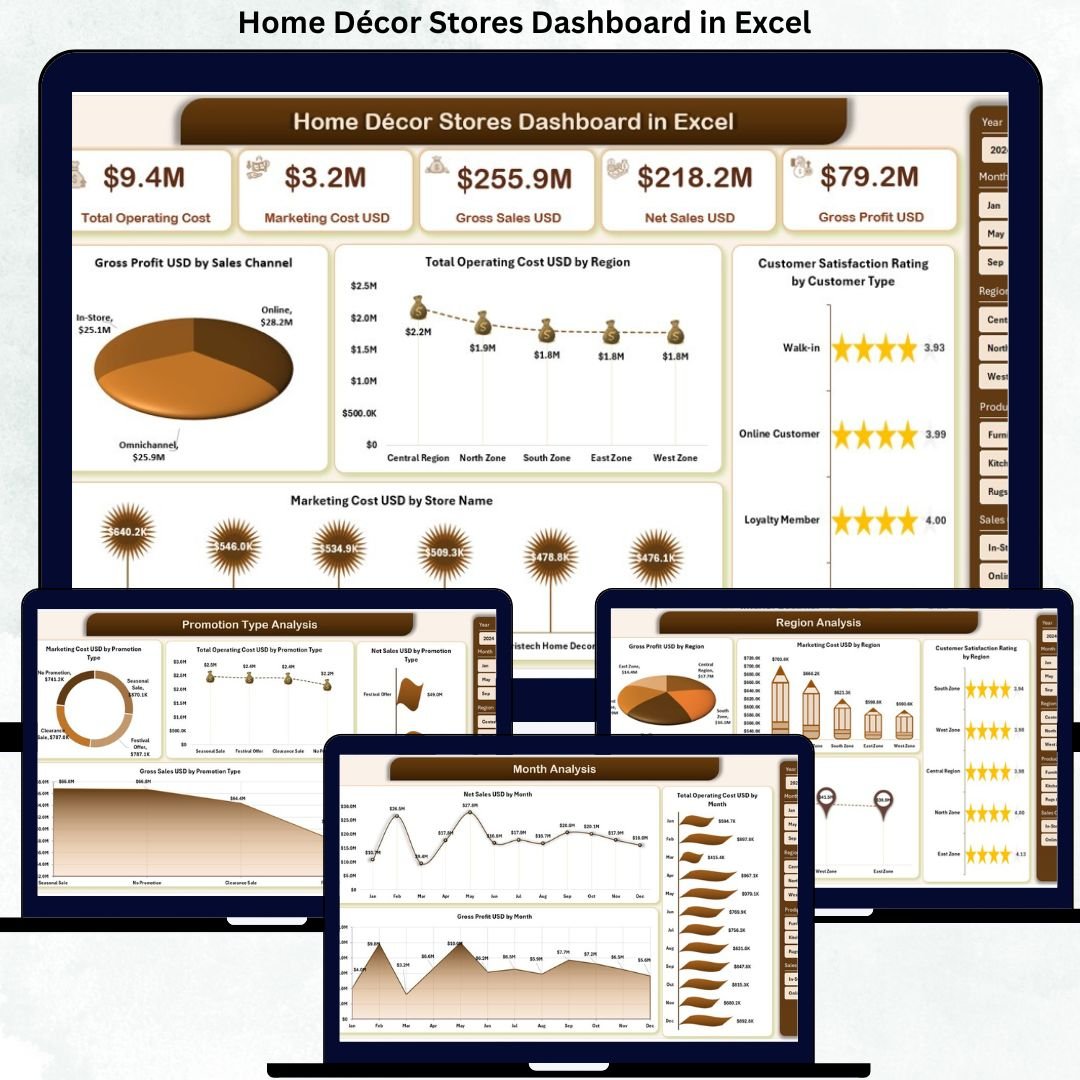
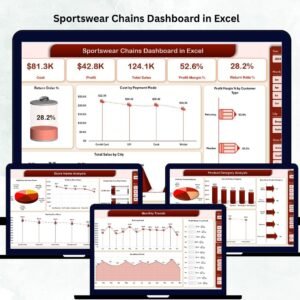
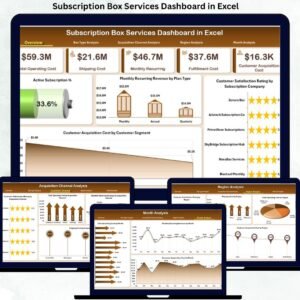
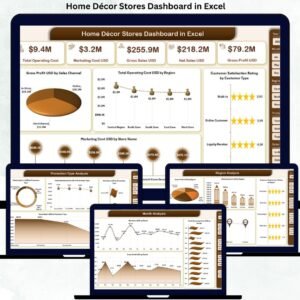
📊 Overview Page – A high-level snapshot showing Gross Profit by Sales Channel, Total Operating Cost by Region, Customer Satisfaction by Customer Type, and Marketing Cost by Store Name.
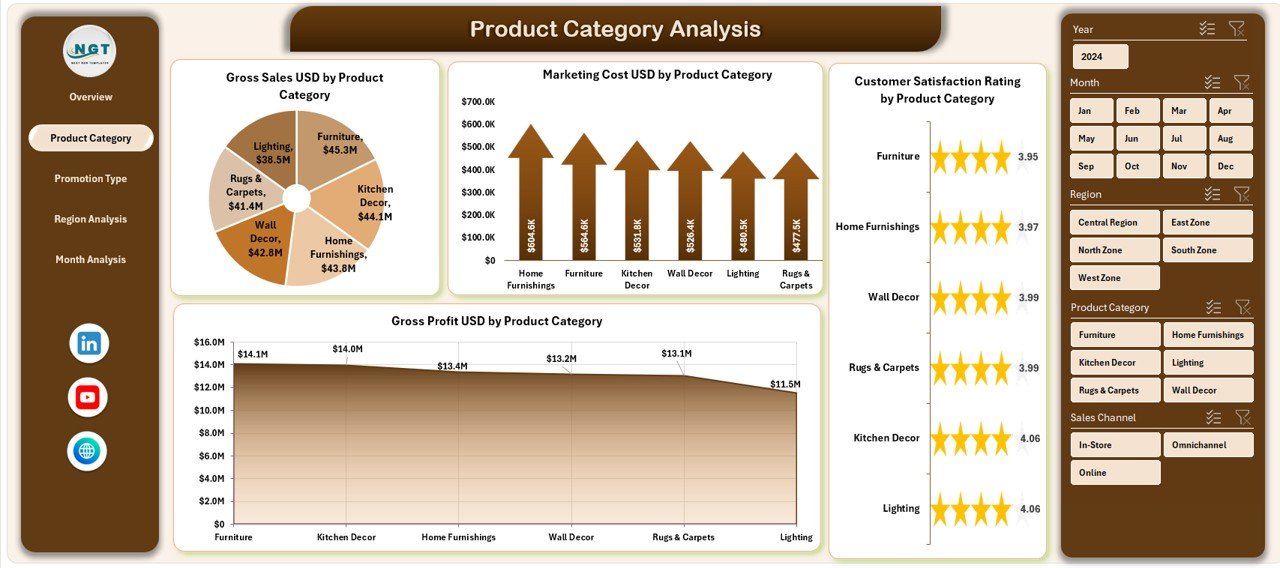
🛋️ Product Category Analysis Page – Evaluate Gross Profit, Marketing Cost, and Customer Satisfaction by Product Category to optimize product mix.
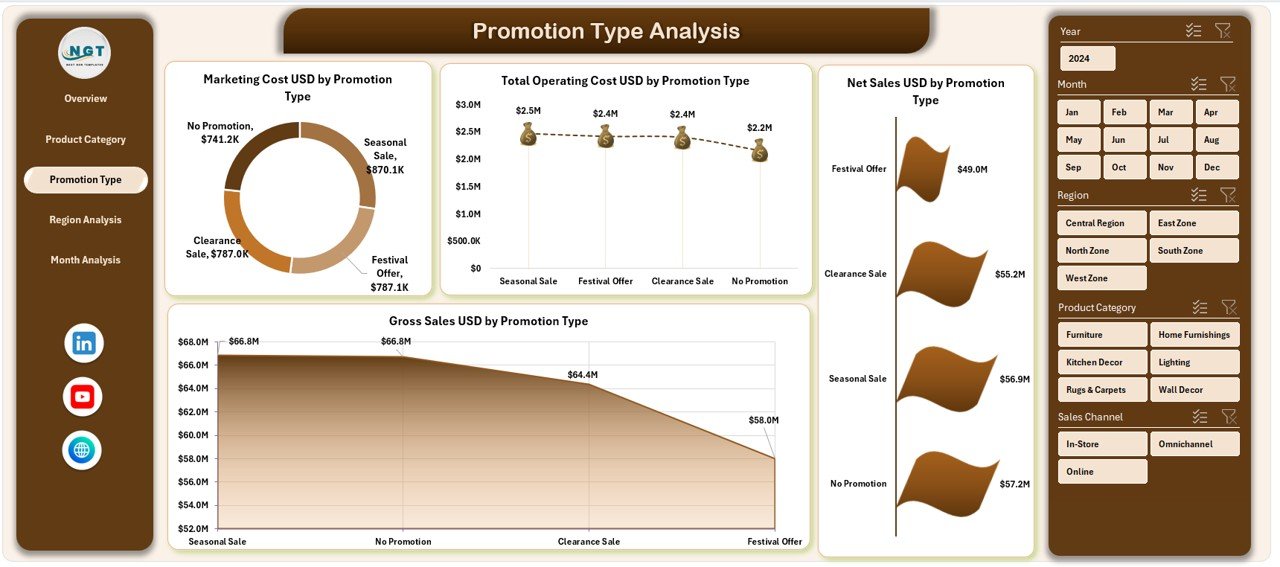
🎯 Promotion Type Analysis Page – Analyze Net Sales, Gross Profit, Marketing Cost, and Operating Cost by Promotion Type to identify high-ROI campaigns.
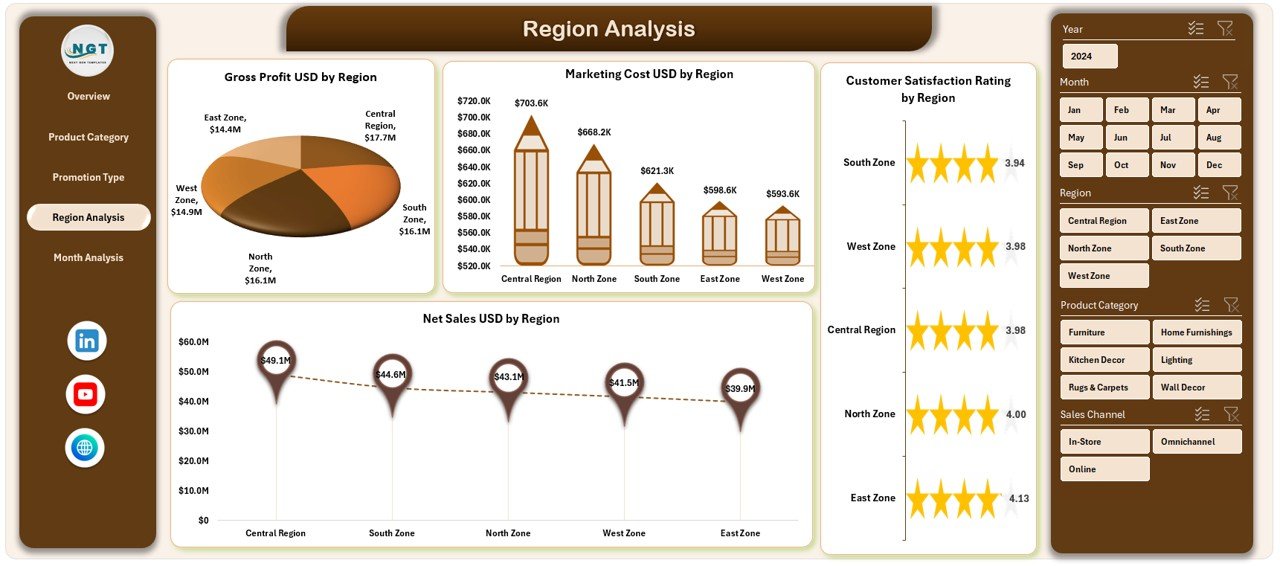
🌍 Region Analysis Page – Compare Gross Profit, Net Sales, Marketing Cost, and Customer Satisfaction across regions.
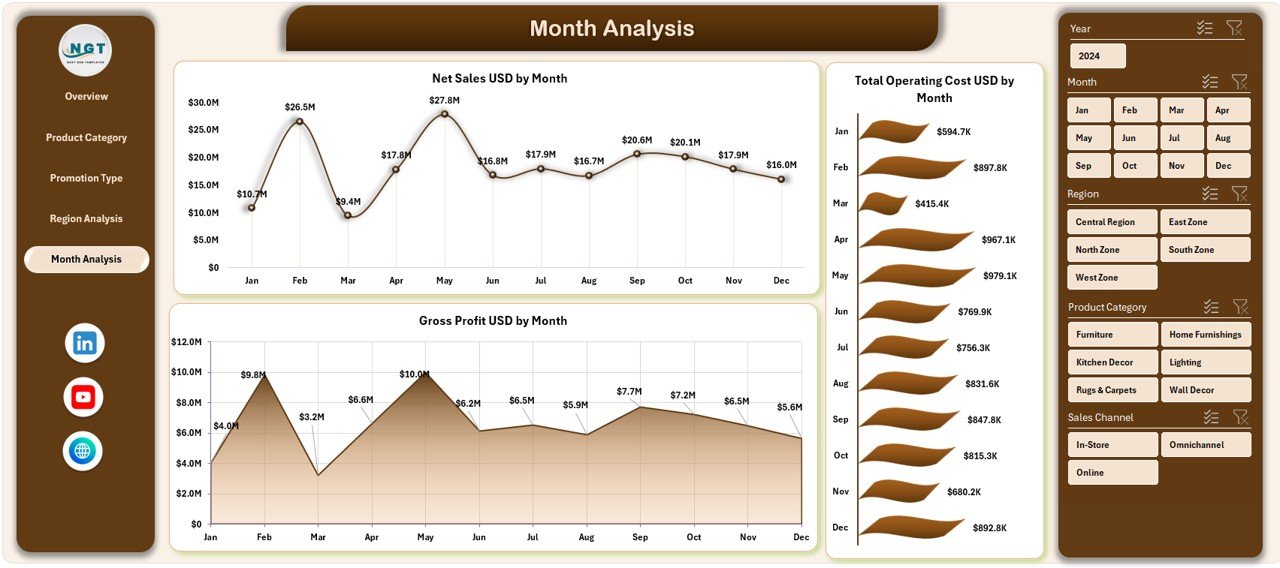
📅 Month Analysis Page – Track Net Sales, Total Operating Cost, and Gross Profit by Month to understand seasonality and trends.
📄 Data Sheet – Central place to enter or paste raw transactional retail data.
🛠 Support Sheet – Helper tables and calculations that power slicers and visuals.
Each page updates instantly when slicers are applied, allowing smooth movement from summary insights to deep analysis.
▶️ How to Use the Home Décor Stores Dashboard in Excel
Using this dashboard is simple and business-friendly:
1️⃣ Enter or paste retail data into the Data Sheet.
2️⃣ Let Excel process calculations automatically via the Support Sheet.
3️⃣ Navigate between pages using the page navigator.
4️⃣ Apply slicers to filter by region, category, promotion, or month.
5️⃣ Analyze KPIs and charts to take immediate action.
No advanced Excel skills are required—basic Excel knowledge is sufficient.
👥 Who Can Benefit from This Home Décor Stores Dashboard in Excel
This dashboard is ideal for:
🏡 Home Décor Store Owners
🧾 Retail & Store Managers
📢 Sales & Marketing Teams
💰 Finance & Operations Teams
🌍 Regional Managers
📊 Business Analysts
Each stakeholder gains clarity, control, and confidence in decision-making.
### 👉 Click here to read the Detailed Blog Post
Visit our YouTube channel to learn step-by-step video tutorials.


Reviews
There are no reviews yet.