Managing Health Insurance Dashboard operations without clear visibility often leads to delayed decisions, rising claim costs, and compliance risks. Health insurance companies handle policies, premiums, claims, hospitals, regions, and processing timelines every day. However, when this data remains scattered across Excel files or static reports, extracting meaningful insights becomes difficult.
That is exactly where the Health Insurance Dashboard in Power BI becomes a game-changing solution.
This ready-to-use Power BI dashboard transforms raw health insurance data into interactive KPIs, dynamic charts, and actionable insights. Instead of manually reviewing multiple reports, insurance teams can instantly monitor claim approvals, pending claims, premium trends, policy performance, regional behavior, and monthly patterns—all from one centralized dashboard.
Built using Power BI’s interactive visuals, slicers, and real-time analytics, this dashboard helps insurance companies move from reactive reporting to proactive, data-driven decision-making.
🔑 Key Features of Health Insurance Dashboard in Power BI
📊 5 structured analytical pages for complete insurance visibility
🎯 Interactive slicers for instant filtering
📈 Dynamic KPI cards & charts
⏱ Claim processing time tracking
🏥 Hospital-wise and policy-wise analysis
🌍 Region-level performance insights
📆 Month-wise trend monitoring
🔄 Automatic data refresh capability
📉 Cost and risk visibility in real time
This dashboard converts complex insurance datasets into decision-ready intelligence.
📂 What’s Inside the Health Insurance Dashboard in Power BI
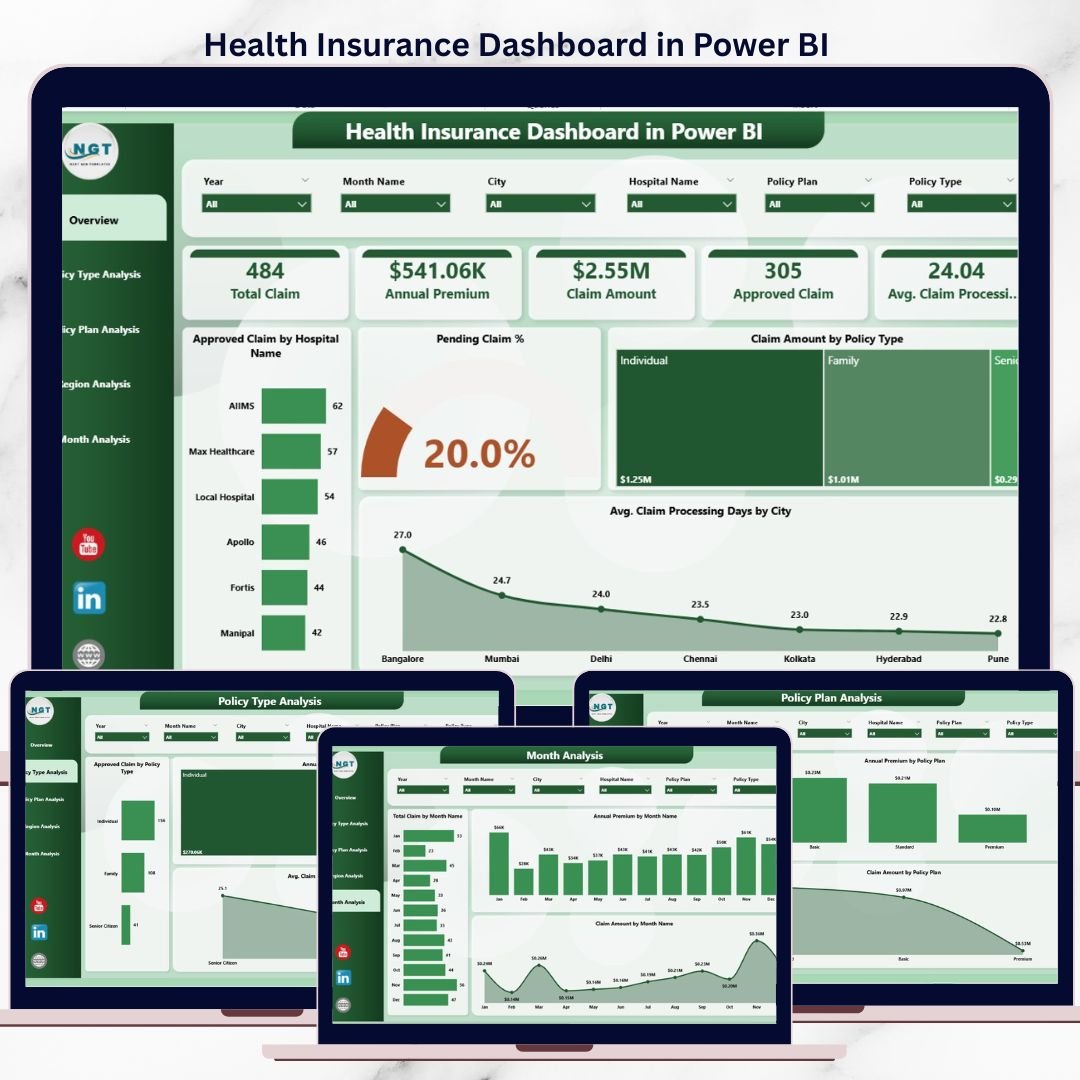
📊 Overview Page – Insurance Performance Snapshot
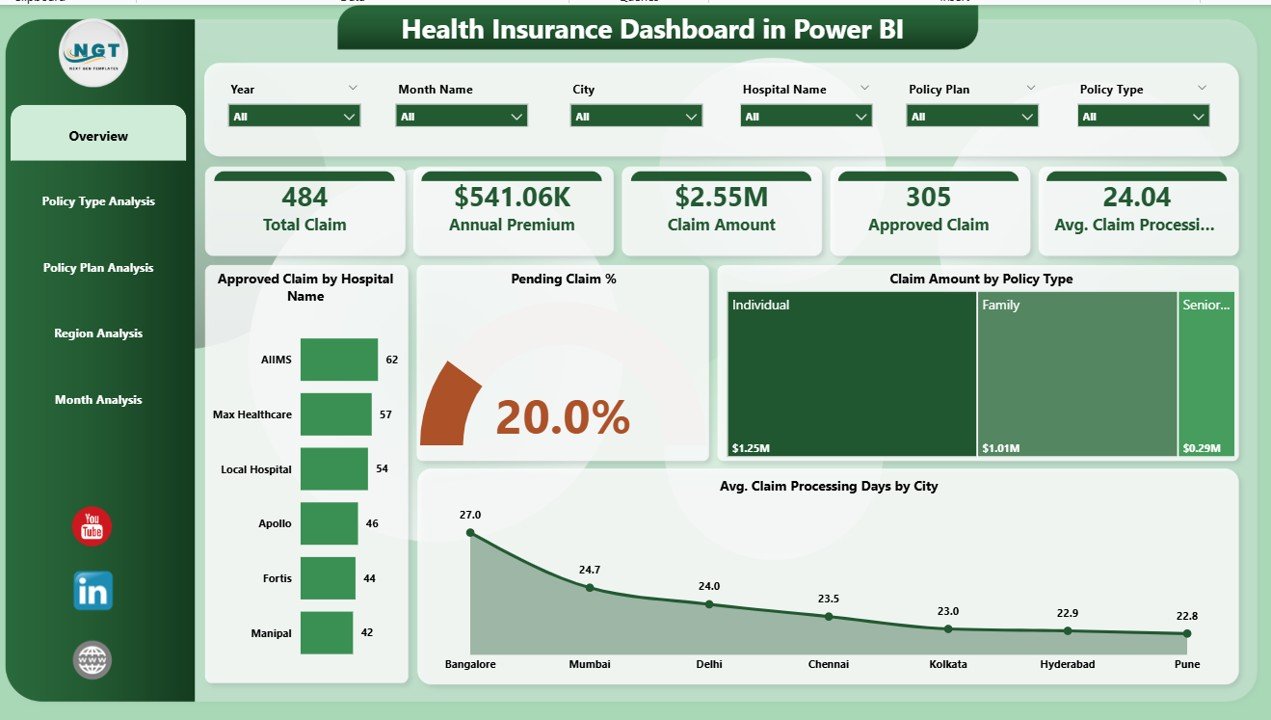
The Overview Page acts as the control center of the dashboard.
Key Insights Displayed:
-
Approved Claim by Hospital Name
-
Pending Claim Percentage
-
Claim Amount by Policy Type
-
Average Claim Processing Days by City
This page allows leadership to identify approval bottlenecks, cost drivers, and delay risks within seconds.
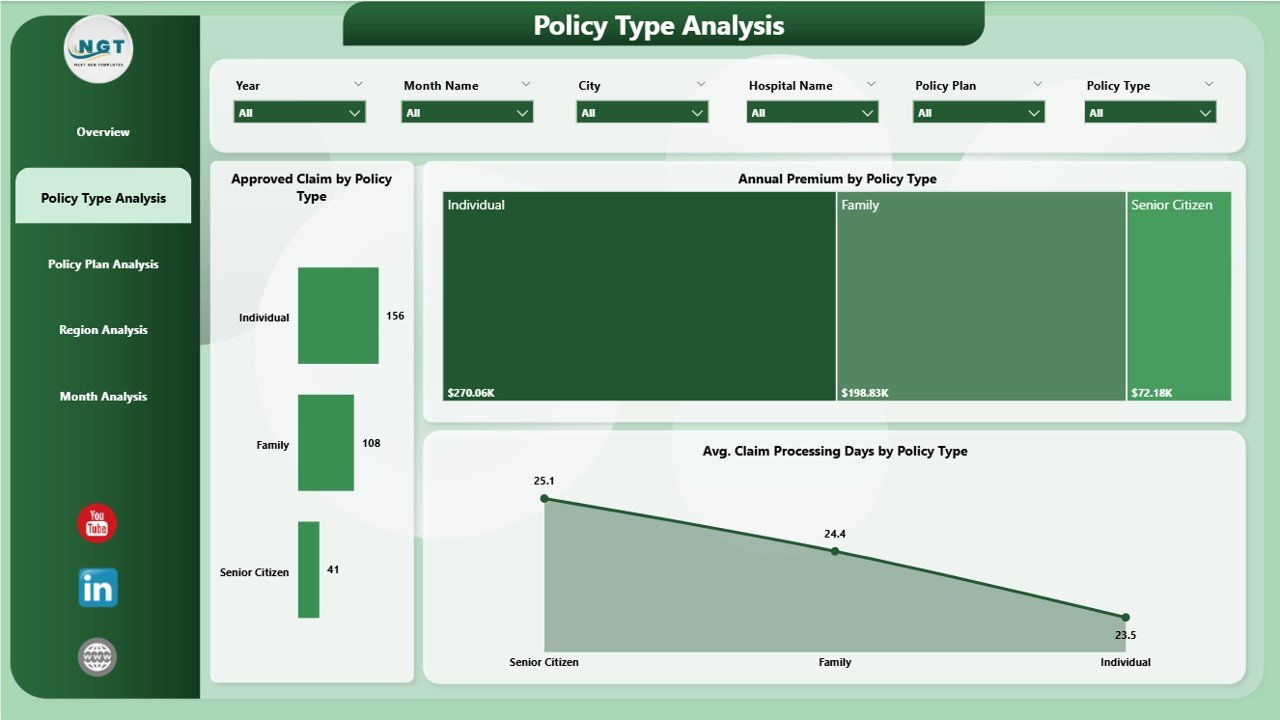
🧾 Policy Type Analysis Page
The Policy Type Analysis Page evaluates performance across different insurance policy categories.
Charts Included:
-
Approved Claim Cost by Policy Type
-
Average Claim Processing Days by Policy Type
-
Annual Premium by Policy Type
This analysis supports pricing strategy, underwriting decisions, and risk optimization.
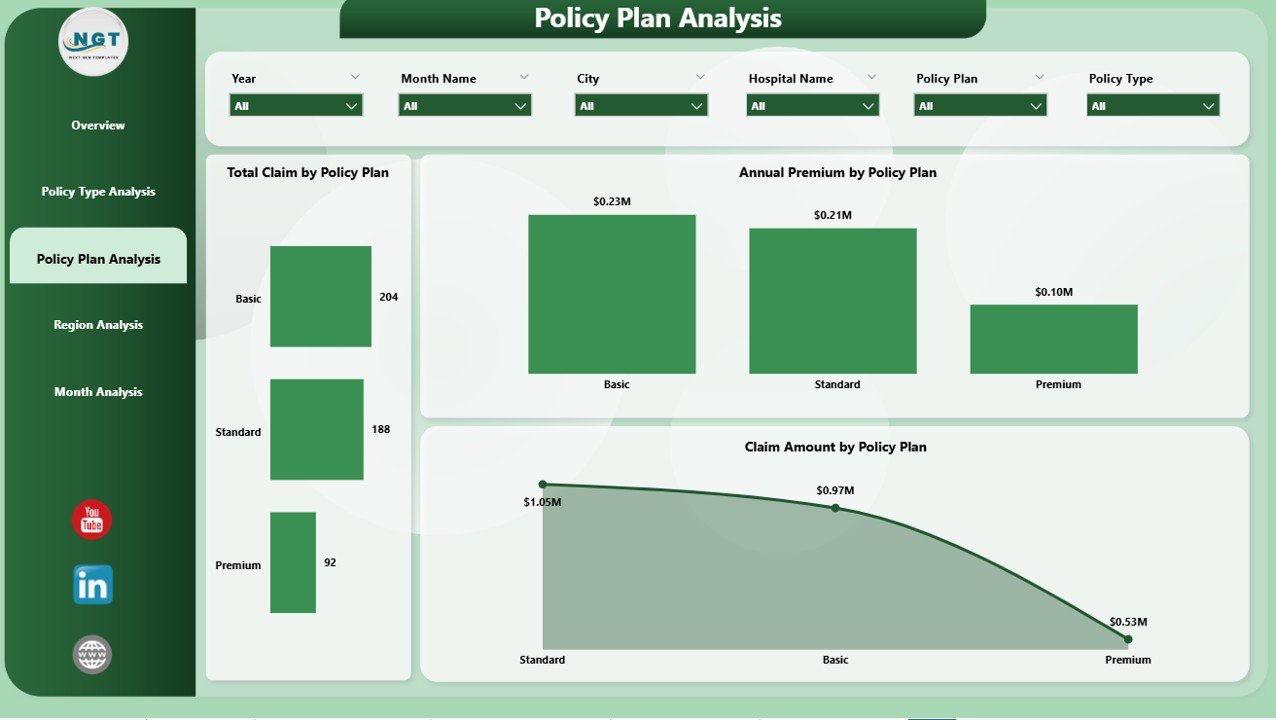
📑 Policy Plan Analysis Page
The Policy Plan Analysis Page provides deeper insights into individual policy plans.
Charts Available:
-
Total Claim by Policy Plan
-
Annual Premium by Policy Plan
-
Claim Amount by Policy Plan
Using this page, insurers can identify profitable and loss-making plans quickly.
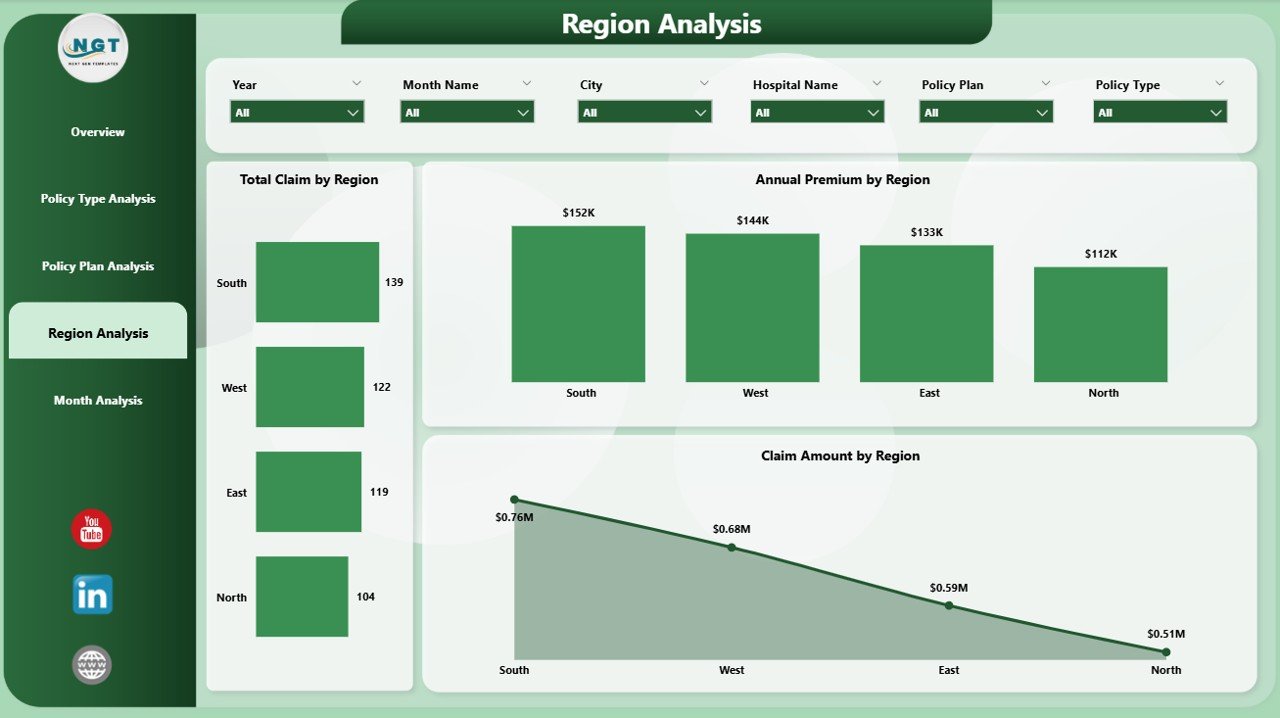
🌍 Region Analysis Page
The Region Analysis Page focuses on geographic performance.
Key Metrics:
-
Total Claim by Region
-
Annual Premium by Region
-
Claim Amount by Region
This page helps organizations optimize hospital networks and regional operations.
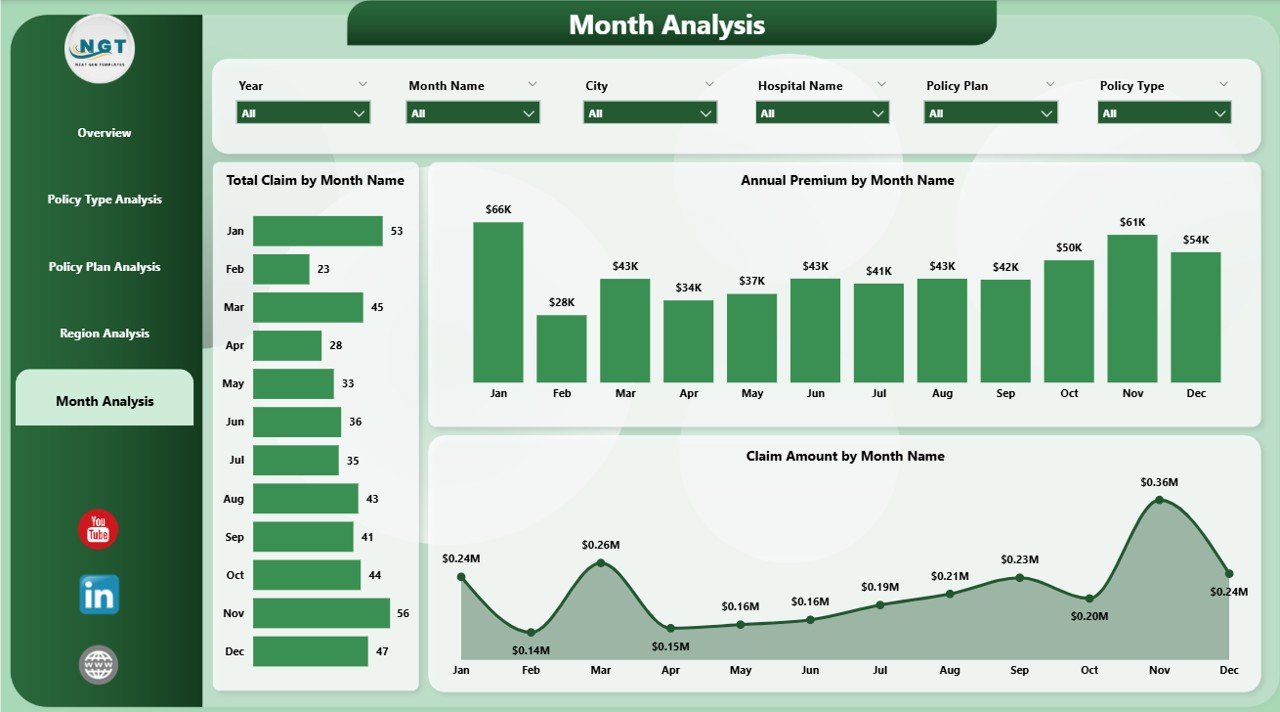
📆 Month Analysis Page
The Month Analysis Page highlights time-based trends and seasonality.
Charts Included:
-
Total Claim by Month
-
Annual Premium by Month
-
Claim Amount by Month
This analysis supports forecasting, budgeting, and workload planning.
🛠️ How to Use the Health Insurance Dashboard
✅ Connect Power BI to your insurance data source
✅ Refresh data automatically or on demand
✅ Use slicers to filter by policy, plan, region, or month
✅ Review KPIs and charts instantly
✅ Take faster, data-driven actions
No advanced Power BI skills are required for end users.
👥 Who Can Benefit from This Dashboard?
🏥 Health Insurance Companies
📊 Claims & Operations Teams
💰 Finance & Actuarial Teams
⚖ Risk & Compliance Managers
🏢 Third-Party Administrators (TPAs)
🧑💼 Senior Leadership & Executives
Suitable for small, mid-size, and large insurance organizations.
### 👉 Click here to read the Detailed blog post
▶️ Visit our YouTube channel to learn step-by-step video tutorials
https://youtube.com/@PKAnExcelExpert


Reviews
There are no reviews yet.