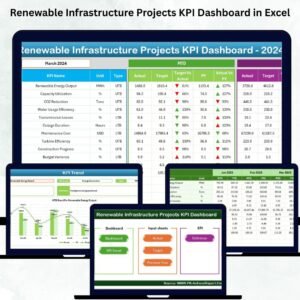
The renewable energy industry is evolving rapidly, and geothermal energy has become one of the most reliable and sustainable power sources available today. Unlike other renewable energy systems, geothermal plants operate continuously, providing stable electricity generation with minimal environmental impact. Geothermal Energy KPI Dashboard in Excel However, maintaining consistent performance requires accurate monitoring, structured reporting, and continuous performance evaluation.
Geothermal Energy KPI Dashboard in Excel Many geothermal facilities still depend on disconnected spreadsheets and manual reports. As a result, performance issues remain unnoticed, operational costs increase, and decision-making becomes slow. Without structured analytics, organizations struggle to optimize plant efficiency and track long-term sustainability goals.
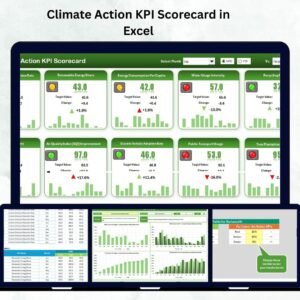
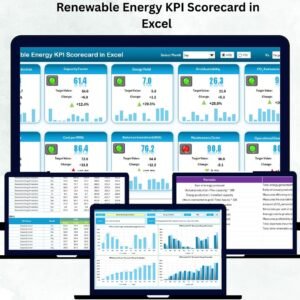
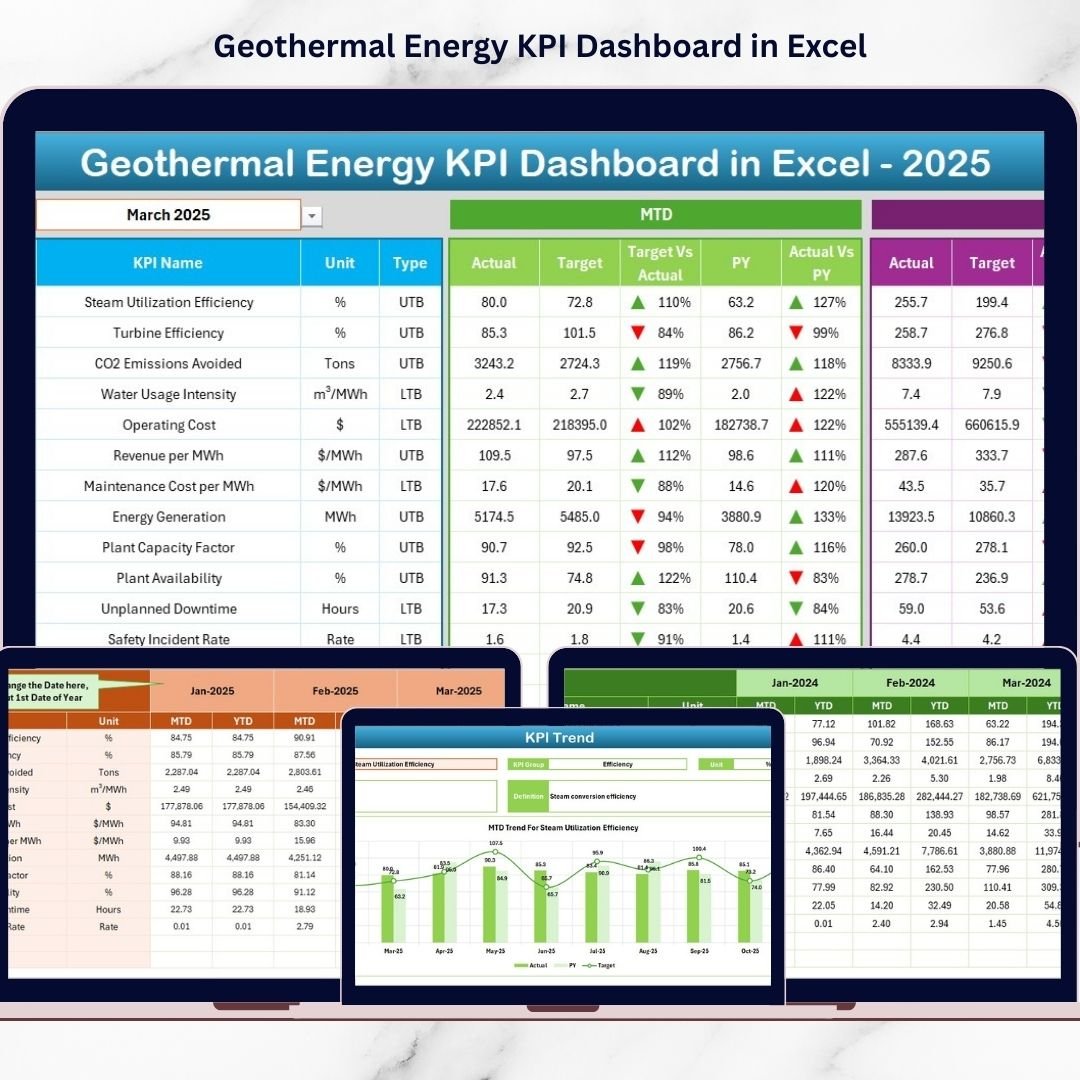
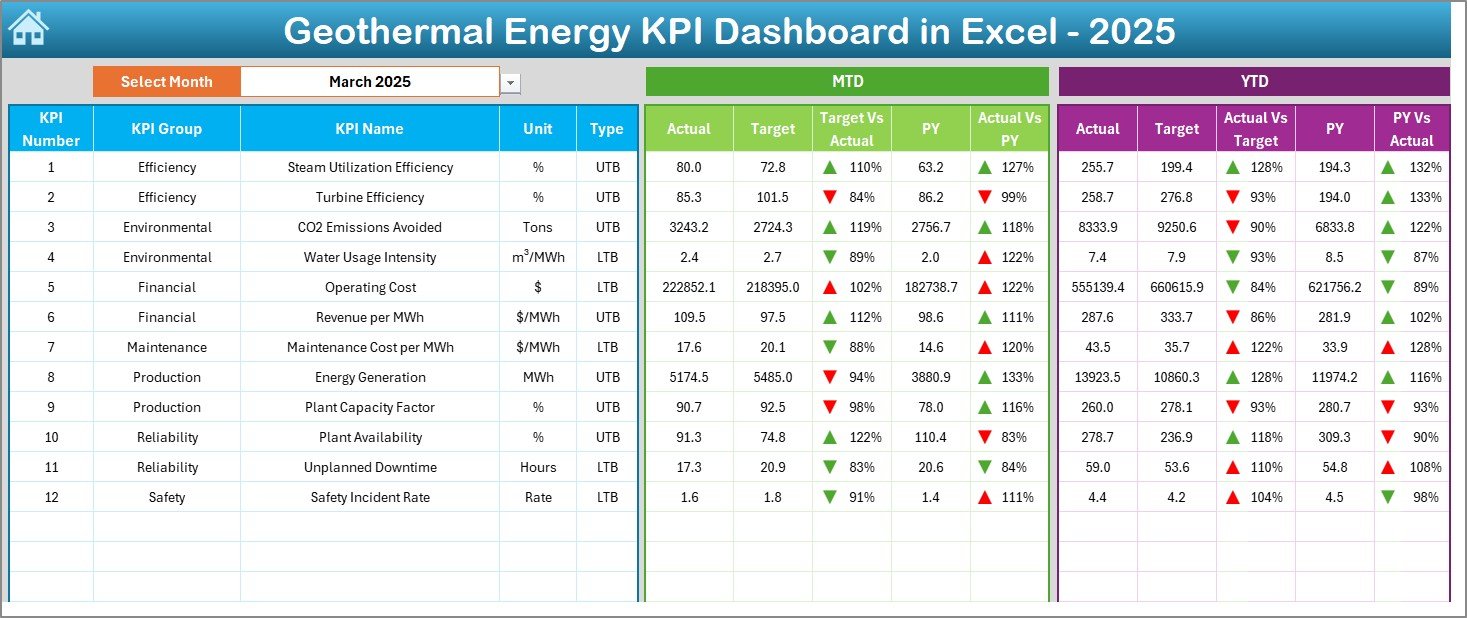
The Geothermal Energy KPI Dashboard in Excel is designed to solve these challenges by providing a centralized, ready-to-use performance monitoring system. This powerful Excel dashboard enables energy companies to track operational, financial, environmental, and maintenance KPIs in one interactive platform.
Instead of reviewing multiple reports, managers can monitor plant performance through a single dashboard interface. The template automatically compares Actual vs Target performance, evaluates Month-to-Date (MTD) and Year-to-Date (YTD) results, and analyzes trends against previous year performance. As a result, decision-makers quickly identify inefficiencies and take corrective actions faster.
Because the dashboard is built entirely in Microsoft Excel, organizations can deploy advanced analytics without investing in expensive business intelligence software. Its structured design ensures accurate reporting while remaining easy to use for both technical and non-technical users.
Whether managing geothermal production efficiency, monitoring sustainability goals, or improving operational reliability, this dashboard transforms raw energy data into meaningful insights that support smarter decisions and long-term performance improvement.
🚀 Key Feature of Geothermal Energy KPI Dashboard in Excel
⚡ Centralized KPI Monitoring – Track operational, financial, and environmental KPIs in one dashboard.
📊 MTD & YTD Performance Analysis – Monitor short-term and long-term results simultaneously.
🎯 Target vs Actual Comparison – Instantly identify performance gaps.
📈 Previous Year Benchmarking – Evaluate improvement using historical comparisons.
📉 Visual Performance Indicators – Up/down arrows highlight KPI trends instantly.
🧭 Easy Navigation Home Sheet – Jump between analysis pages quickly.
📝 Structured Data Input System – Reduce manual calculations and errors.
🔄 Automatic Dashboard Updates – Changing month selections refreshes analysis instantly.
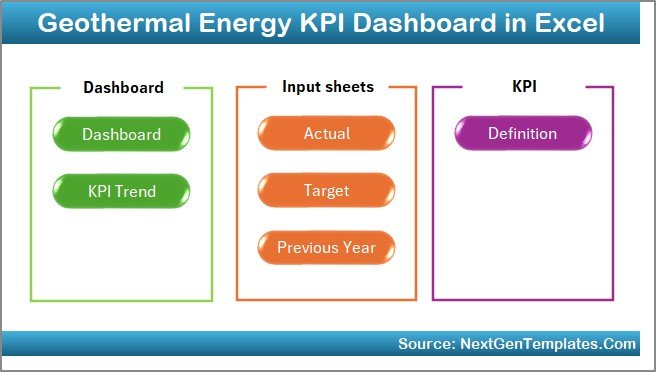
📦 What’s Inside the Geothermal Energy KPI Dashboard in Excel
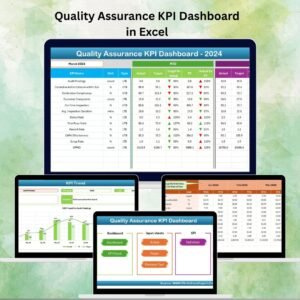
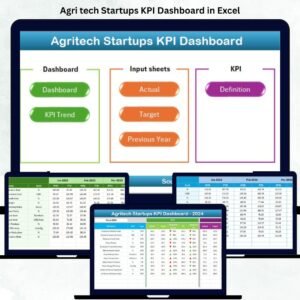
This professional dashboard includes 7 structured worksheets forming a complete performance management system.
🏠 Home Sheet – Navigation Center
Acts as an index page with quick navigation buttons for seamless workflow.
📊 Dashboard Sheet – Main Performance Overview
Displays:
-
MTD Actual, Target & Previous Year values
-
YTD performance comparisons
-
Target vs Actual indicators
-
Performance direction arrows
Managers understand plant performance within seconds.
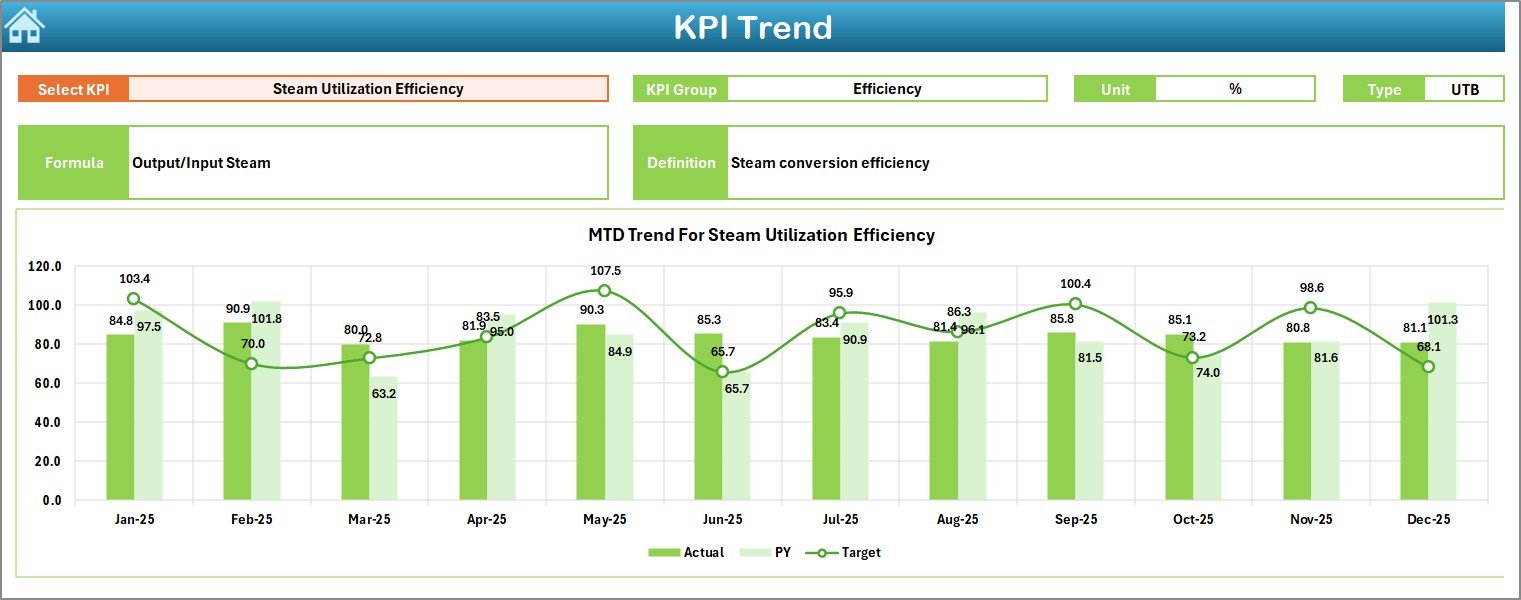
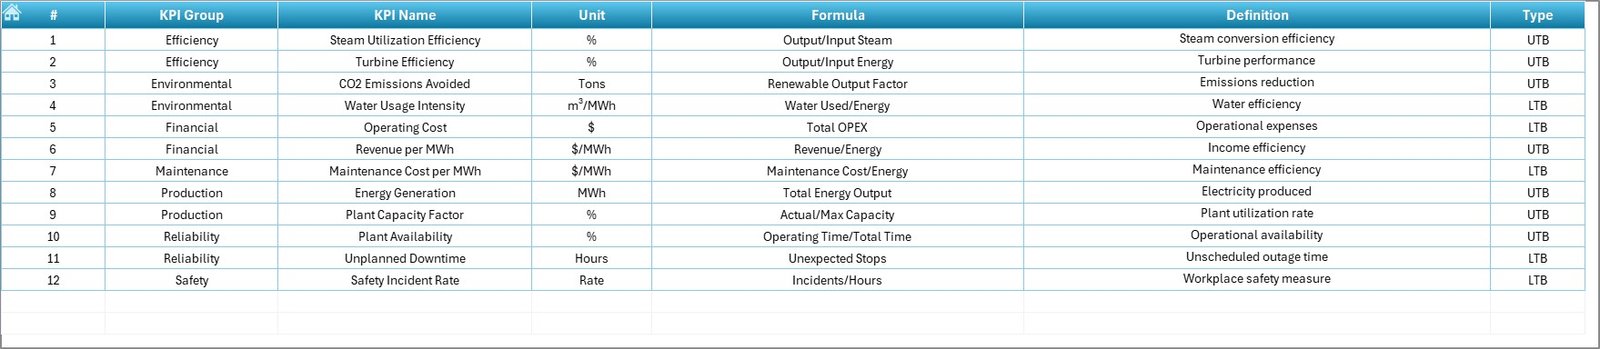
📈 KPI Trend Sheet – Performance Analysis
Allows deep KPI evaluation by selecting a KPI from dropdown:
-
KPI Group & Unit
-
KPI Formula & Definition
-
MTD & YTD trend charts
-
Actual vs Target vs Previous Year analysis
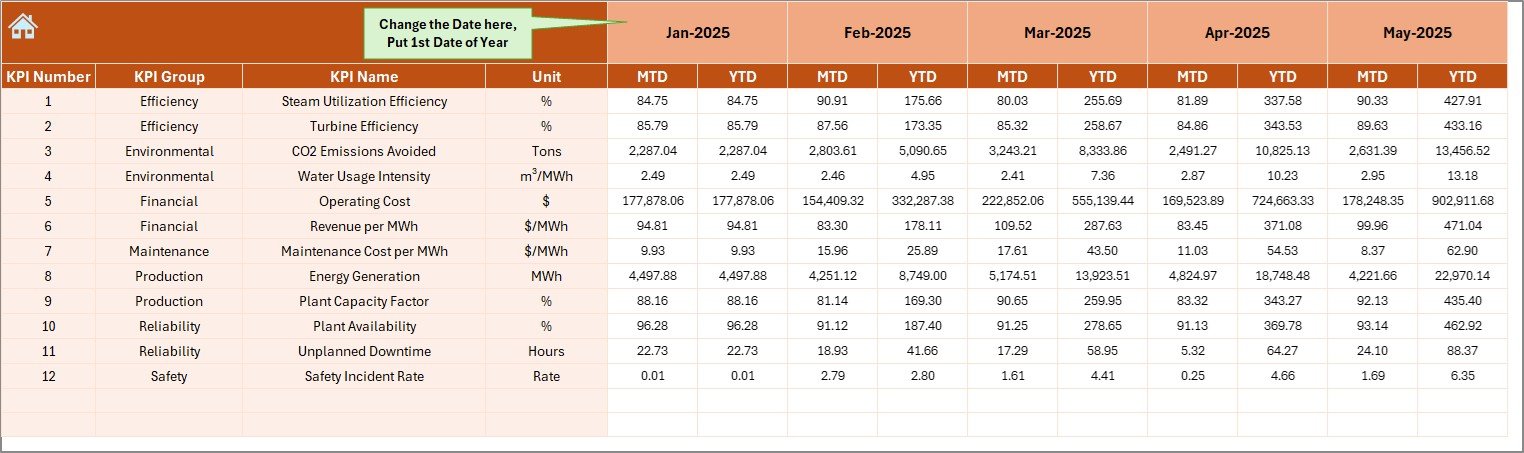
🧾 Actual Numbers Input Sheet – Data Entry Area
Users simply enter monthly performance values, and calculations update automatically.
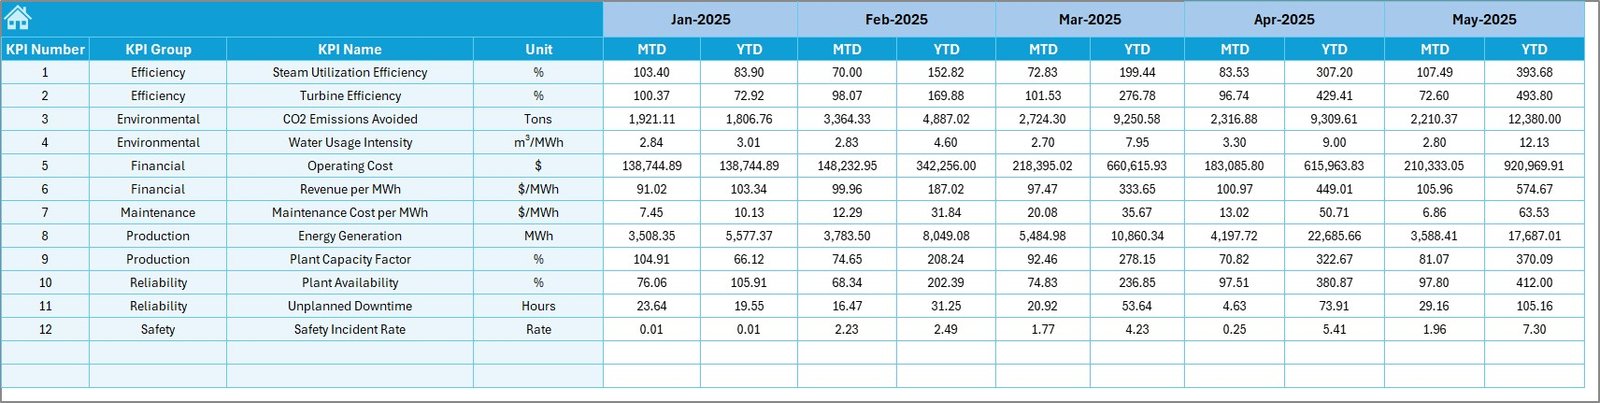
🎯 Target Sheet – KPI Goal Planning
Stores monthly and yearly performance targets for benchmarking.
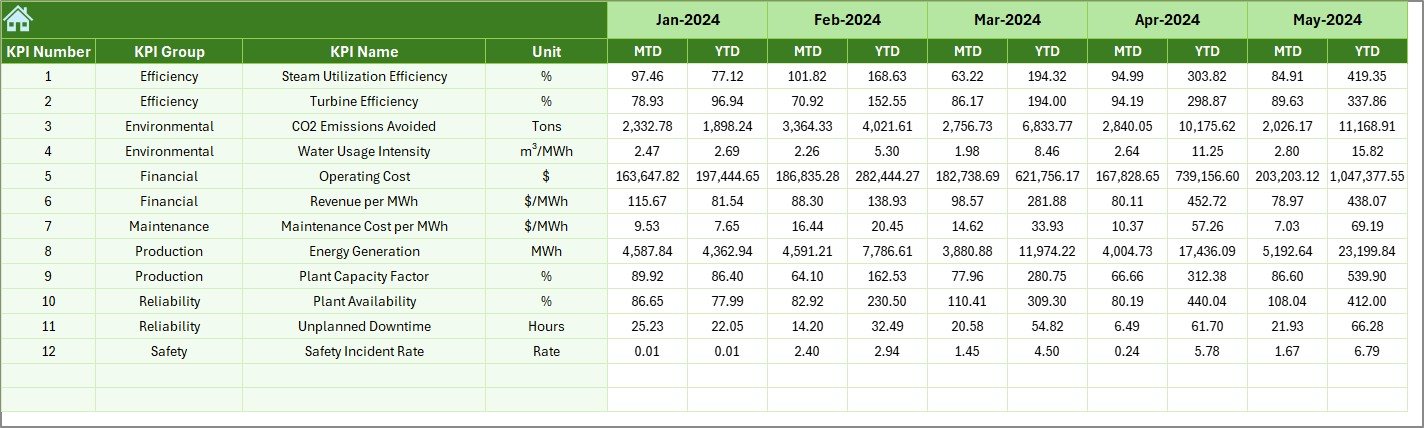
📅 Previous Year Numbers Sheet – Historical Data
Enables year-over-year performance comparison and forecasting insights.
📘 KPI Definition Sheet – KPI Documentation Hub
Maintains standardized KPI definitions ensuring consistent reporting.
⚙️ How to Use the Geothermal Energy KPI Dashboard in Excel
1️⃣ Define KPIs in the KPI Definition sheet.
2️⃣ Enter targets in the Target Sheet.
3️⃣ Add previous year data for benchmarking.
4️⃣ Input monthly actual performance numbers.
5️⃣ Select reporting month from dashboard dropdown.
6️⃣ Analyze trends and performance insights instantly.
Within minutes, organizations gain a complete performance monitoring system.
👥 Who Can Benefit from This Geothermal Energy KPI Dashboard
This dashboard is ideal for:
🌍 Energy Plant Managers
⚙️ Operations Engineers
📊 Financial Analysts
🌱 Sustainability Officers
🔋 Renewable Energy Consultants
🏢 Energy Companies & Investors
Any organization managing geothermal or renewable energy operations can leverage this dashboard effectively.
By improving visibility, automation, and performance tracking, the Geothermal Energy KPI Dashboard in Excel helps organizations optimize energy output, reduce risks, and strengthen sustainability performance.
### Click here to read the Detailed blog post
Visit our YouTube channel to learn step-by-step video tutorials:
👉 https://youtube.com/@PKAnExcelExpert