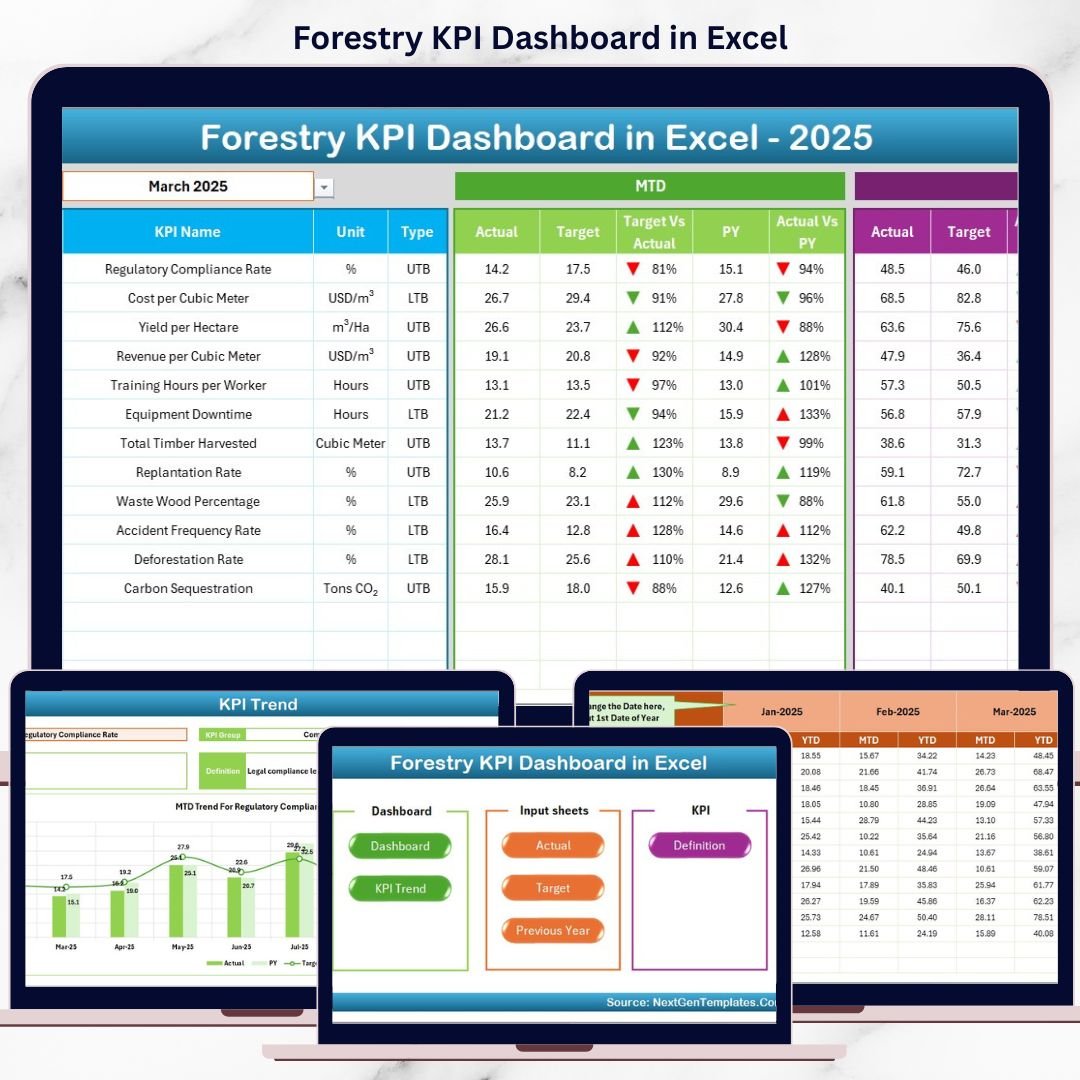
Forestry KPI Dashboard today requires accurate tracking, transparent reporting, and sustainable decision-making. Forest departments, plantation owners, NGOs, and sustainability teams must continuously monitor planting activities, harvesting efficiency, conservation performance, and compliance KPIs. However, when forestry data is spread across multiple Excel files, performance tracking becomes slow, confusing, and unreliable.
That is exactly where the Forestry KPI Dashboard in Excel becomes a powerful and practical solution 🚀. This ready-to-use Excel dashboard converts raw forestry data into clear KPIs, automated calculations, visual trends, and performance indicators. Instead of manually compiling reports every month, users instantly understand MTD, YTD, target, and previous-year performance from one structured workbook.
Designed specifically for forestry operations and sustainability reporting, this dashboard helps organizations save time, improve accuracy, and support responsible forest management.
🔑 Key Features of Forestry KPI Dashboard in Excel
🌲 7 Structured Worksheets for complete KPI management
📊 Automated MTD & YTD Calculations with zero manual effort
📅 Dynamic Month Selection to analyze any reporting period
🎯 Target vs Actual & PY vs Actual Analysis with arrows
📈 KPI Trend Analysis for deeper performance understanding
🧭 Easy Navigation Buttons for smooth user experience
🧩 100% Excel-Based Solution – no macros, no add-ins required
This dashboard provides clarity, consistency, and control for forestry performance monitoring.
📂 What’s Inside the Forestry KPI Dashboard
🏠 Home Sheet
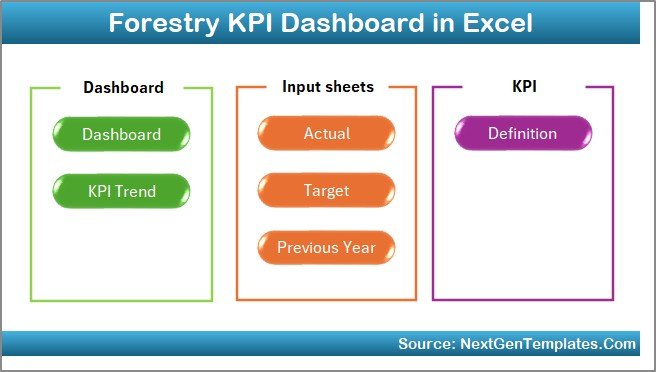
A clean landing page with navigation buttons that allow one-click access to all major dashboard sheets.
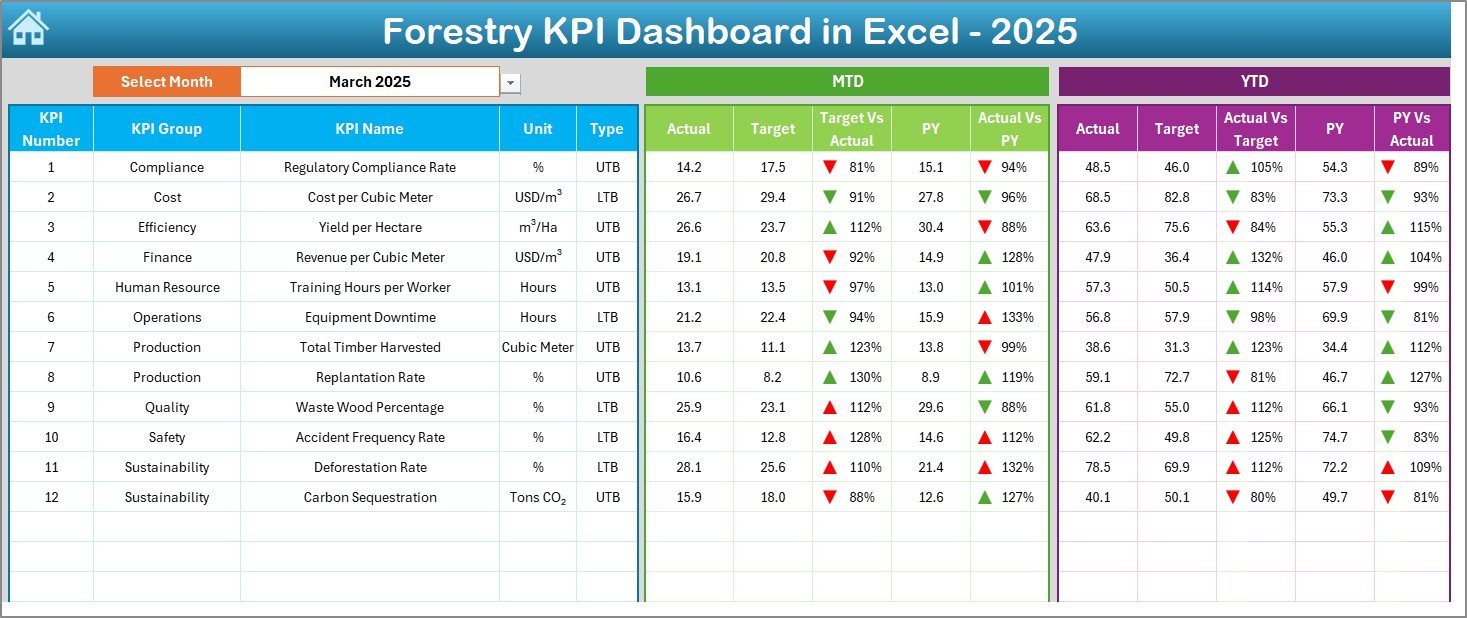
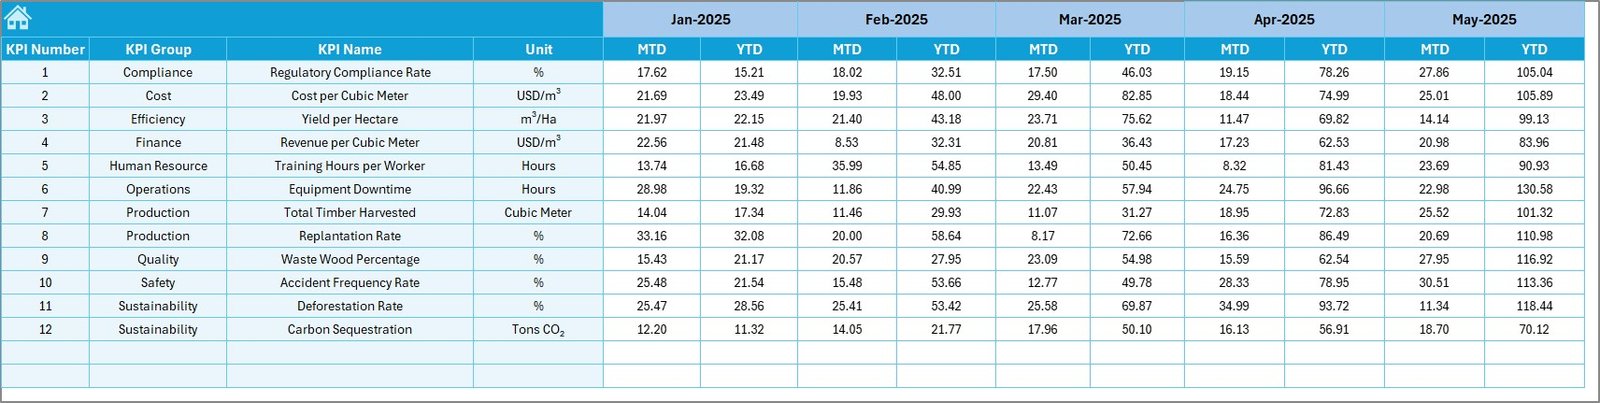
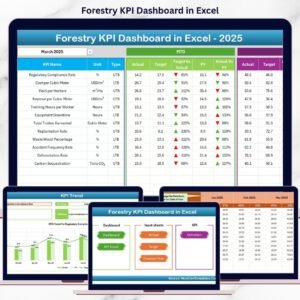
📊 Dashboard Sheet
The main performance view showing:
-
MTD Actual, Target, and Previous Year
-
YTD Actual, Target, and Previous Year
-
Target vs Actual arrows
-
Previous Year vs Actual arrows
Green and red indicators instantly highlight performance gaps.
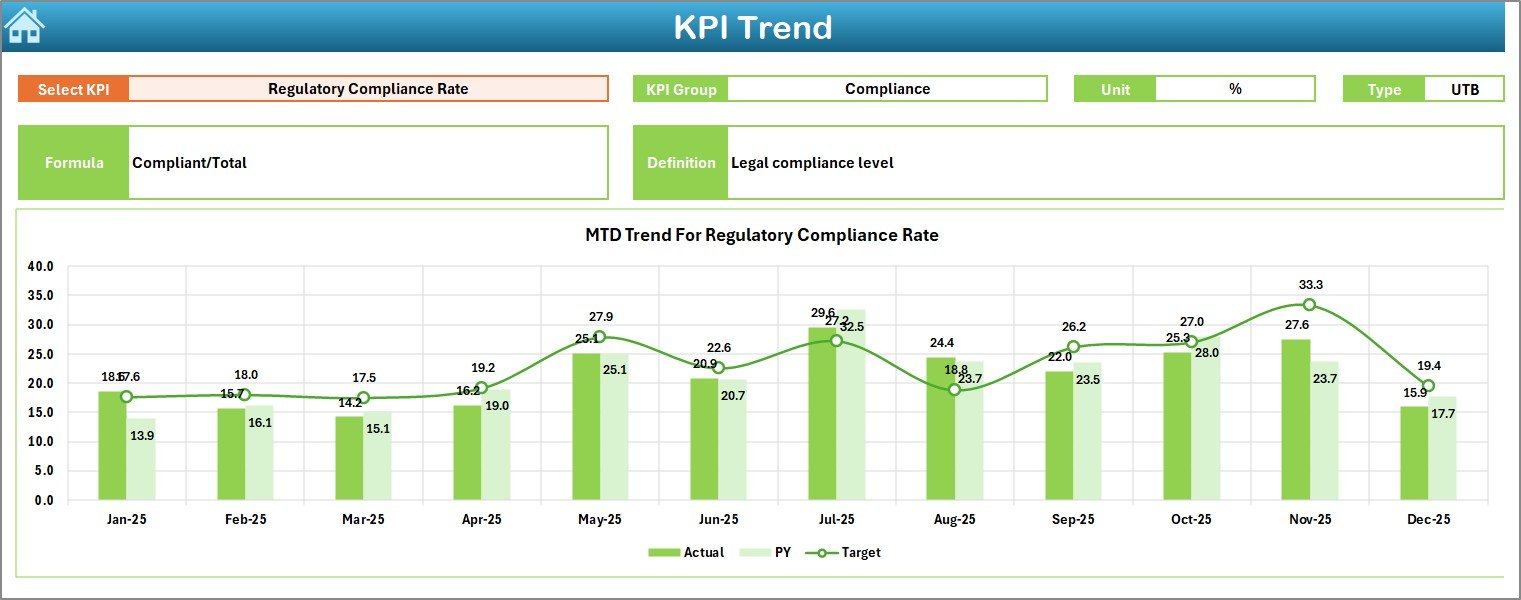
📈 KPI Trend Sheet
Allows deep analysis of one KPI at a time with:
-
KPI group, unit, type (LTB/UTB)
-
KPI formula and definition
-
MTD and YTD trend charts
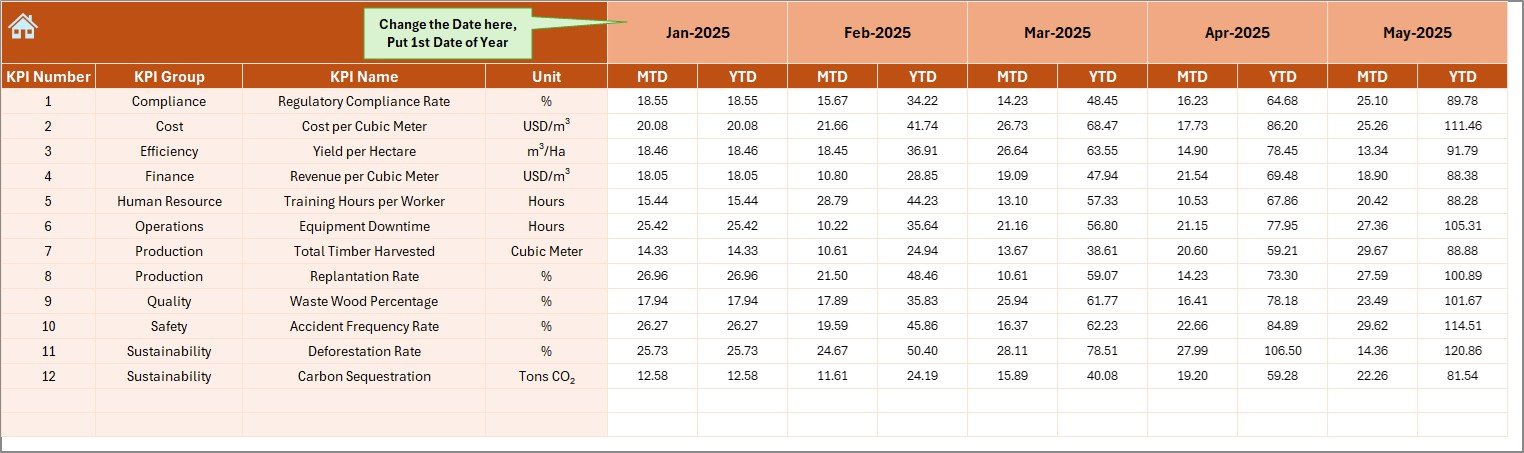
📝 Actual Numbers Input Sheet
A structured input area to enter monthly forestry performance data without breaking formulas.
🎯 Target Sheet
Stores planned MTD and YTD targets for each KPI to support goal tracking.
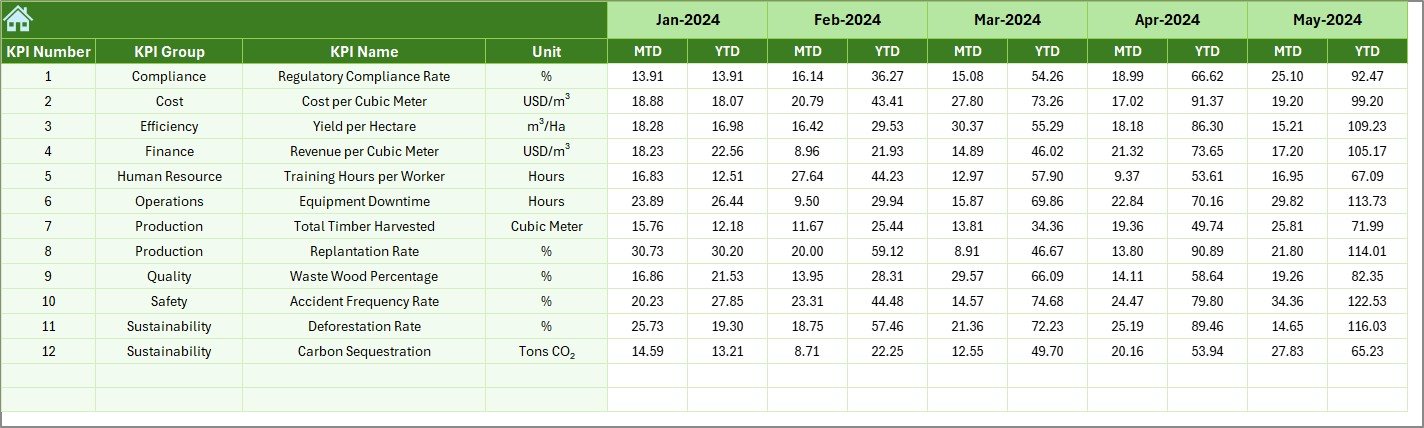
📅 Previous Year Number Sheet
Captures last year’s data for year-over-year comparison and trend evaluation.
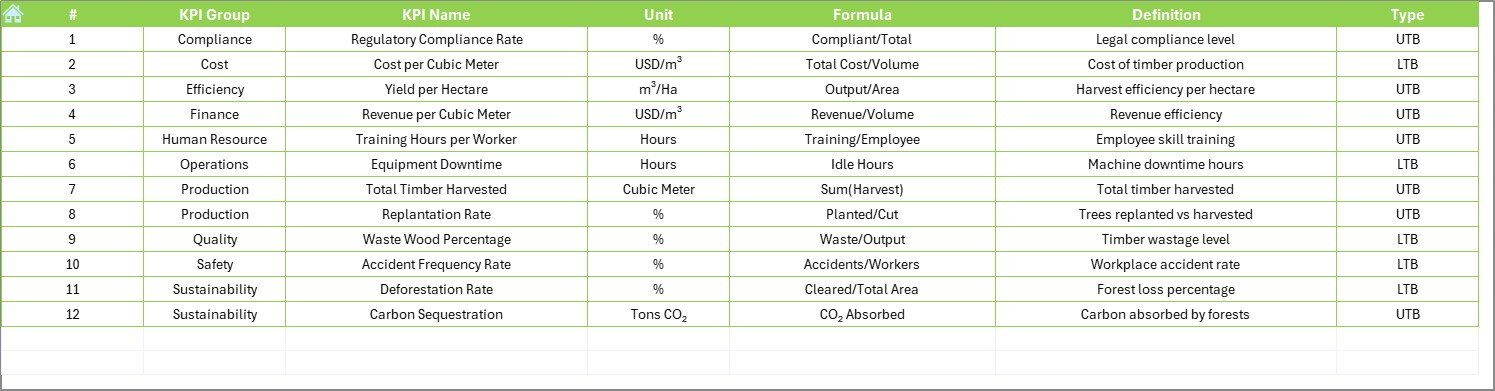
📘 KPI Definition Sheet
Documents KPI names, groups, units, formulas, and definitions to ensure consistency across teams.
🛠️ How to Use the Forestry KPI Dashboard
✅ Enter actual forestry data monthly
✅ Update target and previous-year values
✅ Select the reporting month from the dropdown
✅ Review MTD and YTD performance instantly
✅ Analyze trends and take corrective action
No advanced Excel knowledge is required. The dashboard is simple, intuitive, and business-ready.
👥 Who Can Benefit from This Forestry KPI Dashboard?
🌲 Forest Departments
🌱 Plantation & Estate Managers
🌍 Environmental & Sustainability NGOs
📊 CSR & ESG Teams
🏛️ Government & Regulatory Agencies
Whether you manage small plantations or large forest programs, this dashboard adapts to your needs.
👉 Click here to read the Detailed blog post
▶️ Visit our YouTube channel to learn step-by-step video tutorials
https://youtube.com/@PKAnExcelExpert


Reviews
There are no reviews yet.