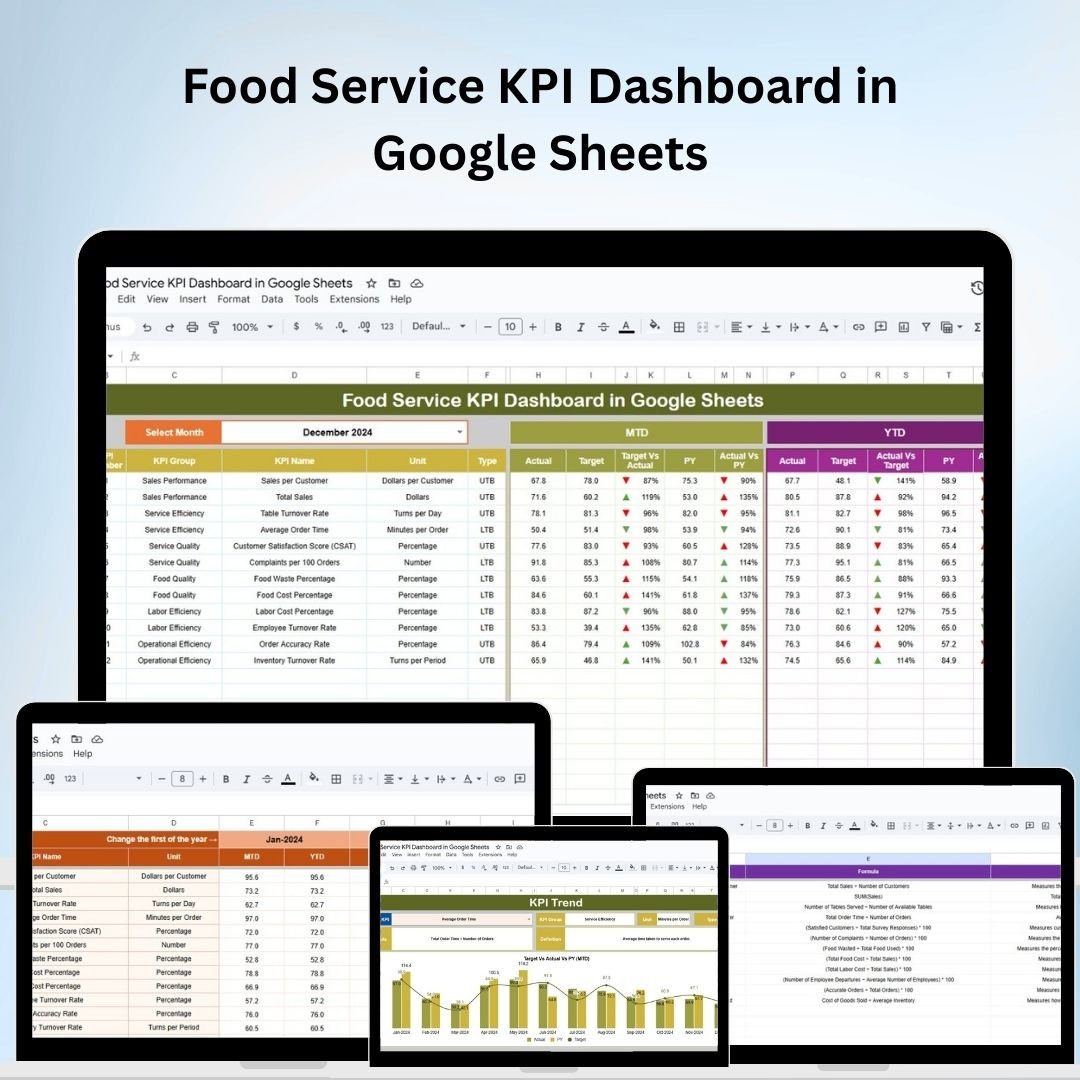
The Food Service KPI Dashboard in Google Sheets is an essential tool for food service businesses looking to track and enhance their performance metrics. This customizable dashboard helps restaurants, cafes, and food outlets monitor key performance indicators (KPIs) such as sales revenue, order volume, customer satisfaction, inventory levels, and staff performance. By centralizing these metrics in one place, businesses can make informed decisions, optimize operations, and improve customer experiences.
With Google Sheets, teams can collaborate in real-time, input data dynamically, and use interactive visualizations to spot trends and identify areas needing attention. The dashboard is designed to be flexible, making it easy to adapt to specific business needs.

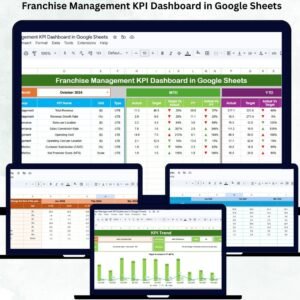
Key Features of the Food Service KPI Dashboard in Google Sheets
📋 Customizable Performance Metrics
-
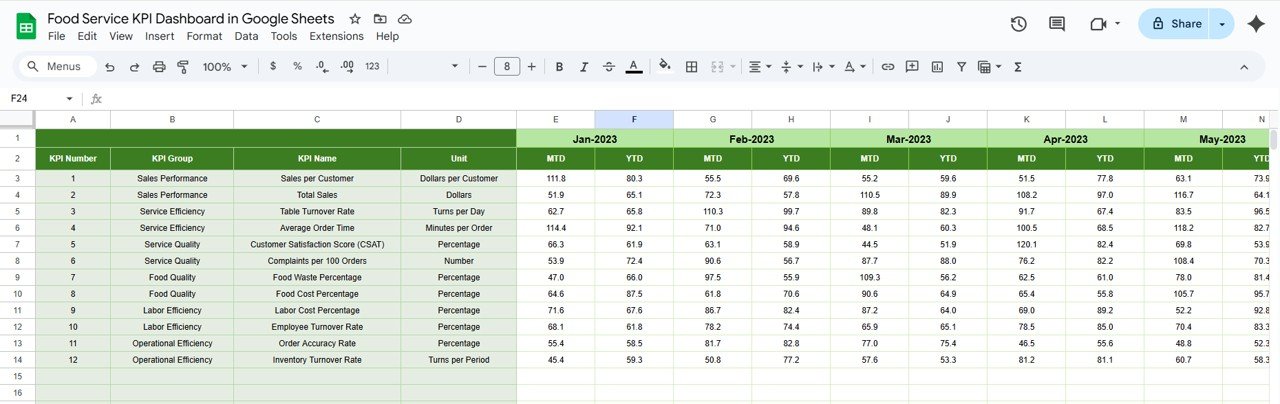
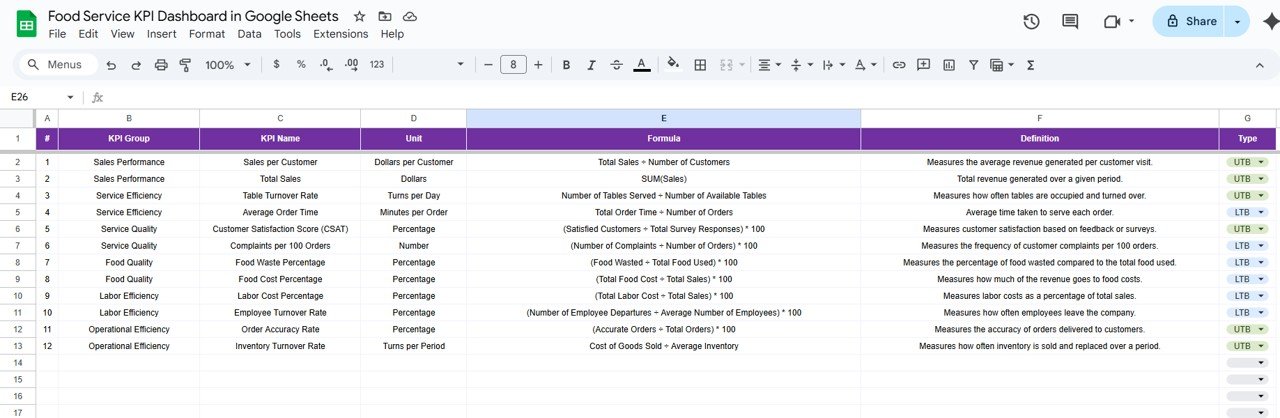
Tailored Food Service Indicators: Customize the dashboard to track KPIs relevant to your business, including sales revenue, average order value, peak service times, and customer satisfaction.
-
Dynamic Data Entry: Input and update data effortlessly, ensuring that the dashboard reflects the most current performance information.
📊 Interactive Data Visualization
-
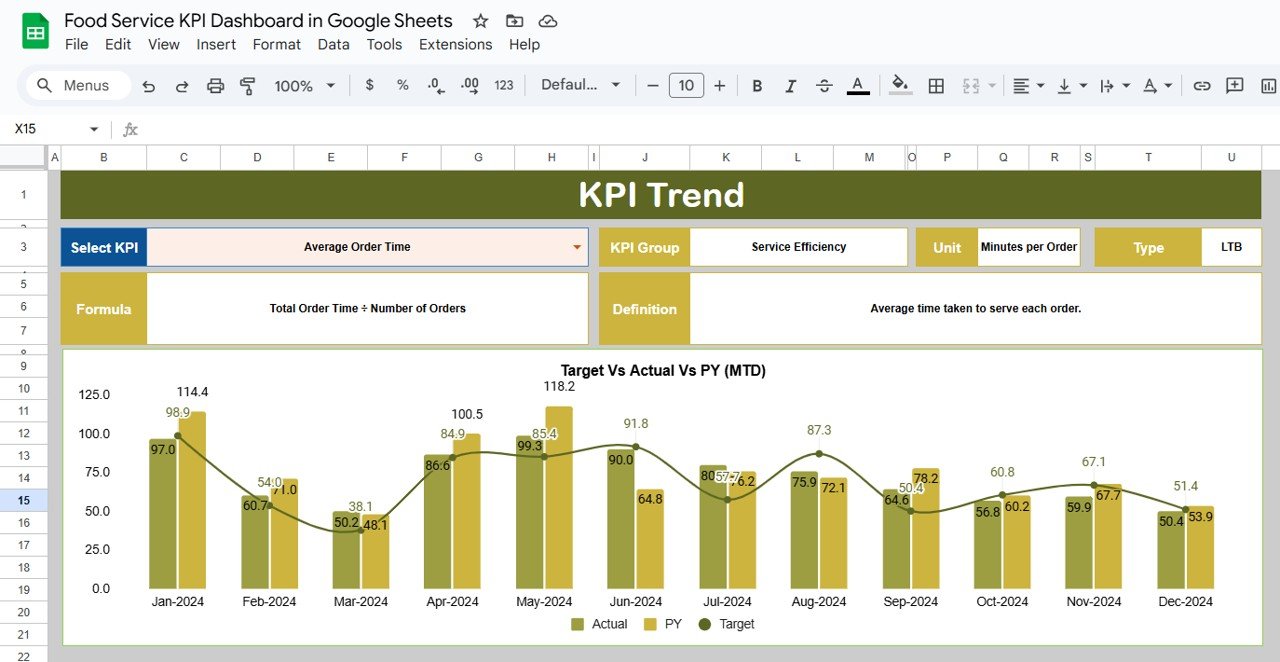
Comprehensive Charts and Graphs: Use a variety of charts such as bar charts, line graphs, and pie charts to represent your KPIs visually, making it easier to analyze trends and make data-driven decisions.
-
Conditional Formatting: Highlight key performance areas, such as top-performing products or underperforming staff, using color-coded formatting for quick visual assessment.
💻 Real-Time Collaboration and Accessibility
-
Multi-User Collaboration: Allow multiple team members to access and update the dashboard simultaneously, ensuring data consistency and promoting collaboration across your team.
-
Cloud-Based Access: Access the dashboard from any device with internet connectivity, making it easy to monitor and update data remotely or on the go.
🛠 Automated Calculations and Reporting
-
Built-In Formulas: Use Google Sheets’ functions to automatically calculate key metrics such as total sales, average order value, and customer satisfaction scores, saving time and reducing errors.
-
Scheduled Reporting: Set up automated email reports or notifications to keep stakeholders informed about performance trends and outcomes.
Benefits of Using Google Sheets for Food Service KPI Tracking
✅ Cost-Effective Solution
Google Sheets is a free, powerful tool that provides all the features you need to track food service performance without requiring expensive software.
✅ User-Friendly Interface
Its intuitive and simple interface ensures that users at all skill levels can easily navigate the dashboard, track key metrics, and generate insights without any technical expertise.
✅ Scalable and Flexible
As your food service business grows or your performance goals evolve, the dashboard can be easily adjusted to accommodate new data, KPIs, or operational changes.
Getting Started with Your Food Service KPI Dashboard in Google Sheets
-
Define Key Performance Indicators (KPIs): Identify the most important KPIs for your business, such as sales revenue, order volume, average order value, and customer satisfaction.
-
Design the Dashboard Layout: Organize the dashboard into sections for data input, performance tracking, and visualizations to make it easy to use and understand.
-
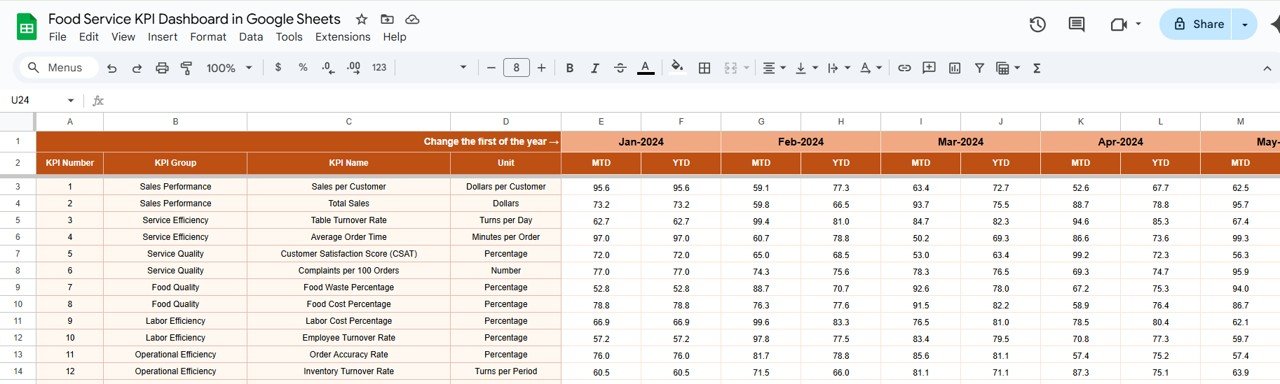
Input Historical and Target Data: Enter past performance data and current targets to provide context for analysis and performance comparison.
-
Set Up Automated Calculations: Use Google Sheets’ built-in functions to automate calculations, such as total sales, average order value, and customer satisfaction scores.
-
Customize Visual Elements: Add charts, graphs, and conditional formatting to make the dashboard visually appealing and easy to interpret at a glance.
-
Share and Collaborate: Share the dashboard with relevant team members and stakeholders, providing them access to real-time updates and performance insights.
By using a Food Service KPI Dashboard in Google Sheets, your business can streamline performance monitoring, optimize operations, and make data-driven decisions to enhance customer experience and improve overall profitability.
Click here to read the Detailed blog post
Food Service KPI Dashboard in Google Sheets
Visit our YouTube channel to learn step-by-step video tutorials
YouTube.com/@PKAnExcelExpert


Reviews
There are no reviews yet.