
Managing a floriculture business requires a constant balance between production efficiency, quality control, cost management, plant care, and sales performance. When data is scattered across multiple spreadsheets, managers struggle to track progress and make fast decisions. The Floriculture KPI Dashboard in Excel solves this problem instantly. It brings all key performance indicators into one smart, interactive, and visually rich dashboard—designed for greenhouse owners, nursery managers, production teams, and agribusiness leaders.
This ready-to-use Excel dashboard converts raw operational data into meaningful insights. Whether you want to track flowering rates, wastage, labour performance, irrigation efficiency, sales revenue, or previous year trends, this powerful tool gives you everything in one place. With simple dropdowns, structured sheets, automated comparisons, and clear visual indicators, it is the easiest way to monitor your floriculture operations.
🌟 Key Features of the Floriculture KPI Dashboard in Excel
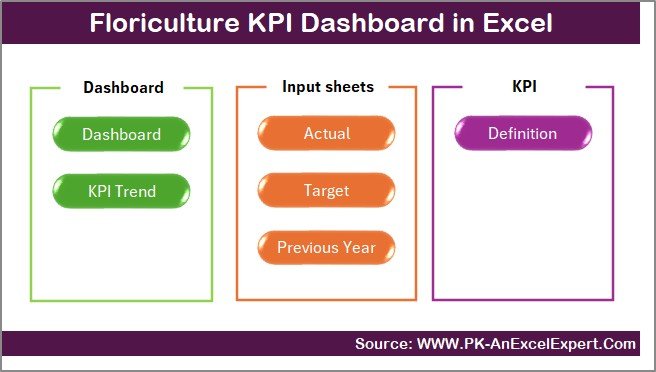
The dashboard includes 7 smart worksheets, each designed for speed, clarity, and productivity:
1️⃣ Summary Page – One-Click Navigation
Navigate to any sheet instantly using prebuilt buttons. This makes the dashboard user-friendly for all departments.
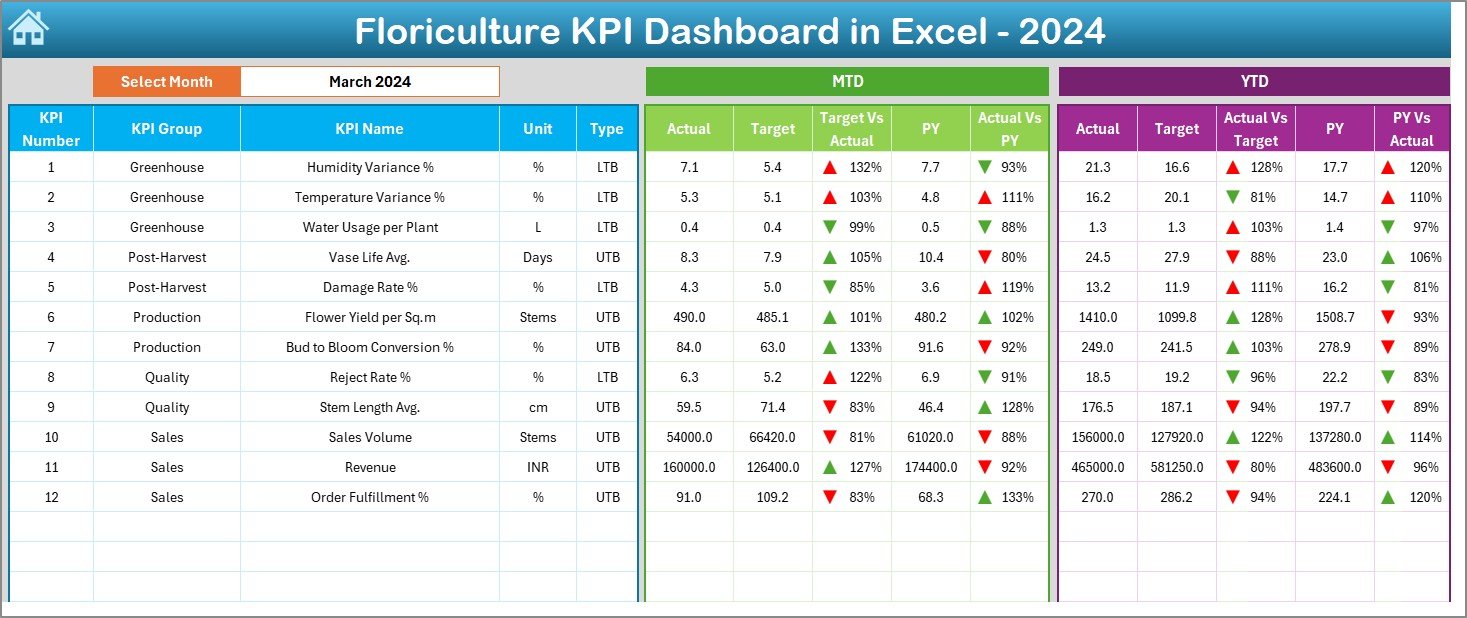
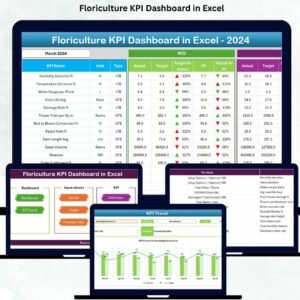
2️⃣ Dashboard Page – Complete KPI Overview
🔸 Month selector
🔸 MTD & YTD Actual, Target, and Previous Year
🔸 Target vs Actual comparison
🔸 PY vs Actual comparison
🔸 Up/Down arrows for instant performance alerts
The entire dashboard updates automatically when you select a new month.
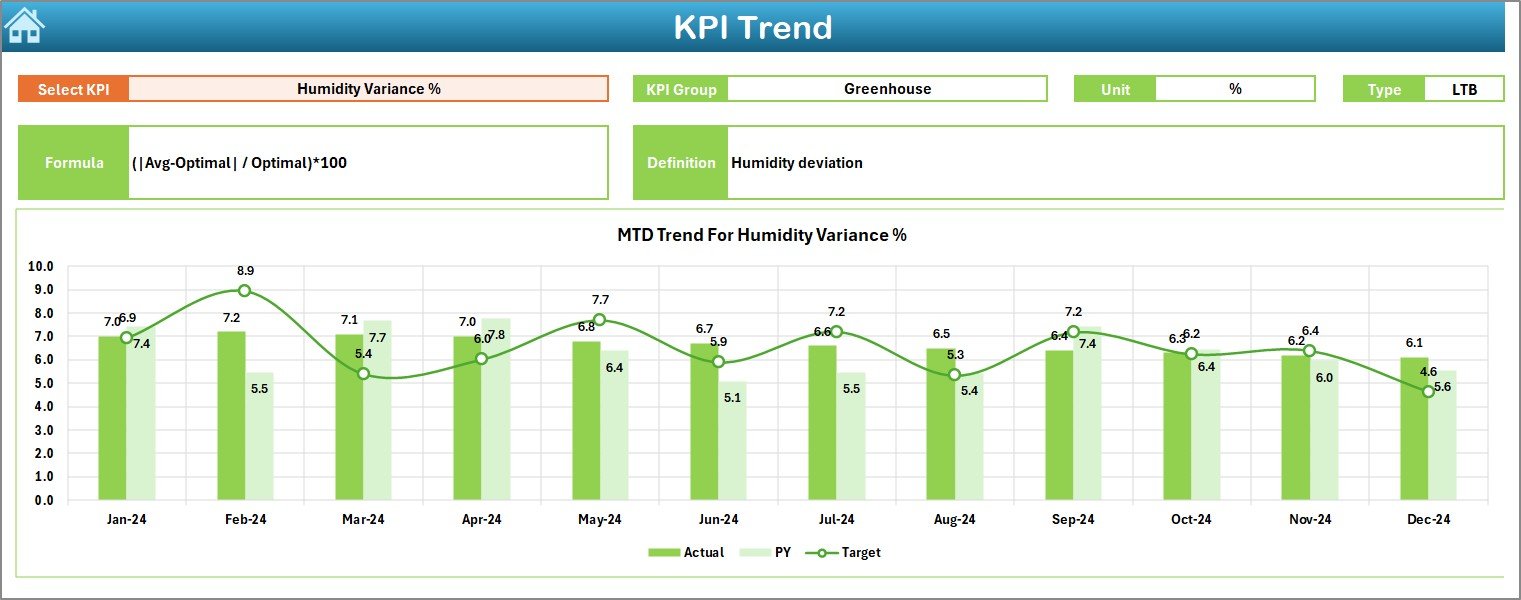
3️⃣ Trend Page – KPI-Level Trends
Select any KPI and view MTD & YTD performance charts. See patterns, seasonal variations, and year-long progress.
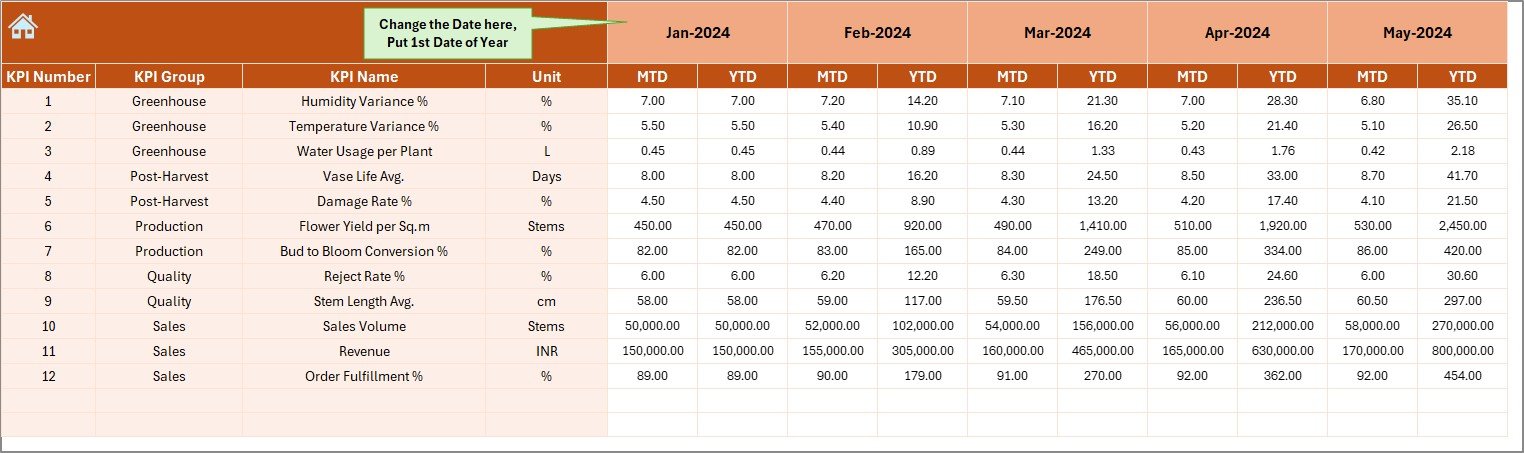
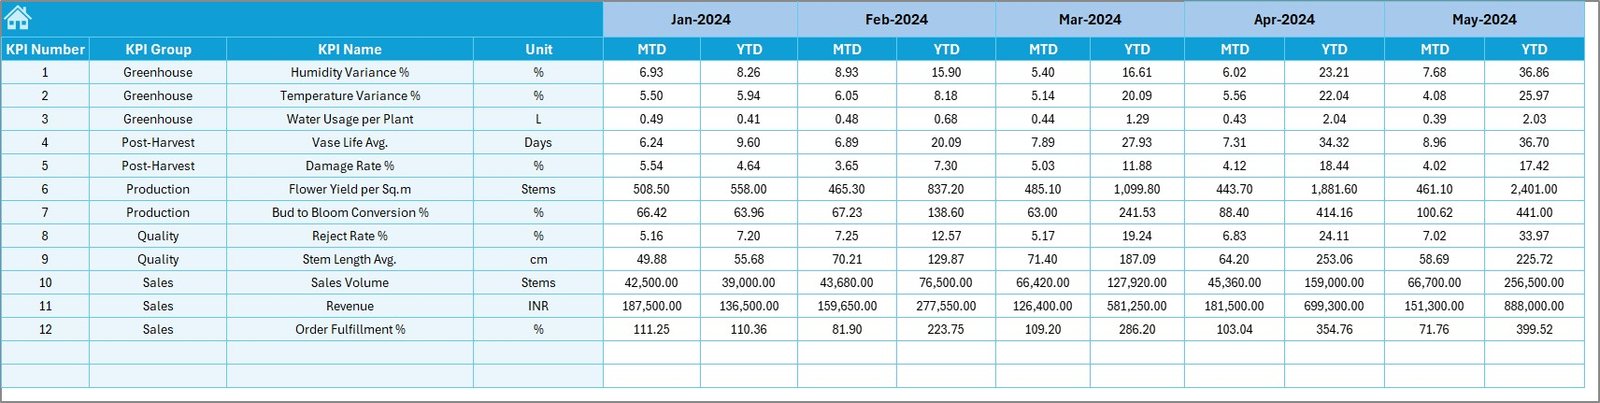
4️⃣ Actual Numbers Sheet
Enter monthly MTD and YTD actuals. The dashboard fetches values directly to ensure accuracy.
5️⃣ Target Sheet
Record monthly MTD and YTD targets for all KPIs.
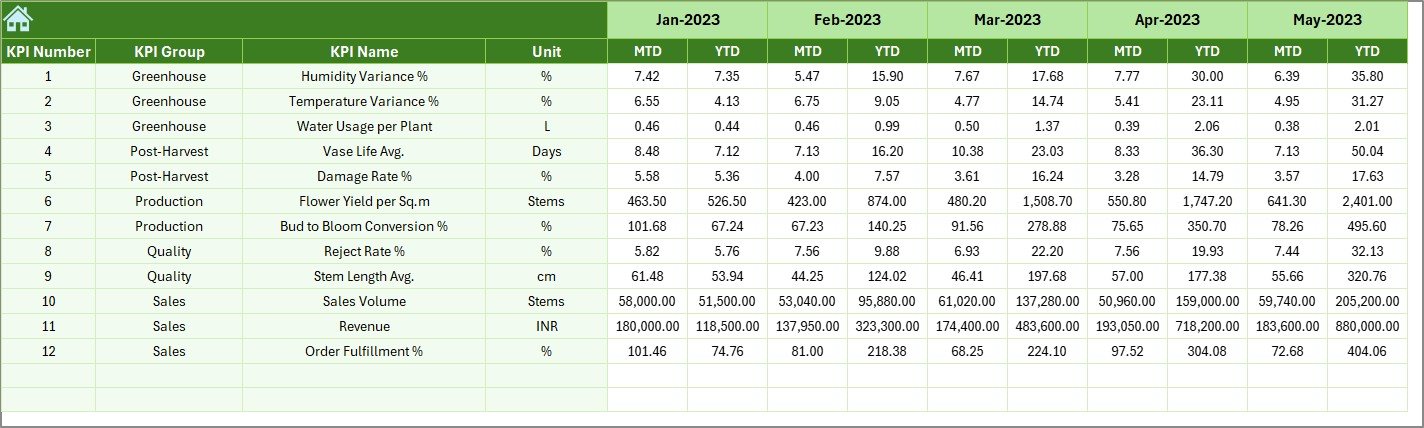
6️⃣ Previous Year Data
Enter last year’s actuals to compare growth and identify recurring issues.
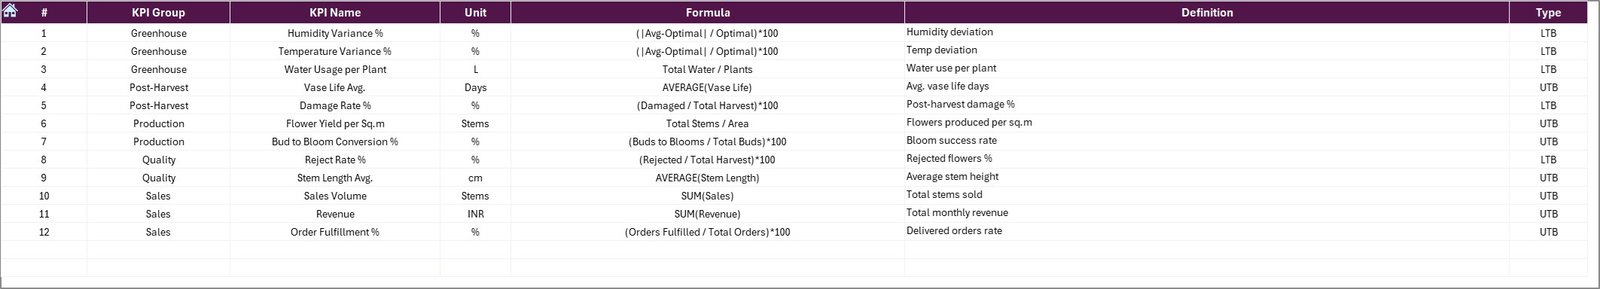
7️⃣ KPI Definition Page
Define every KPI clearly with Group, Unit, Formula, Meaning, and Type (UTB / LTB).
📦 What’s Inside the Floriculture KPI Dashboard in Excel
Inside this product, you get:
🌱 A fully automated Floriculture KPI Dashboard
📊 Pre-designed trend charts
📌 MTD & YTD comparison system
📁 7 worksheet tabs mapped for production, quality, labour, cost & sales
🧩 Customizable KPI Definition page
🔧 Smart dropdowns & conditional formatting alerts
📈 Yearly trend analytics for better forecasting
📘 Clean, easy-to-edit Excel layout
Everything is structured so even beginners can use it confidently.
📝 How to Use the Floriculture KPI Dashboard in Excel
Follow these simple steps to get maximum value:
Step 1: Enter Actual Data
Fill MTD and YTD values in the Actual Numbers sheet.
Step 2: Enter Targets
Record monthly MTD & YTD targets.
Step 3: Enter Previous Year Data
Add historical numbers for comparison.
Step 4: Define KPIs
Update KPI Group, Name, Unit, Formula, Definition, and Type.
Step 5: Review Dashboard
Choose a month from the dropdown and analyze KPIs instantly.
Step 6: Analyze Trends
Use the Trend tab to study KPI-level patterns for smarter planning.
👥 Who Can Benefit from This Floriculture KPI Dashboard?
This Excel dashboard is perfect for:
🌼 Greenhouse Managers – Track flowering rate, climate efficiency & labour usage
🏭 Agribusiness Owners – Monitor costs, profit, and production output
📈 Operations Teams – Review targets, trends, and seasonal variations
💼 Sales & Distribution Teams – Track sales, delivery rate & customer issues
🔬 Quality Control Teams – Monitor waste, defects, and quality score
📊 Data Analysts & Management – Present clear reports to decision-makers
Whether you manage a small nursery or a large floriculture company, this dashboard keeps everything organized and performance-focused.
### Click Here to Read the Detailed Blog Post
Watch the step-by-step video tutorial:


Reviews
There are no reviews yet.