The Floriculture Dashboard moves fast. Wedding seasons explode demand. Festivals create sudden sales spikes. Export orders shift every month. Meanwhile, flower perishability increases risk every single day.
If you still depend on manual Excel files and scattered reports, you are missing profit opportunities.
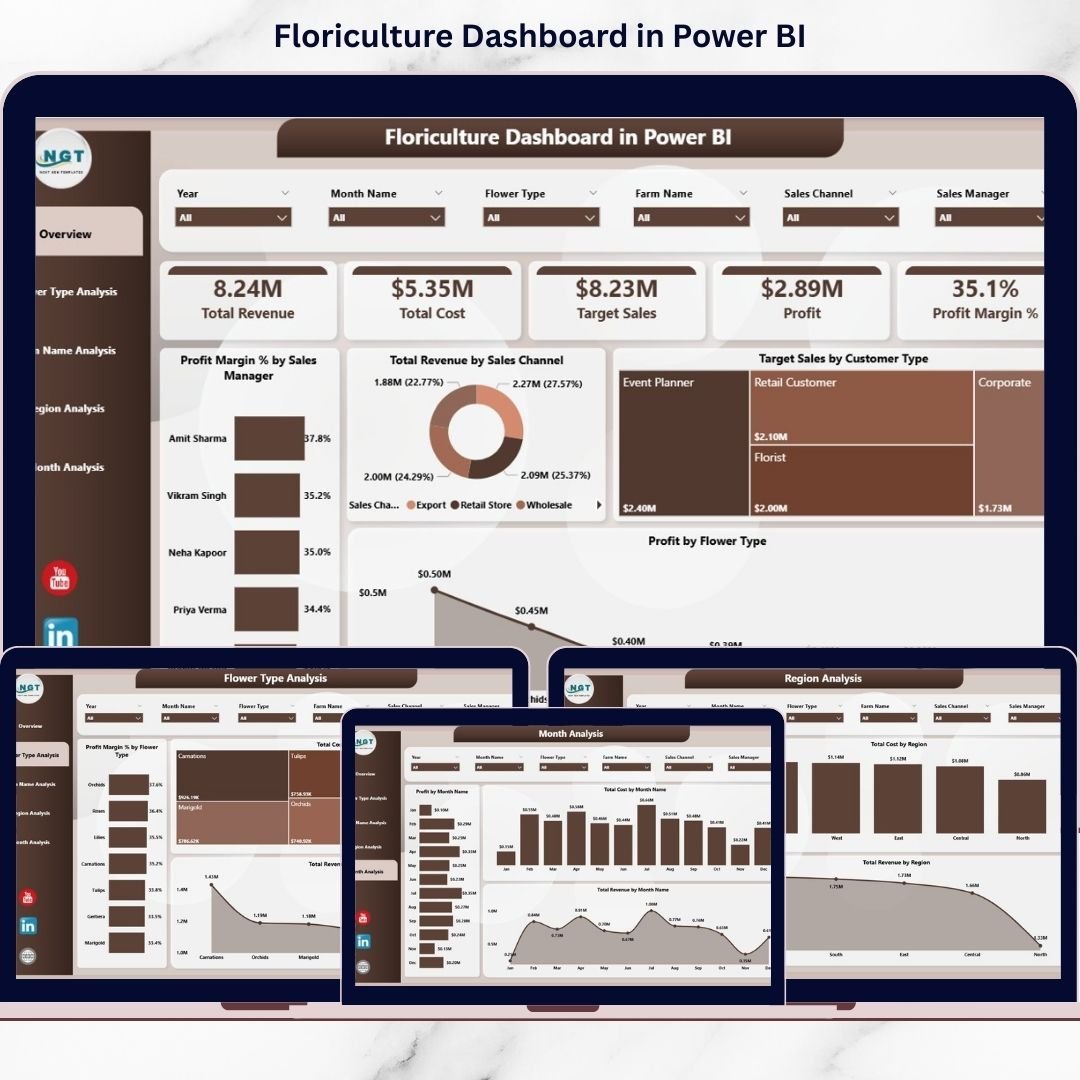
Now imagine tracking Total Revenue, Profit Margin %, Target Sales, Flower Type performance, Farm contribution, Region-wise results, and Monthly trends — all in one powerful interactive system.
That is exactly what the Floriculture Dashboard in Power BI delivers.
This ready-to-use Power BI dashboard transforms your raw sales and cost data into stunning visuals and KPI cards. As a result, you gain complete visibility over your business and make faster, smarter decisions.
Stop guessing. Start managing with data.
🚀 Key Features of Floriculture Dashboard in Power BI
📊 5 Fully Designed Analytical Pages
🎯 KPI Cards for quick performance overview
🔎 Interactive Slicers for dynamic filtering
📈 Profit Margin % Tracking
🌍 Region-wise Revenue Analysis
🌸 Flower Type Performance Insights
🏡 Farm-Level Contribution Comparison
📅 Month-wise Trend Analysis
⚡ Real-Time Data Refresh
📤 Easy Sharing Across Teams
Because it is built in Power BI, you get dynamic filtering, drill-down capability, and instant updates after data refresh.
📦 What’s Inside the Floriculture Dashboard in Power BI
This dashboard includes 5 powerful pages designed specifically for floriculture businesses:
1️⃣ Overview Page
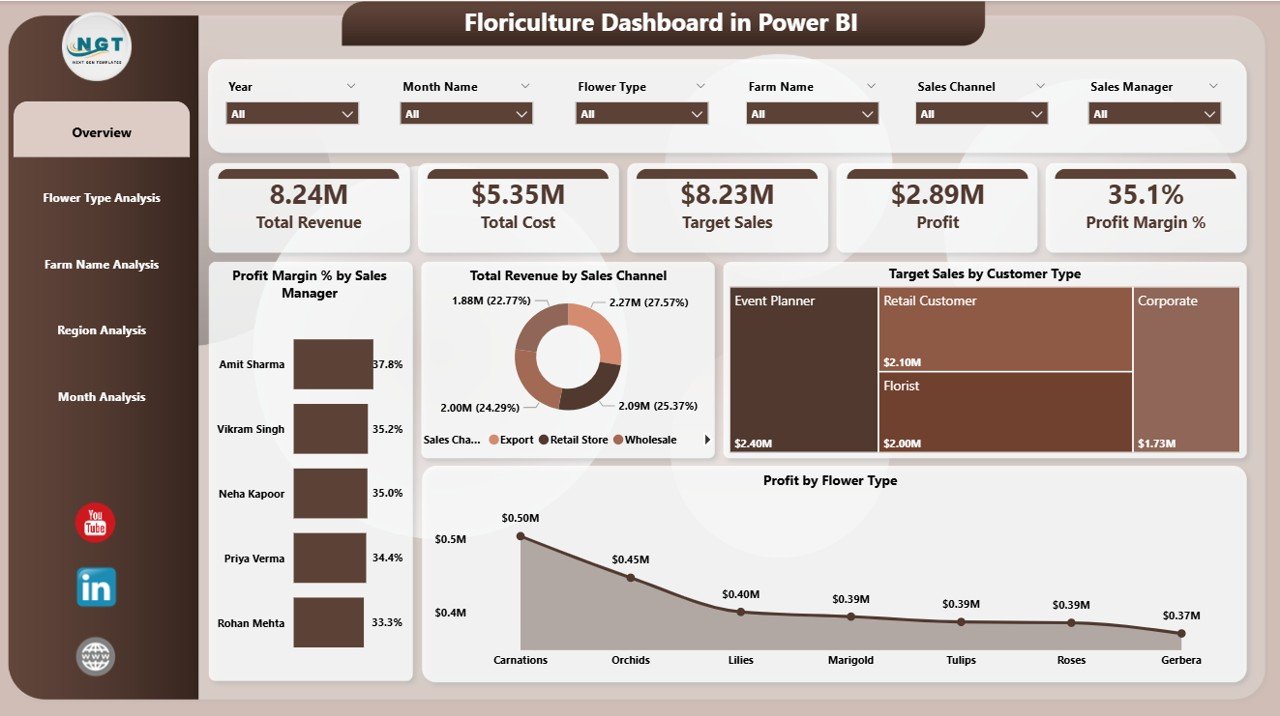
Your command center.
It displays:
-
Profit Margin % by Sales Manager
-
Total Revenue by Sales Channel
-
Target Sales by Customer Type
-
Profit by Flower Type
With slicers for Month, Region, Flower Type, and Sales Channel, you can drill down instantly.
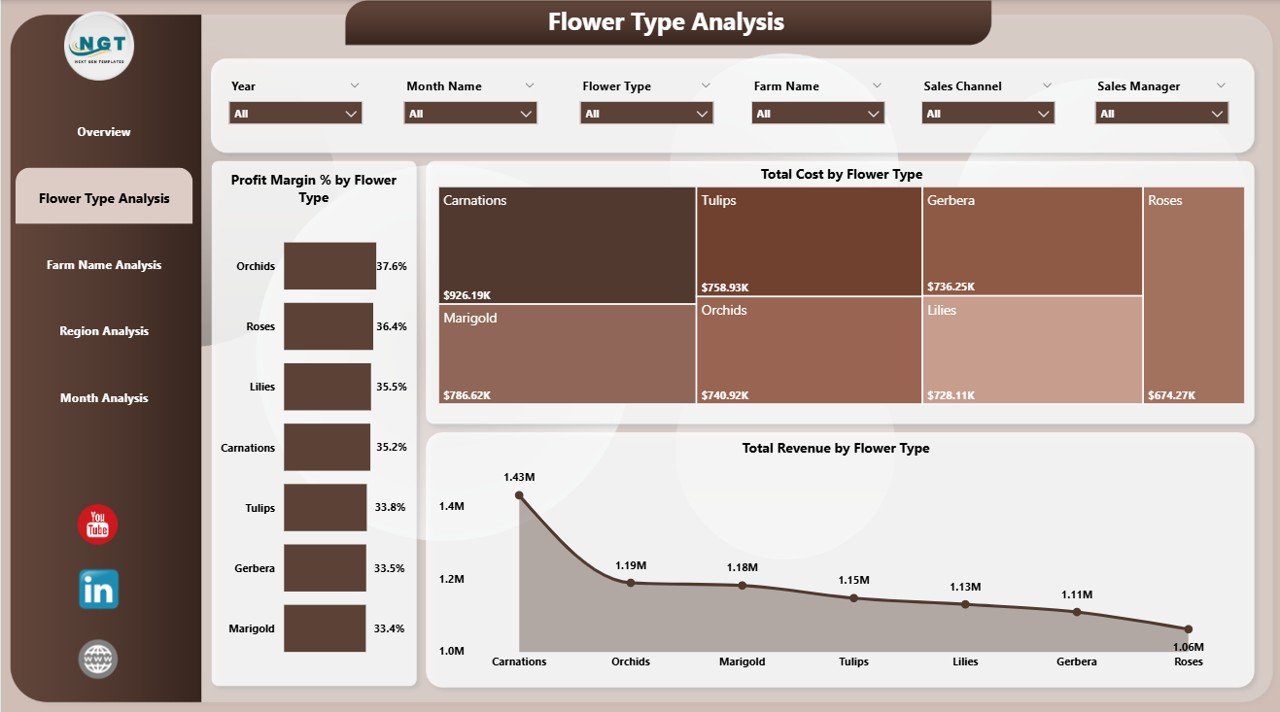
2️⃣ Flower Type Analysis
Track performance across Roses, Orchids, Lilies, Tulips, and more.
You can analyze:
-
Revenue by Flower Type
-
Profit Margin % by Flower Type
-
Revenue Comparison
Identify high-margin flowers and reduce low-margin inventory.
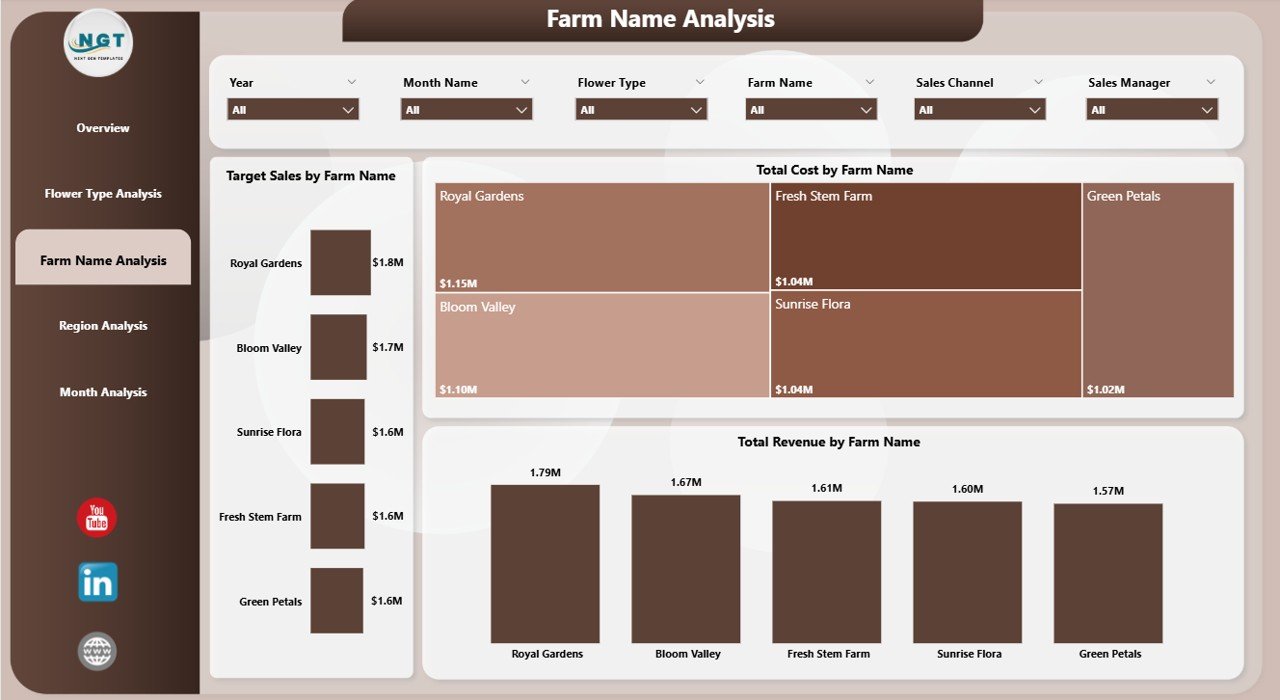
3️⃣ Farm Name Analysis
If you manage multiple farms or growers, this page helps you compare performance.
It includes:
-
Target Sales by Farm
-
Total Revenue by Farm
-
Revenue Comparison
Reward top-performing farms and improve underperforming ones.
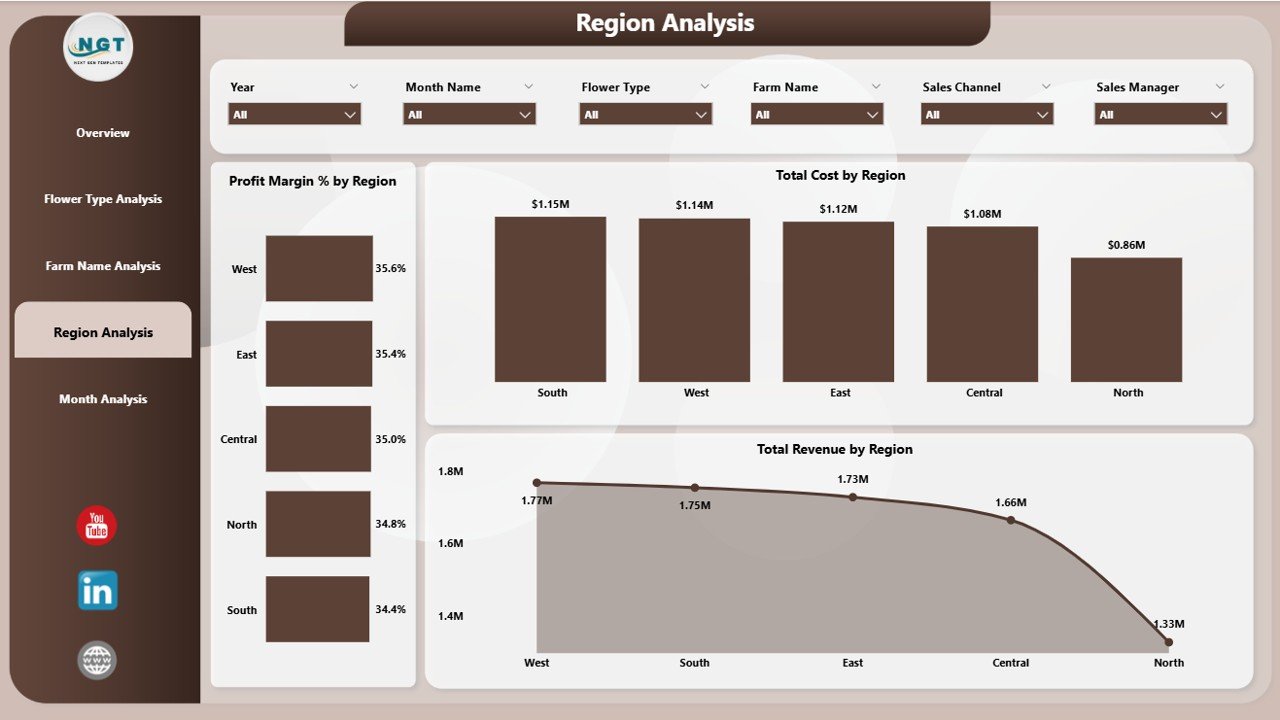
4️⃣ Region Analysis
See which regions generate maximum profit.
Track:
-
Profit Margin % by Region
-
Total Revenue by Region
-
Revenue Comparison
Allocate marketing and resources strategically.
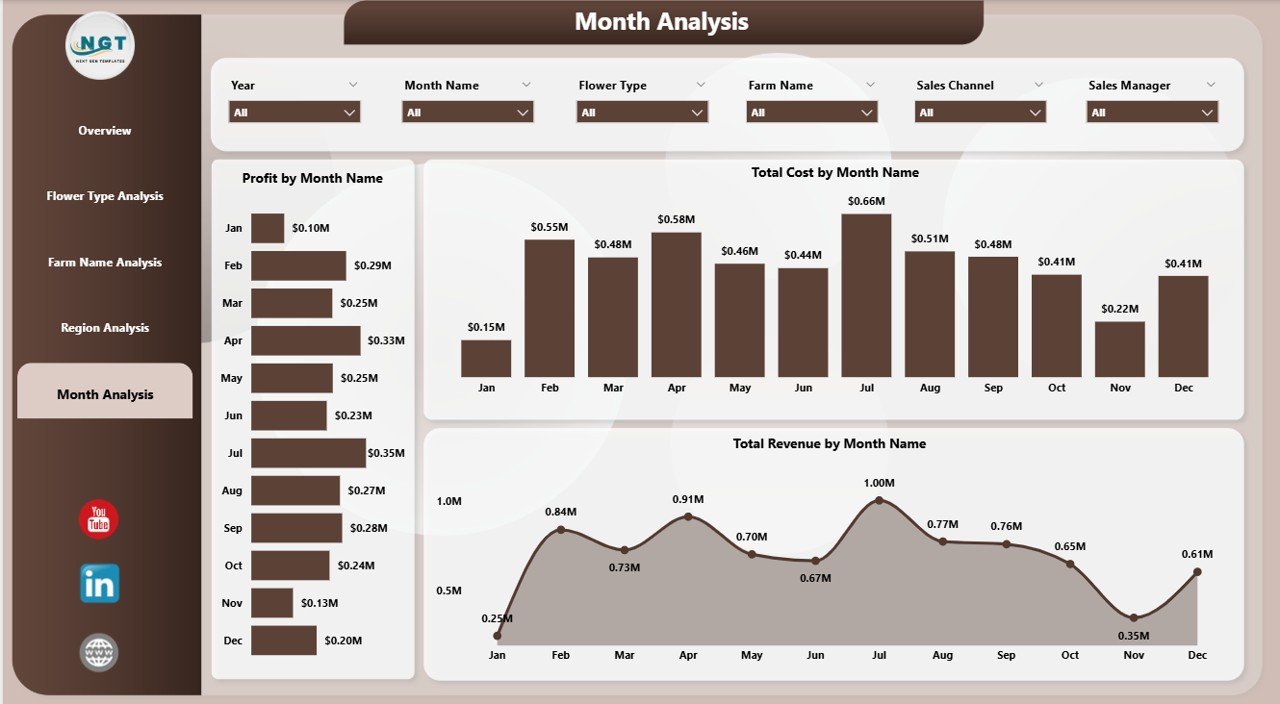
5️⃣ Month Analysis
Floriculture is seasonal. This page helps you track:
-
Profit by Month
-
Total Revenue by Month
-
Revenue Trend
Prepare for peak seasons like Valentine’s Day, wedding months, and festival periods.
🛠 How to Use the Floriculture Dashboard in Power BI
Using this dashboard is simple:
1️⃣ Import or connect your sales data
2️⃣ Update target and cost information
3️⃣ Refresh the dashboard
4️⃣ Use slicers to filter insights
No advanced technical skills required. The interface is user-friendly and intuitive.
👥 Who Can Benefit from This Floriculture Dashboard in Power BI
🌸 Flower Farm Owners
📦 Export Managers
💼 Sales Managers
🌍 Regional Distributors
📊 Financial Analysts
🏡 Greenhouse Operators
If you manage revenue, cost, sales, or farm operations, this dashboard becomes your daily decision-making tool.
By using this dashboard, you:
✔ Identify high-margin flower types
✔ Detect underperforming regions
✔ Compare farm performance clearly
✔ Track seasonal demand patterns
✔ Improve pricing strategy
✔ Reduce wastage
✔ Increase profitability
Instead of spending hours creating reports, you focus on growing your floriculture business.
This is not just a Power BI file. It is a complete business intelligence solution designed specifically for the flower industry.
If you want better visibility, higher margins, and smarter seasonal planning — this dashboard gives you the competitive edge.