In today’s fast-paced fitness and wellness industry, data-driven decisions matter more than ever. Gyms, wellness centers, corporate fitness programs, and personal trainers track attendance, workout hours, satisfaction scores, and revenue every day. However, when this data remains scattered across Excel files and manual reports, visibility drops and growth opportunities get missed.
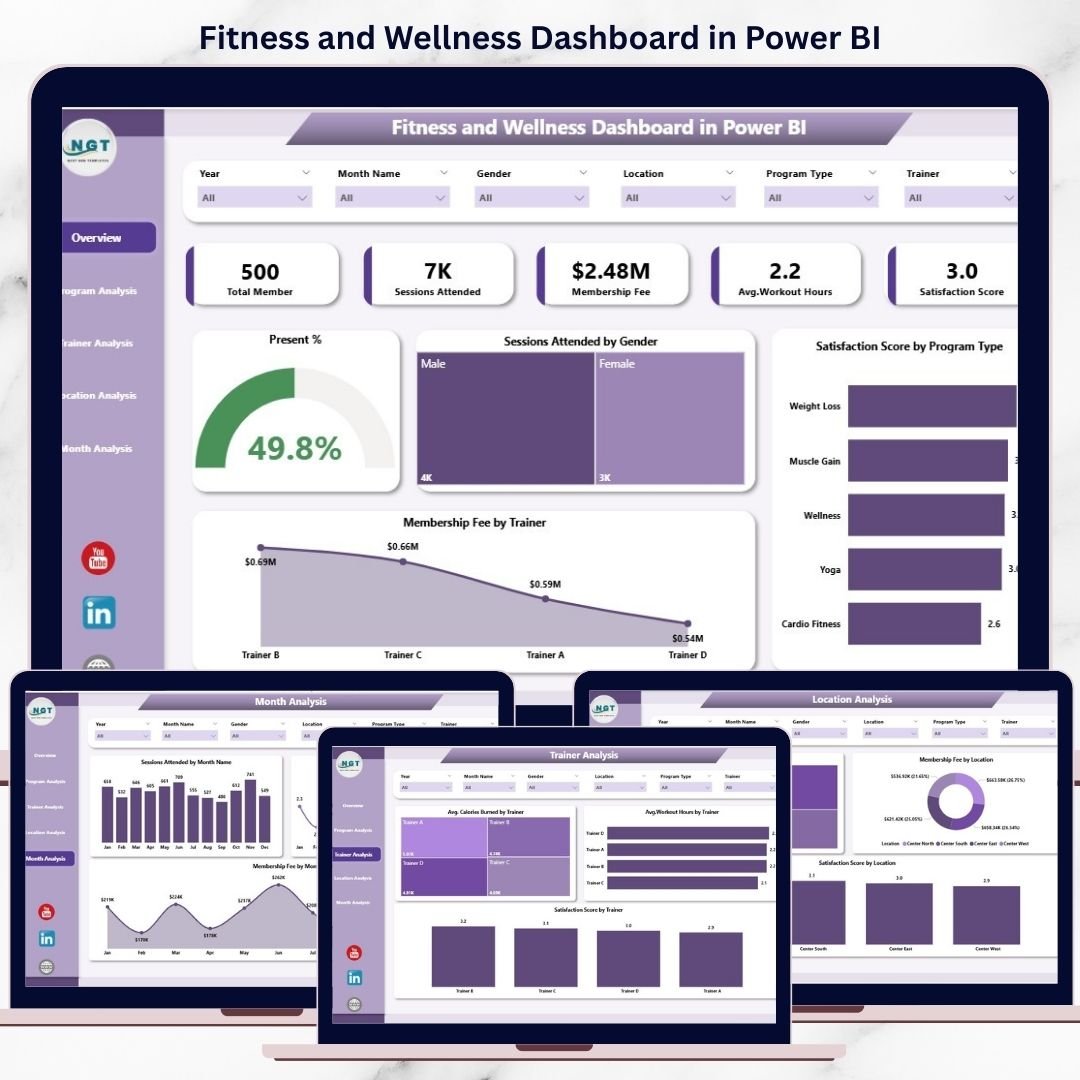
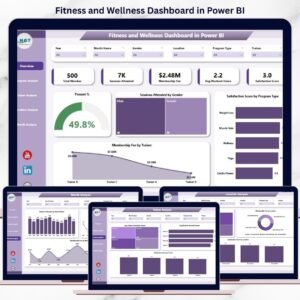
The Fitness and Wellness Dashboard in Power BI is a ready-to-use, interactive analytics solution that brings all your fitness and wellness data into one centralized Power BI dashboard. Instead of guessing what works, you instantly see member engagement, program effectiveness, trainer performance, location trends, and revenue movement—all through dynamic visuals and slicers.
This dashboard helps fitness businesses move from reactive management to proactive, insight-driven growth.
🚀 Key Features of Fitness and Wellness Dashboard in Power BI
📊 Centralized Fitness & Wellness Analytics – One dashboard for all performance insights
🎯 Interactive Slicers – Filter by program, trainer, gender, location, and month
📈 Real-Time Performance Visibility – Attendance, engagement, satisfaction, and revenue
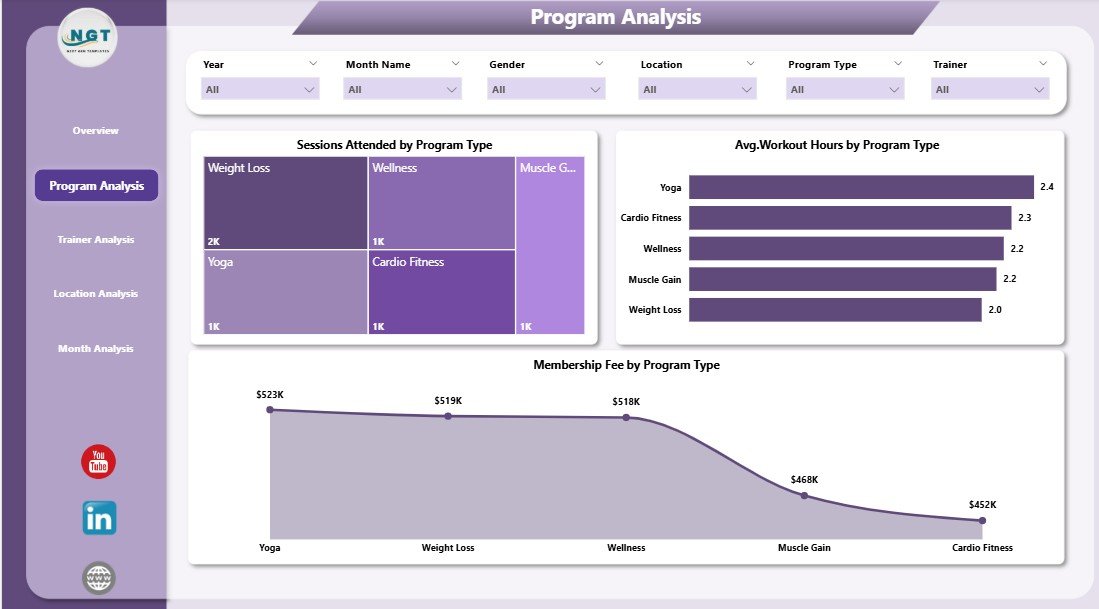
🏋️ Program Performance Analysis – Identify high-impact fitness programs
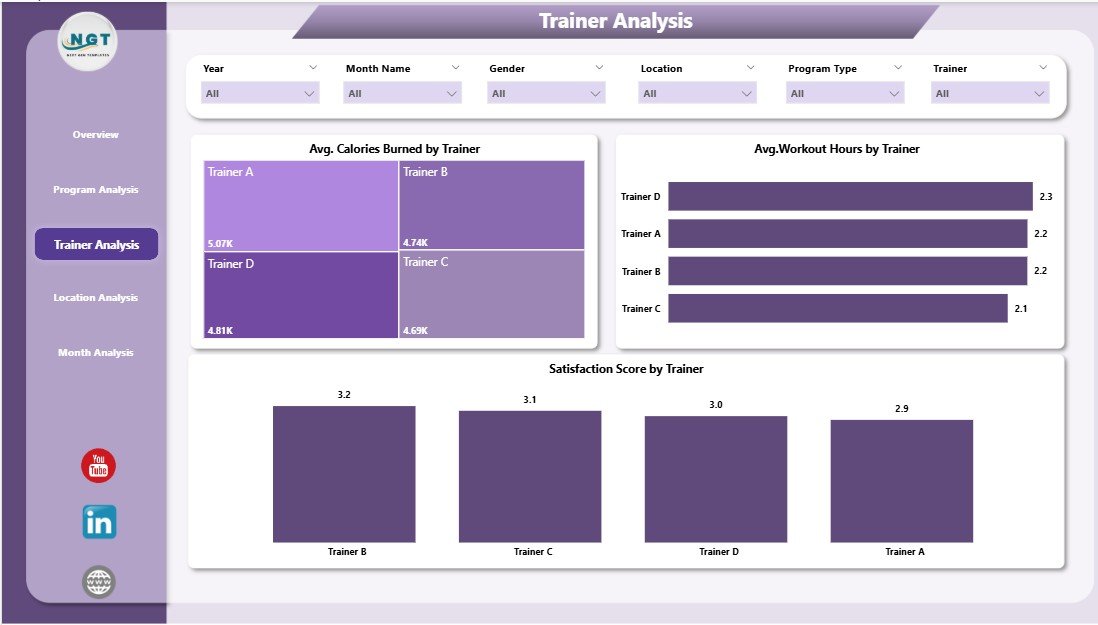
👨🏫 Trainer Performance Tracking – Measure engagement and satisfaction objectively
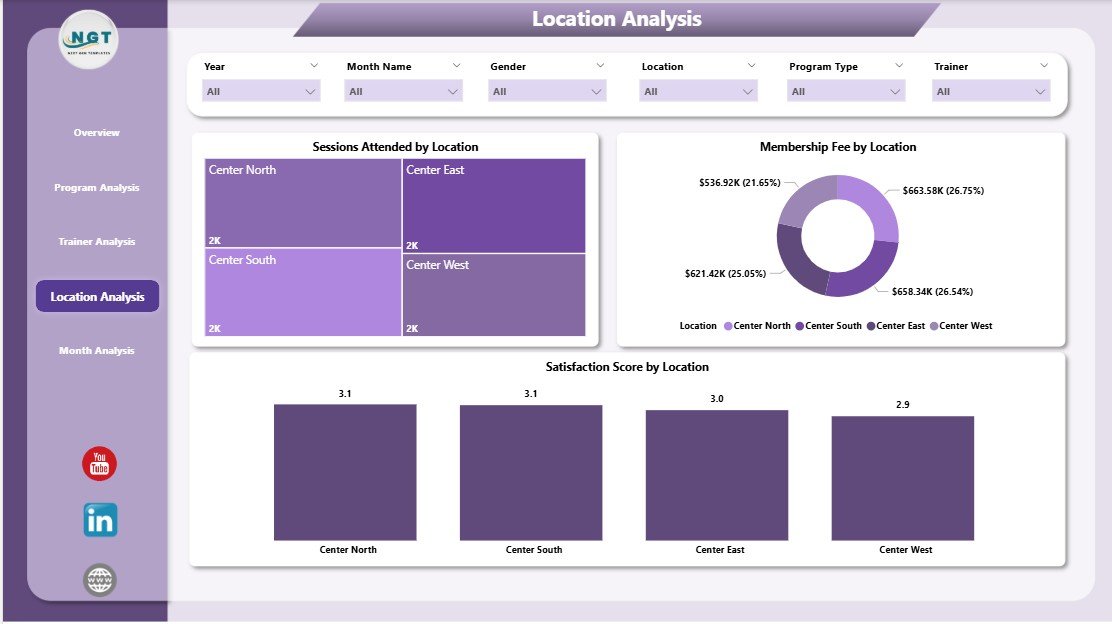
📍 Location-Wise Comparison – Compare performance across branches
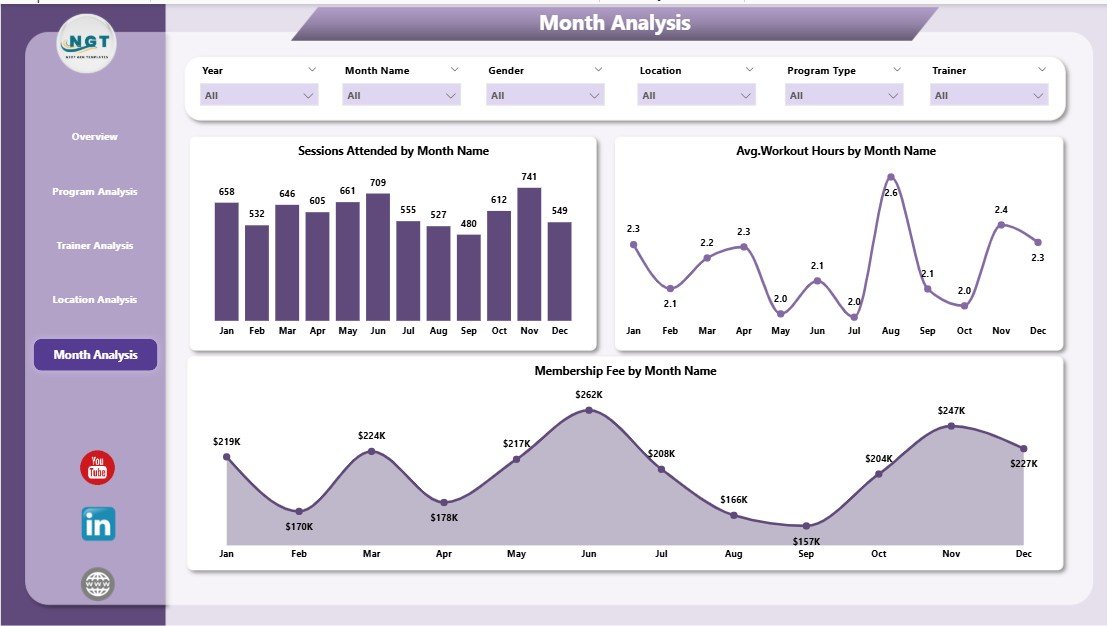
📅 Monthly Trend Analysis – Understand seasonality and growth patterns
💰 Membership Revenue Insights – Track income contribution clearly
⚡ Power BI Interactive Visuals – Drill-down analysis without complexity
📦 What’s Inside the Fitness and Wellness Dashboard in Power BI
📁 Power BI (.pbix) Dashboard File with clean, professional design
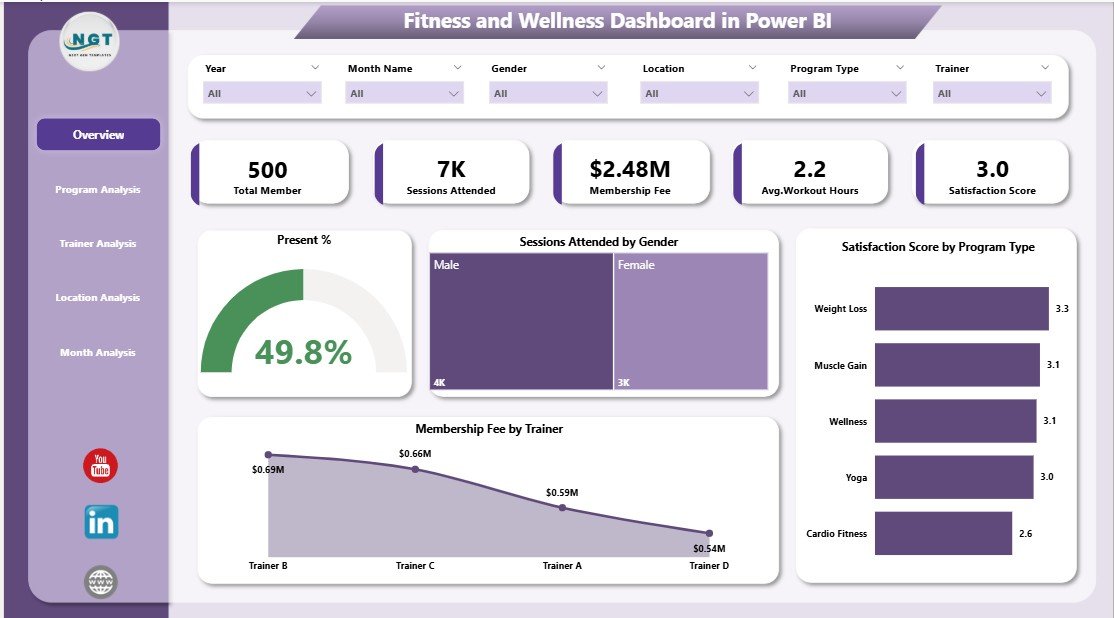
📊 Overview Page – High-level snapshot of fitness and wellness performance
🏋️ Program Analysis Page – Program-wise attendance, engagement, and revenue
👨🏫 Trainer Analysis Page – Trainer-wise performance and satisfaction insights
📍 Location Analysis Page – Branch-wise comparison of results and revenue
📆 Monthly Trends Page – Time-based analysis of attendance and fees
📄 Structured Data Model – Supports scalable and accurate reporting
Everything is designed for clarity, scalability, and business-ready decision-making.
🧠 How to Use the Fitness and Wellness Dashboard in Power BI
1️⃣ Prepare or update fitness and wellness data (attendance, fees, trainers, programs)
2️⃣ Load or connect the data to Power BI
3️⃣ Refresh the dashboard
4️⃣ Use interactive slicers to filter insights
5️⃣ Review KPIs and charts on each analysis page
6️⃣ Use trends and comparisons to improve programs, trainers, and revenue
No advanced Power BI skills are required. If you can use slicers, you can use this dashboard confidently.
👥 Who Can Benefit from This Fitness and Wellness Dashboard in Power BI
🏋️ Gym Owners & Fitness Center Managers – Monitor performance in real time
🧘 Wellness Program Coordinators – Track engagement and satisfaction
👨🏫 Personal Trainers & Team Leads – Review trainer-wise impact
📊 Operations & Admin Teams – Reduce manual reporting effort
💼 Business Owners & Executives – Get instant performance clarity
This dashboard works perfectly for small gyms, wellness studios, corporate fitness programs, and multi-location fitness chains.
🔗 Click here to read the Detailed Blog Post
🎥 Visit our YouTube channel to learn step-by-step video tutorials
https://www.youtube.com/@PKAnExcelExpert


Reviews
There are no reviews yet.