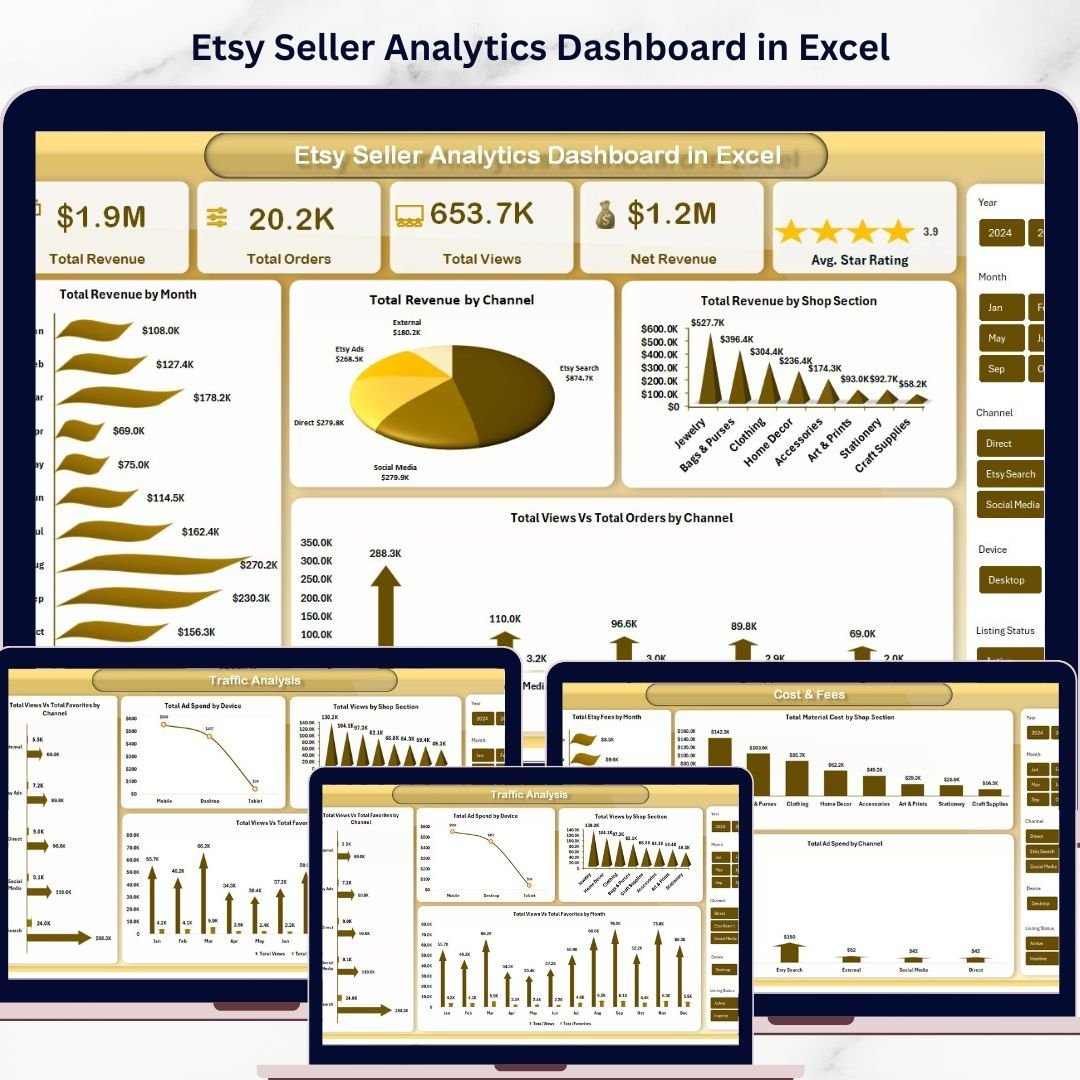
Etsy Seller Analytics Dashboard in Excel is a powerful, ready-to-use analytics solution designed specifically for Etsy shop owners who want to track revenue, orders, traffic, product performance, and advertising costs — all from one centralized Excel workbook. Instead of logging into multiple platforms or manually piecing together scattered reports, this dashboard brings every critical Etsy metric into a single interactive view with slicers, dynamic charts, and automated calculations.
Whether you are a full-time Etsy seller, a side hustle creator, or managing multiple Etsy shops, this Excel Dashboard Template helps you make smarter decisions faster. This template includes 5 interactive dashboard pages, 1 data sheet, and 1 support sheet — covering everything from revenue breakdowns to traffic analysis and cost tracking.
🔑 Key Features of Etsy Seller Analytics Dashboard in Excel
📊 5 Interactive Dashboard Pages – Overview, Sales Analysis, Traffic Analysis, Product Performance, and Cost & Fees pages provide a complete 360-degree view of your Etsy shop performance.
📈 Dynamic Slicers for Instant Filtering – Apply filters by month, channel, shop section, product category, country, and device to drill down into specific performance segments quickly.
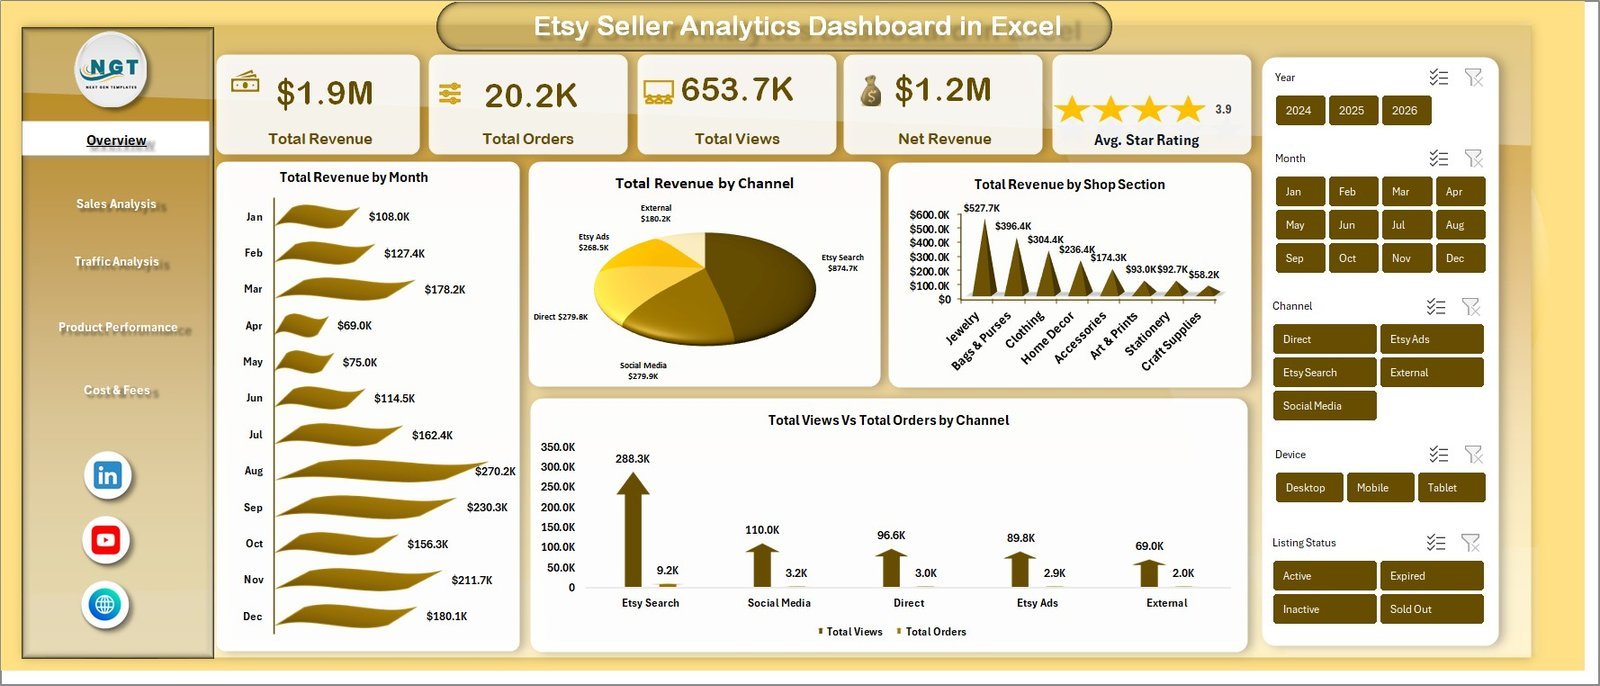
💰 Revenue & Order Tracking – Monitor Total Revenue, Total Orders, Net Revenue, and Total Views using high-level KPI cards on the Overview page.
⭐ Customer Satisfaction Metrics – Track Avg. Star Rating directly on the dashboard to gauge customer sentiment at a glance.
🔄 Fully Automated Pivot-Based Engine – All charts and KPIs update automatically when you refresh the data using Excel’s built-in Refresh All feature — no manual chart editing required.
🌍 Multi-Dimensional Analysis – Analyze revenue and orders by Product Category, Country, Device, Listing Status, Channel, and Shop Section for deeper business intelligence.
📉 Cost & Fee Tracking – Dedicated page to monitor Shipping Fees, Material Costs, and Ad Spend by month, section, and channel.
🎯 Beginner-Friendly Design – Simply replace the sample data in the Data sheet and click Refresh All. No advanced Excel skills or macros needed.

📦 What’s Inside the Etsy Seller Analytics Dashboard in Excel
This template contains 7 professionally built sheets that work together as a complete Etsy analytics system:
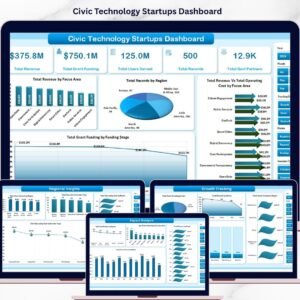
1️⃣ Overview Page – High-level KPI cards showing Total Revenue, Total Orders, Total Views, Net Revenue, and Avg. Star Rating. Charts include Total Revenue by Month, Total Revenue by Channel, Total Revenue by Shop Section, and Total Views vs Total Orders by Channel. Multiple slicers enable fast filtered views.
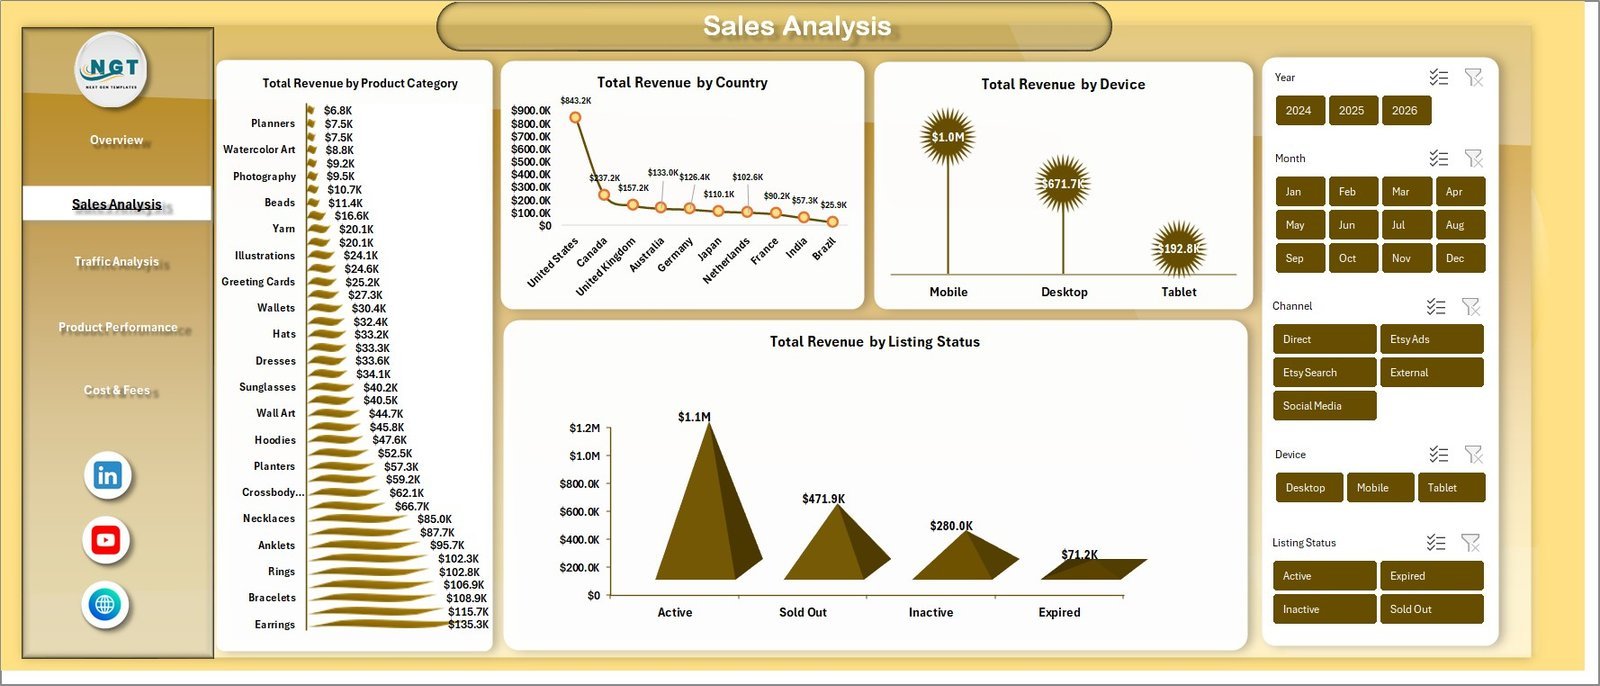
2️⃣ Sales Analysis Page – Deep dive into Total Revenue by Product Category, Total Revenue by Country, Total Revenue by Device, and Total Revenue by Listing Status.
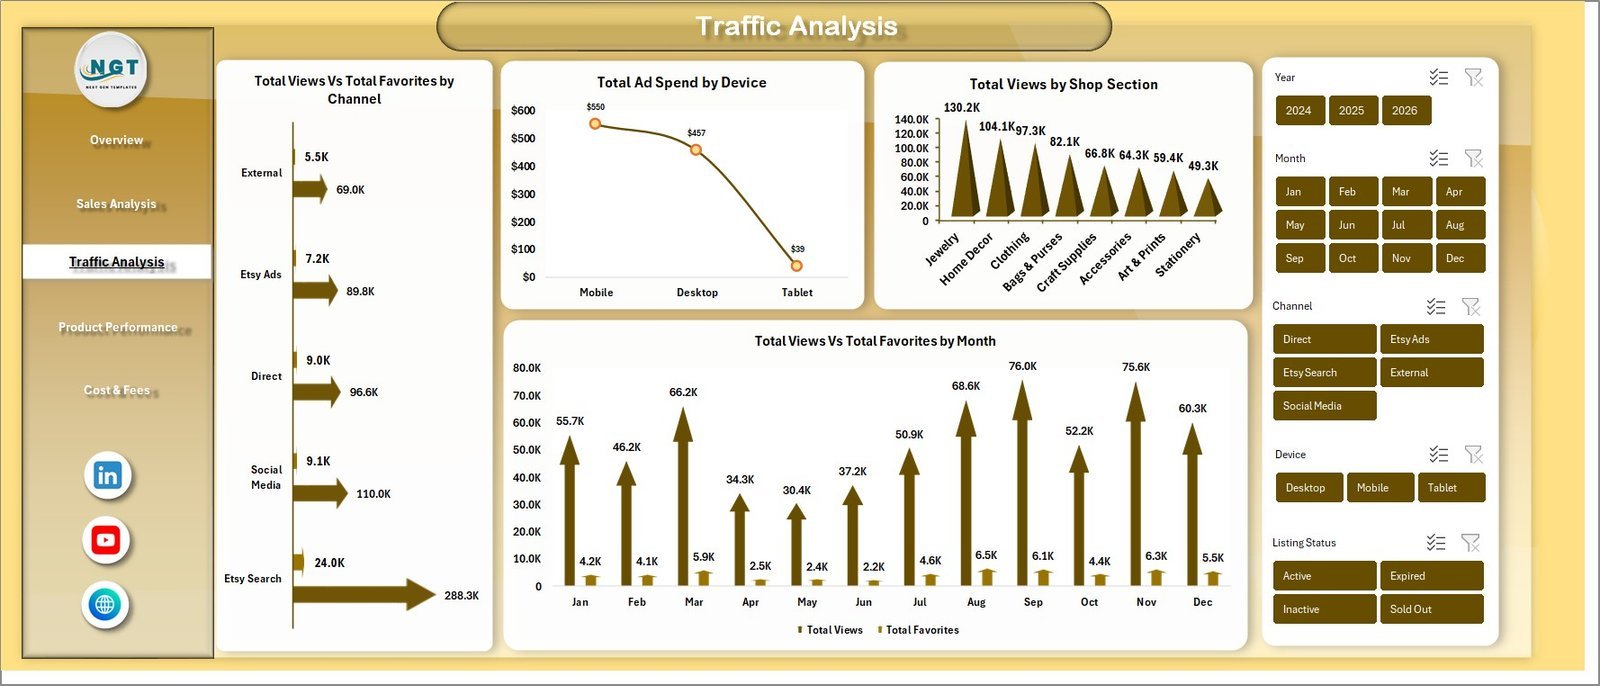
3️⃣ Traffic Analysis Page – Visualize Total Views vs Total Favorites by Channel, Total Ad Spend by Device, Total Views by Shop Section, and Total Views vs Total Favorites by Month.
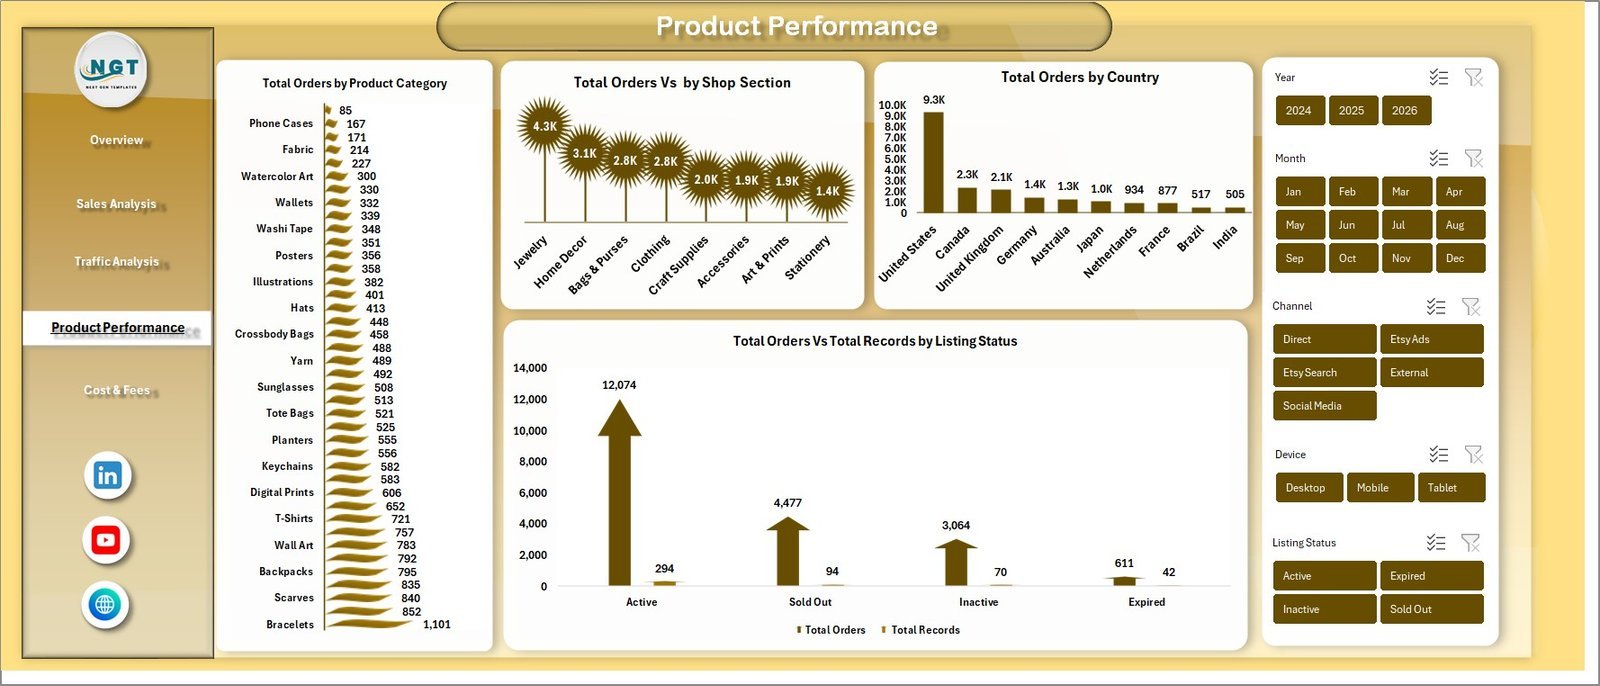
4️⃣ Product Performance Page – Analyze Total Orders by Product Category, Total Orders by Shop Section, Total Orders by Country, and Total Orders vs Total Reviews by Listing Status.
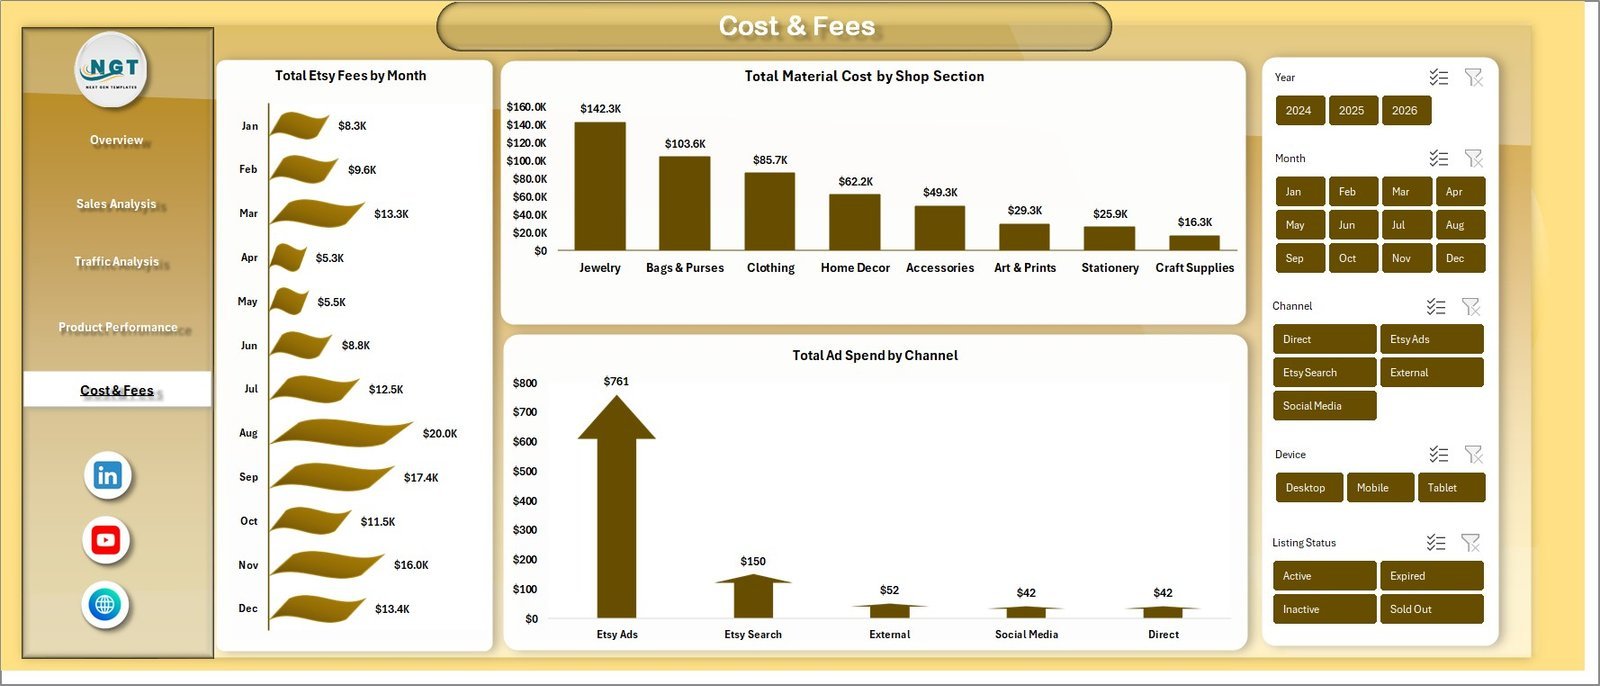
5️⃣ Cost & Fees Page – Track Total Ship Fee by Month, Total Material Cost by Shop Section, and Total Ad Spend by Channel to control operational expenses.
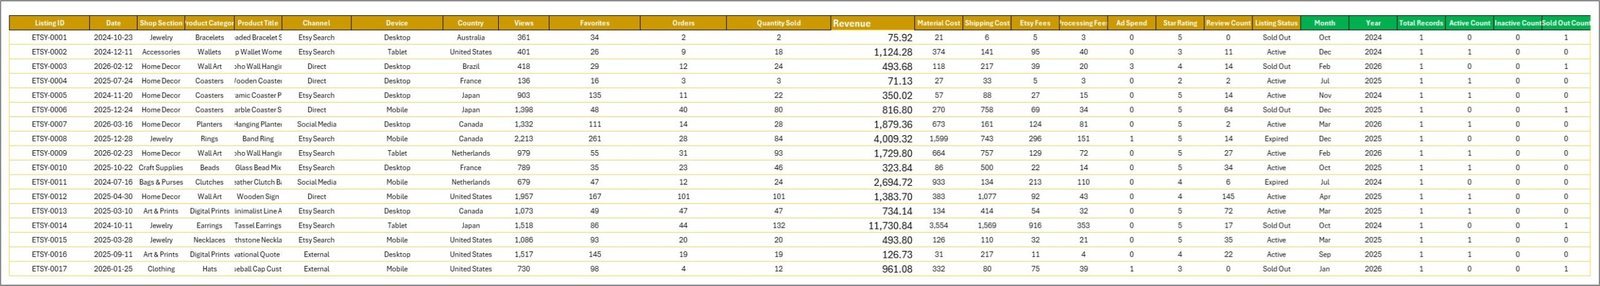
6️⃣ Data Sheet – This is where you enter your Etsy shop data. Simply paste your data in the same format as the sample and refresh. All dashboards update instantly.
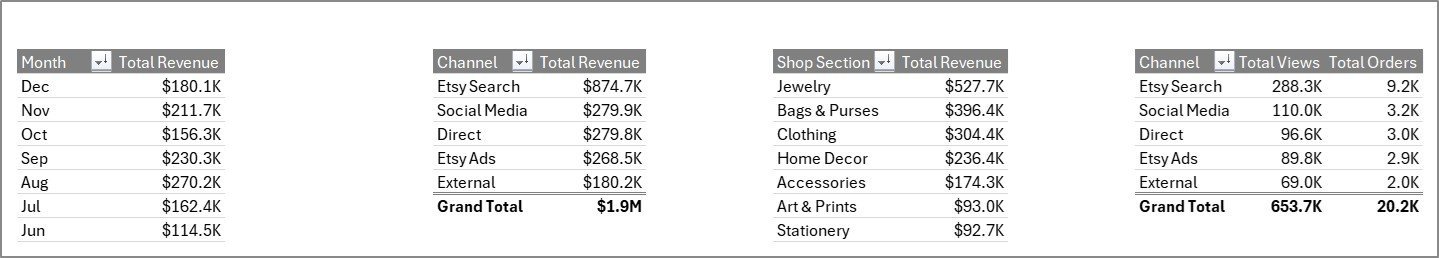
7️⃣ Support Sheet – Contains all pivot tables powering the dashboard. After updating data, go to Data tab → Refresh All. Keep this sheet hidden during regular use.
⚙️ How to Use the Etsy Seller Analytics Dashboard in Excel
1️⃣ Download and open the file in Microsoft Excel (desktop version recommended).
2️⃣ Go to the Data Sheet and replace the sample data with your actual Etsy shop data in the same column format.
3️⃣ Navigate to the Data tab in the Excel Ribbon and click Refresh All.
4️⃣ All pivot tables, charts, and KPI cards across all 5 dashboard pages update automatically.
5️⃣ Use slicers on each page to filter by month, channel, product category, country, or device.
👥 Who Can Benefit from This Etsy Seller Analytics Dashboard
🛒 Etsy shop owners tracking sales, traffic, and ad performance
📊 E-commerce analysts monitoring multi-channel marketplace data
🏢 Small business owners selling handmade or vintage products on Etsy
🎨 Creative entrepreneurs analyzing product category performance
📈 Marketing teams measuring ad spend effectiveness and ROI
💼 Freelancers and consultants managing Etsy client accounts
Explore more analytics tools in our Excel Dashboard Templates collection and our KPI Dashboard Templates library.
❓ Frequently Asked Questions
What metrics does the Etsy Seller Analytics Dashboard in Excel track?
The Etsy Seller Analytics Dashboard in Excel tracks Total Revenue, Total Orders, Total Views, Net Revenue, Avg. Star Rating, shipping fees, material costs, ad spend, and product performance across multiple dimensions including channel, country, device, product category, and shop section.
Do I need advanced Excel skills to use this Etsy dashboard template?
No. Simply replace the sample data in the Data Sheet with your own Etsy data and click Refresh All from the Data tab. All charts and KPIs update automatically without any formulas or VBA knowledge.
Can I use this dashboard for multiple Etsy shops?
Yes. You can consolidate data from multiple Etsy shops into the Data Sheet. The slicers and charts will analyze all data together, giving you a unified performance view across shops.
What is the best Excel dashboard for Etsy sellers?
The Etsy Seller Analytics Dashboard in Excel is purpose-built for Etsy sellers. It includes 5 interactive pages covering sales, traffic, product performance, and cost analysis — making it one of the most comprehensive Etsy analytics tools available in Excel format.
How do I refresh the dashboard after adding new data?
After updating your data in the Data Sheet, go to the Data tab on the Excel Ribbon and click Refresh All. Every pivot table, chart, and KPI card across all dashboard pages will update instantly.
Is this template compatible with Google Sheets?
This template is designed exclusively for Microsoft Excel (desktop version) as it uses pivot tables and slicers. For Google Sheets alternatives, check our Google Sheets Dashboard Templates.
🔗 Explore Related Templates
📌 Online Marketplaces KPI Scorecard in Excel – Track marketplace KPIs across Amazon, Flipkart, Etsy with performance scorecards.
📌 Ecommerce Conversion Rate KPI Dashboard in Excel – Monitor and optimize ecommerce conversion rates visually.
📌 Google Analytics KPI Dashboard in Excel – Analyze website traffic, sessions, bounce rate, and more.
📖 Click here to read the Detailed Blog Post
Watch the step-by-step video tutorial:


Reviews
There are no reviews yet.