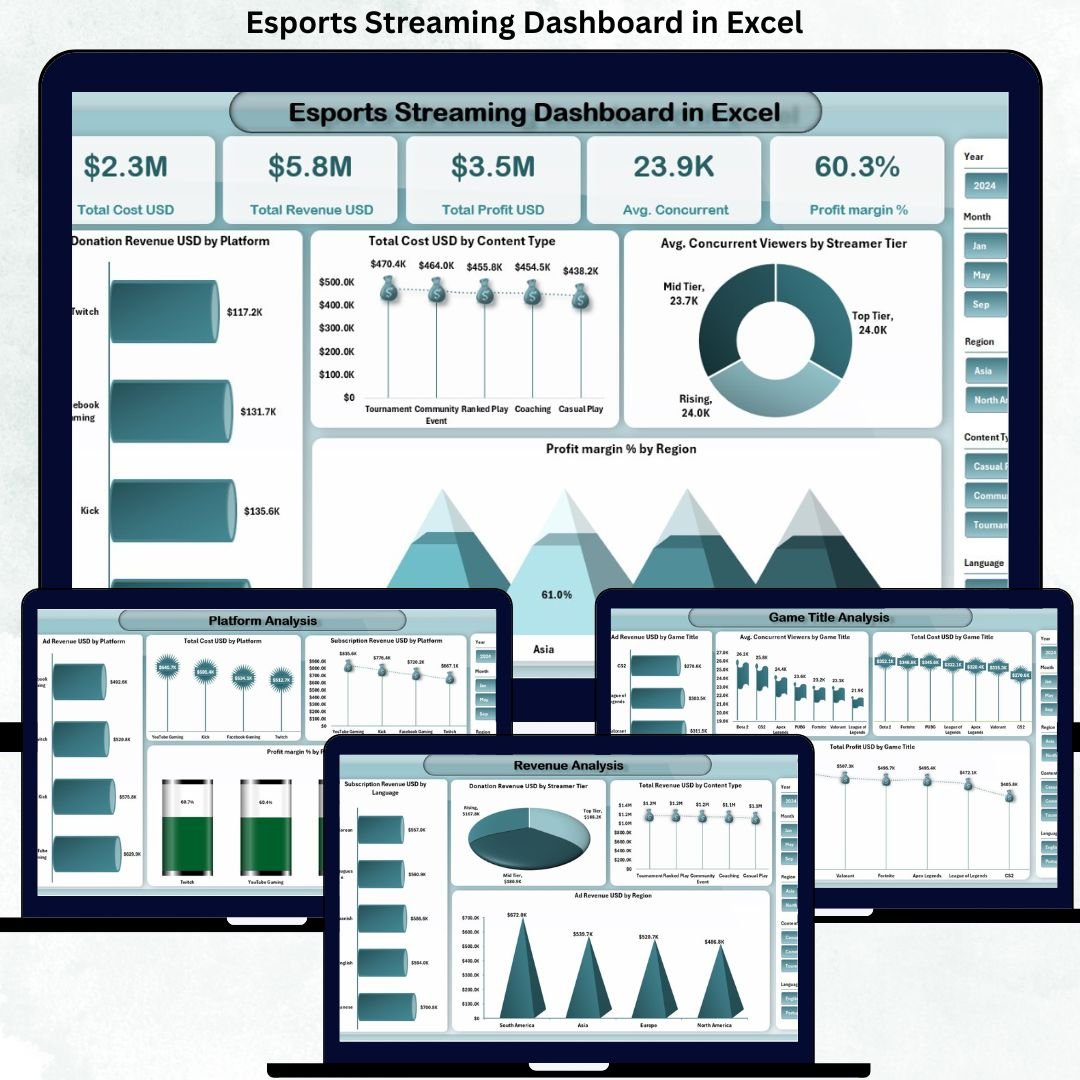
The esports’ streaming world is no longer driven by passion alone—it is driven by data, profitability, and audience intelligence. With millions of viewers, multiple platforms, diverse revenue streams, and rising costs, esports streamers and organizations must track performance precisely. Esports Streaming Dashboard in Excel However, relying on raw spreadsheets or platform dashboards often leads to fragmented insights and missed opportunities.
Esports Streaming Dashboard in Excel That is exactly where the Esports Streaming Dashboard in Excel becomes a powerful and practical solution.
This professionally designed Excel dashboard converts complex streaming data into clear, visual, and actionable insights. Instead of guessing which platform, game, or content type performs best, you gain full visibility into revenue, costs, viewers, and profit margins—all in one interactive Excel file.
🚀 Key Features of Esports Streaming Dashboard in Excel
📊 Fully Excel-Based Dashboard – No Power BI or advanced tools required
🧭 Page Navigator for Easy Access – Move between analysis pages instantly
🎯 KPI Cards for Instant Insights – Track cost, revenue, profit, viewers, and margin
📈 Revenue, Cost & Profit Analysis – Understand true financial performance
👀 Viewer Engagement Tracking – Analyze average concurrent viewers by segment
🎮 Game & Platform Performance Analysis – Identify what really drives growth
📅 Monthly Trend Analysis – Spot seasonal patterns and growth opportunities
🎛️ Interactive Slicers – Filter insights by platform, region, game, or month
📦 What’s Inside the Esports Streaming Dashboard
This Excel product includes five well-structured dashboard pages; each focused on a critical aspect of esports streaming analytics.
🔹 Overview Page
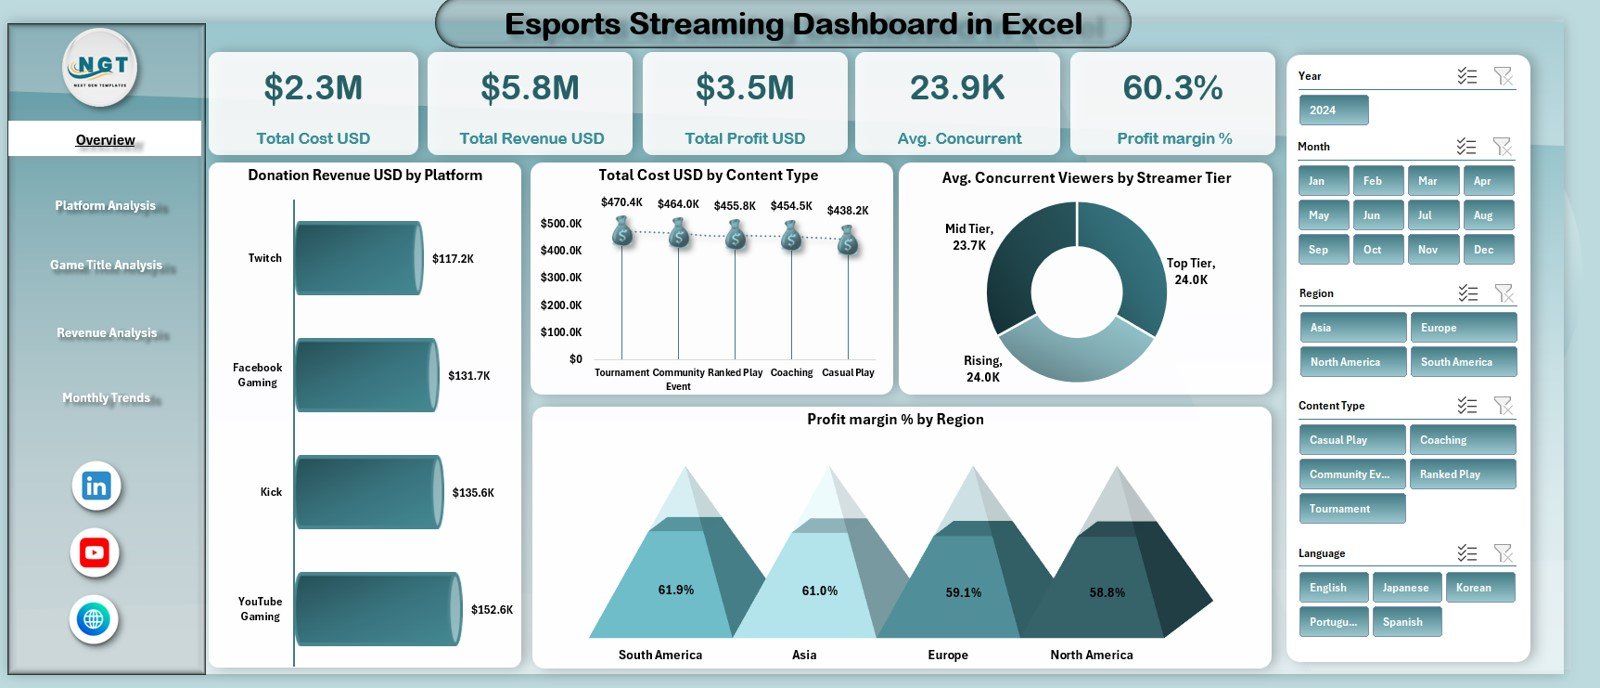
The central performance snapshot showing:
-
Total Cost (USD)
-
Total Revenue (USD)
-
Total Profit (USD)
-
Average Concurrent Viewers
-
Profit Margin (%)
It also includes charts for donations, costs, viewers, and profit margin by different dimensions.
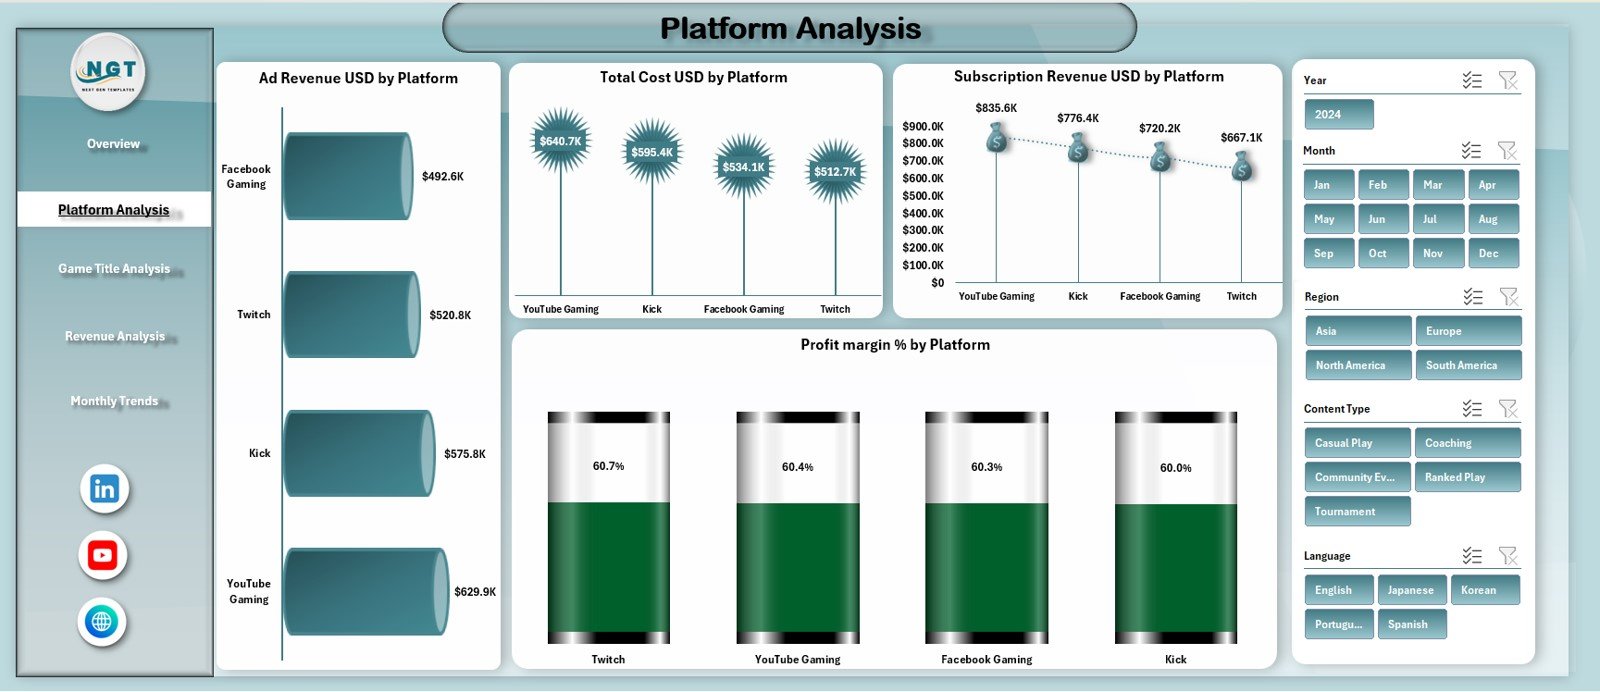
🔹 Platform Analysis Page
Compares performance across streaming platforms using:
-
Ad Revenue by Platform
-
Subscription Revenue by Platform
-
Total Cost by Platform
-
Profit Margin by Platform
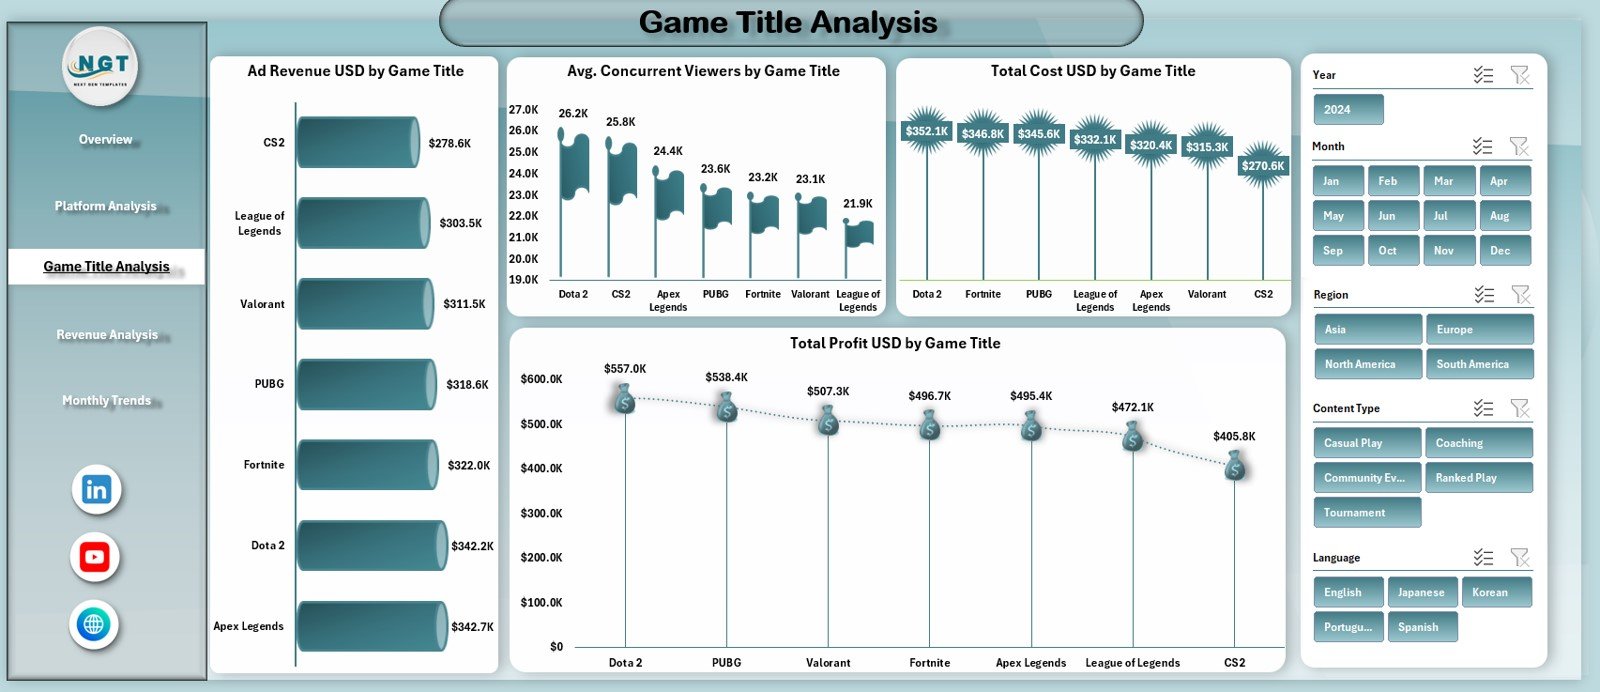
🔹 Game Title Analysis Page
Highlights which esports titles deliver the best results using:
-
Revenue, Cost, and Profit by Game Title
-
Average Concurrent Viewers by Game
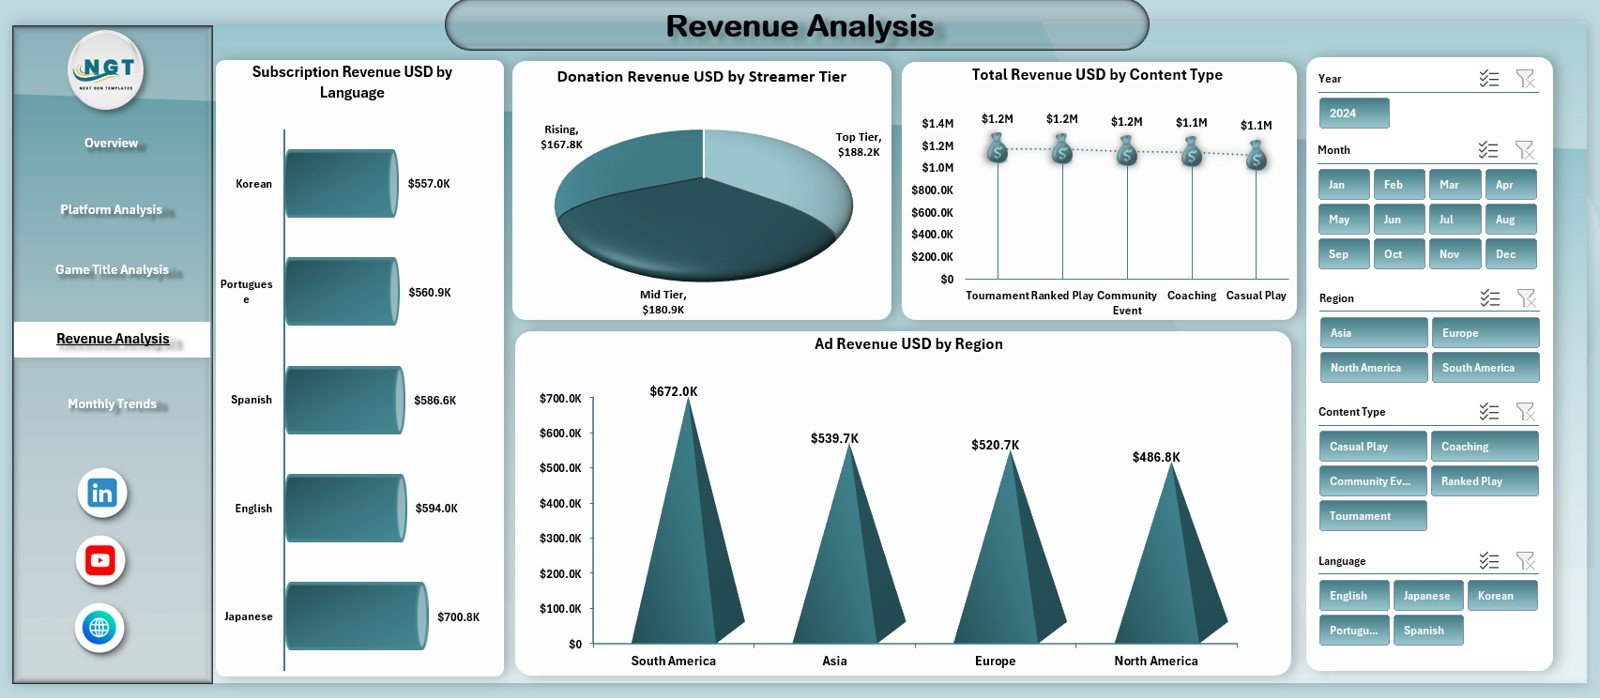
🔹 Revenue Analysis Page
Focuses on monetization performance with charts such as:
-
Subscription Revenue by Language
-
Donation Revenue by Streamer Tier
-
Total Revenue by Content Type
-
Ad Revenue by Region
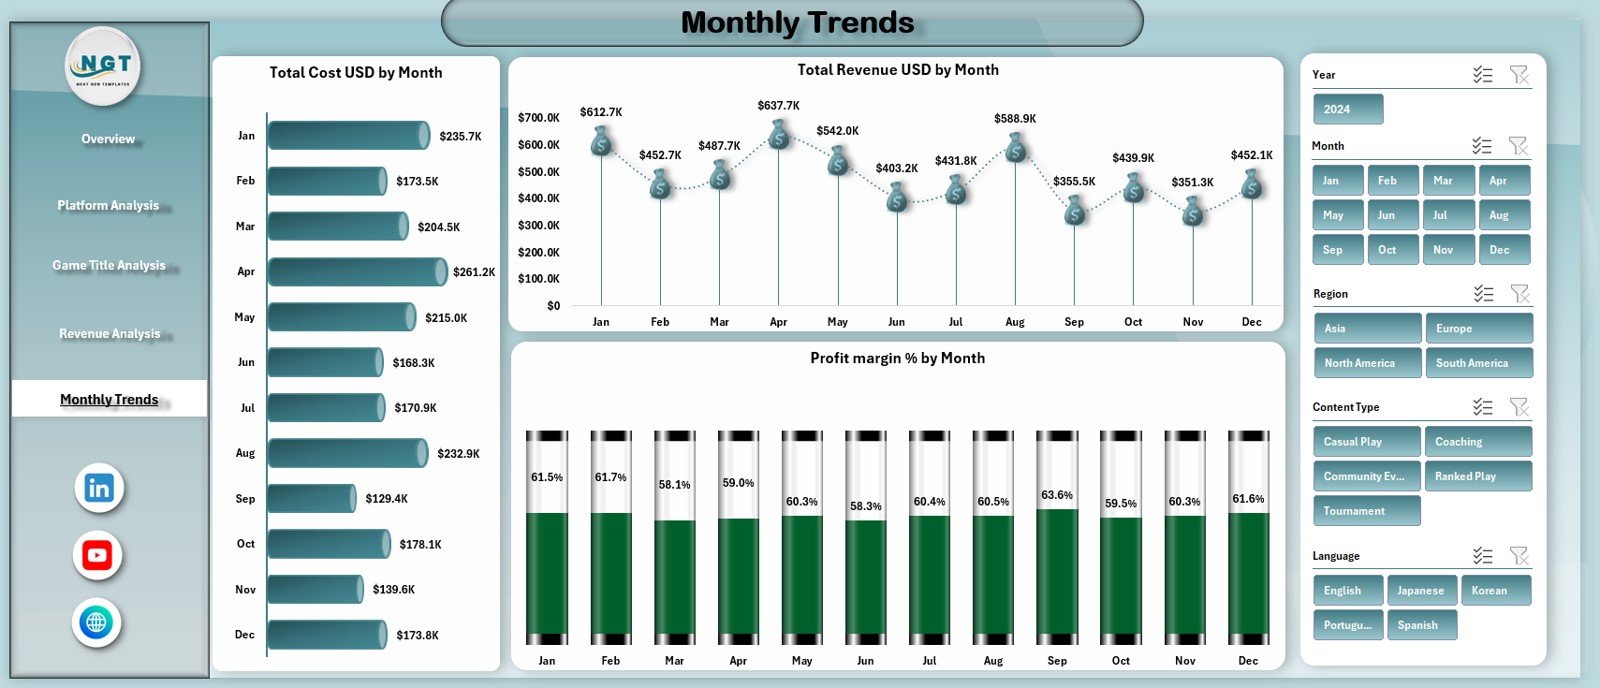
🔹 Monthly Trends Page
Shows performance over time with:
-
Total Cost by Month
-
Total Revenue by Month
-
Profit Margin (%) by Month
Supporting sheets include a Data Sheet for raw inputs and a Support Sheet for backend calculations.
🛠️ How to Use the Esports Streaming Dashboard
Using this dashboard is simple and beginner friendly.
1️⃣ Enter streaming data into the Data Sheet
2️⃣ Refresh pivot tables if required
3️⃣ Use slicers to filter by platform, game, region, or month
4️⃣ Analyze KPIs, charts, and trends across all pages
5️⃣ Use insights to optimize content, platforms, and monetization
Because everything runs in Excel, updates are fast, flexible, and cost-effective.
👥 Who Can Benefit from This Esports Streaming Dashboard?
This dashboard is ideal for:
🎮 Esports Streamers
📺 Content Creators & Influencers
🏆 Esports Organizations
📊 Gaming Analysts & Managers
💼 Sponsorship & Monetization Teams
🌍 Multi-platform Streaming Networks
If you want clarity, profitability, and smarter growth decisions, this dashboard is built for you.
🔎 Click here to read the Detailed blog post
👉 Visit our YouTube channel to learn step-by-step video tutorials


Reviews
There are no reviews yet.