Environmental, Social, and Governance (ESG) compliance is no longer just a reporting requirement—it is a strategic priority. Regulators demand transparency, investors expect accountability, and customers prefer responsible organizations. ESG Compliance KPI Dashboard in Power BI However, many companies still struggle with fragmented ESG data, manual reporting, and delayed insights. As a result, ESG tracking often becomes reactive instead of proactive.
That is exactly where the ESG Compliance KPI Dashboard in Power BI delivers powerful value.
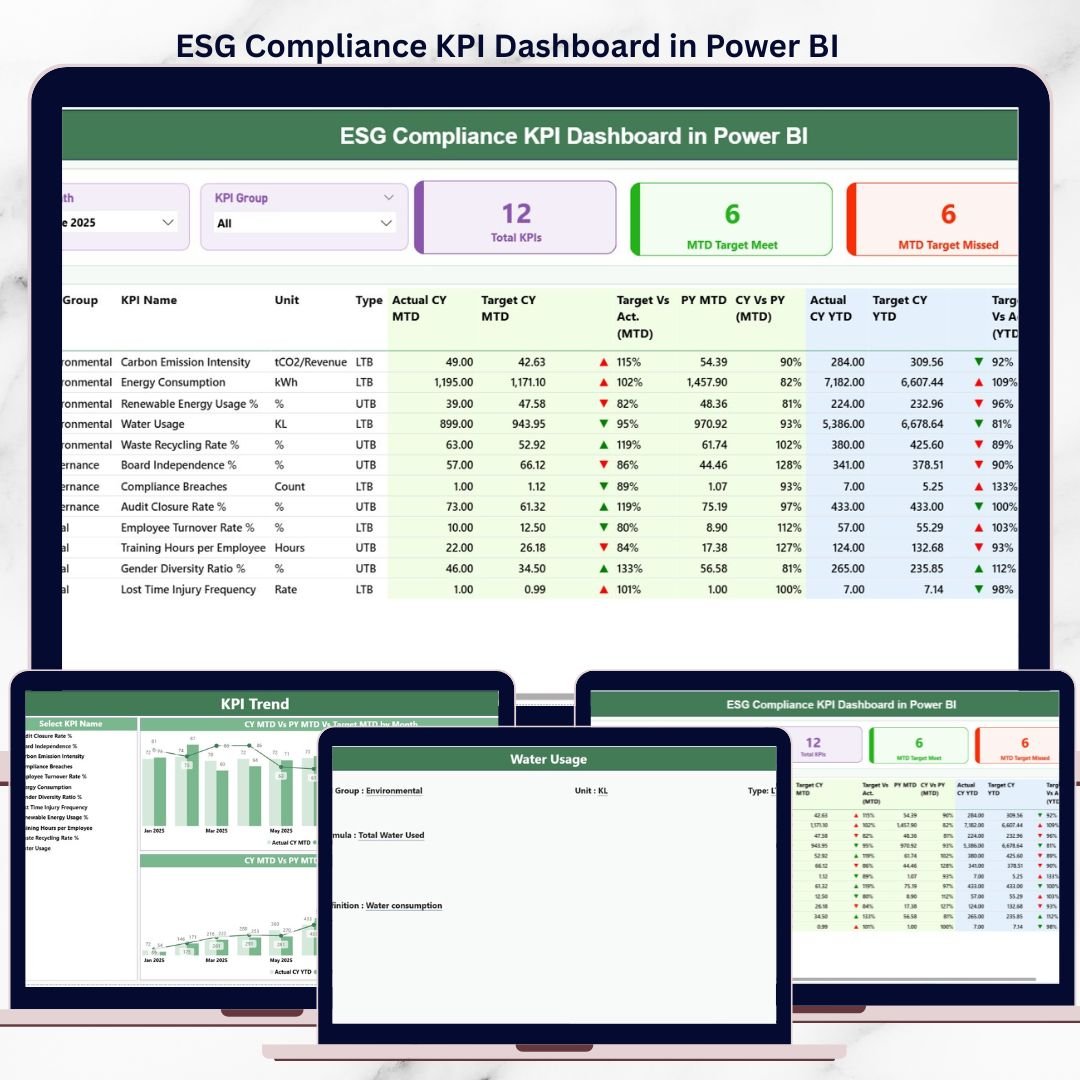
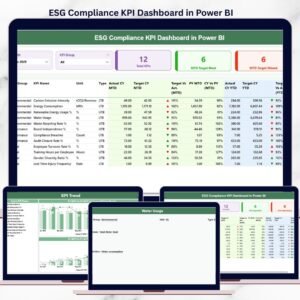
ESG Compliance KPI Dashboard in Power BI This ready-to-use Power BI dashboard converts raw ESG data into clear, interactive, and decision-ready insights. Instead of reviewing static reports or disconnected Excel files, organizations can now track ESG KPIs in real time, compare performance against targets, and monitor trends across months and years—all from a single dashboard.
Designed for clarity, compliance, and confidence, this dashboard helps organizations strengthen ESG governance while enabling faster, data-driven decisions.
✅ Key Features of ESG Compliance KPI Dashboard in Power BI
-
🌱 Centralized ESG Performance Monitoring – Track Environmental, Social, and Governance KPIs in one dashboard
-
🎛️ Month & KPI Group Slicers – Filter ESG performance instantly by period or category
-
🎯 MTD & YTD Performance Tracking – Monitor short-term progress and long-term ESG goals
-
🔄 Actual vs Target & CY vs PY Analysis – Identify compliance gaps and improvements clearly
-
⬆️⬇️ Visual KPI Status Indicators – Green ▲ and red ▼ icons highlight ESG status instantly
-
📈 Interactive KPI Trend Analysis – Analyze ESG trends using dynamic combo charts
-
🔍 Drill-Through KPI Definitions – Access formulas and definitions only when needed
📦 What’s Inside the ESG Compliance KPI Dashboard in Power BI
This Power BI solution includes three professionally designed pages, supported by a structured Excel data source.
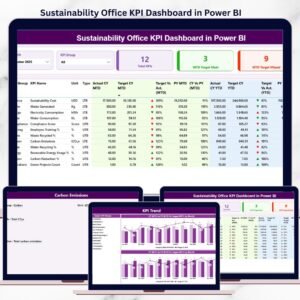
🧭 Summary Page
The main overview page that provides instant clarity on ESG performance.
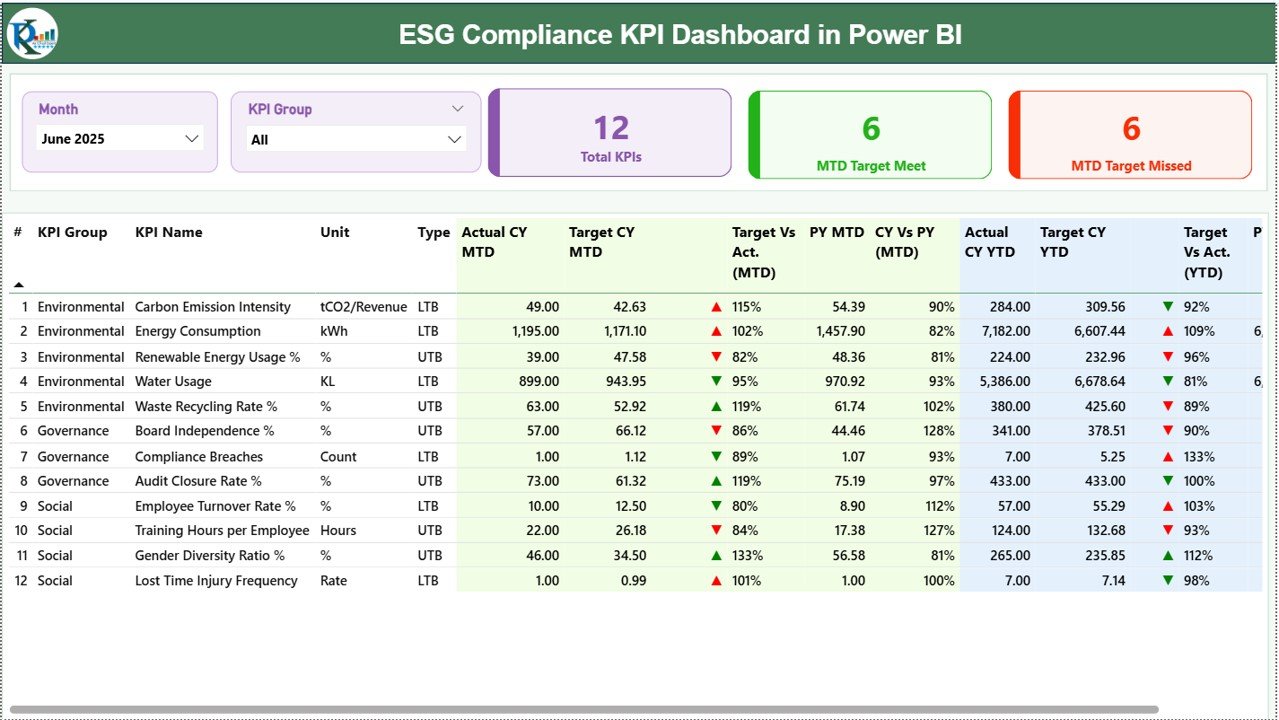
Key elements include:
-
Month slicer for period selection
-
KPI Group slicer (Environmental, Social, Governance)
-
KPI cards showing:
-
Total KPIs Count
-
MTD Target Meet Count
-
MTD Target Missed Count
-
-
A detailed KPI table displaying MTD, YTD, Target, Previous Year values, variance percentages, and status icons
This page allows leadership teams to understand ESG compliance health at a glance.
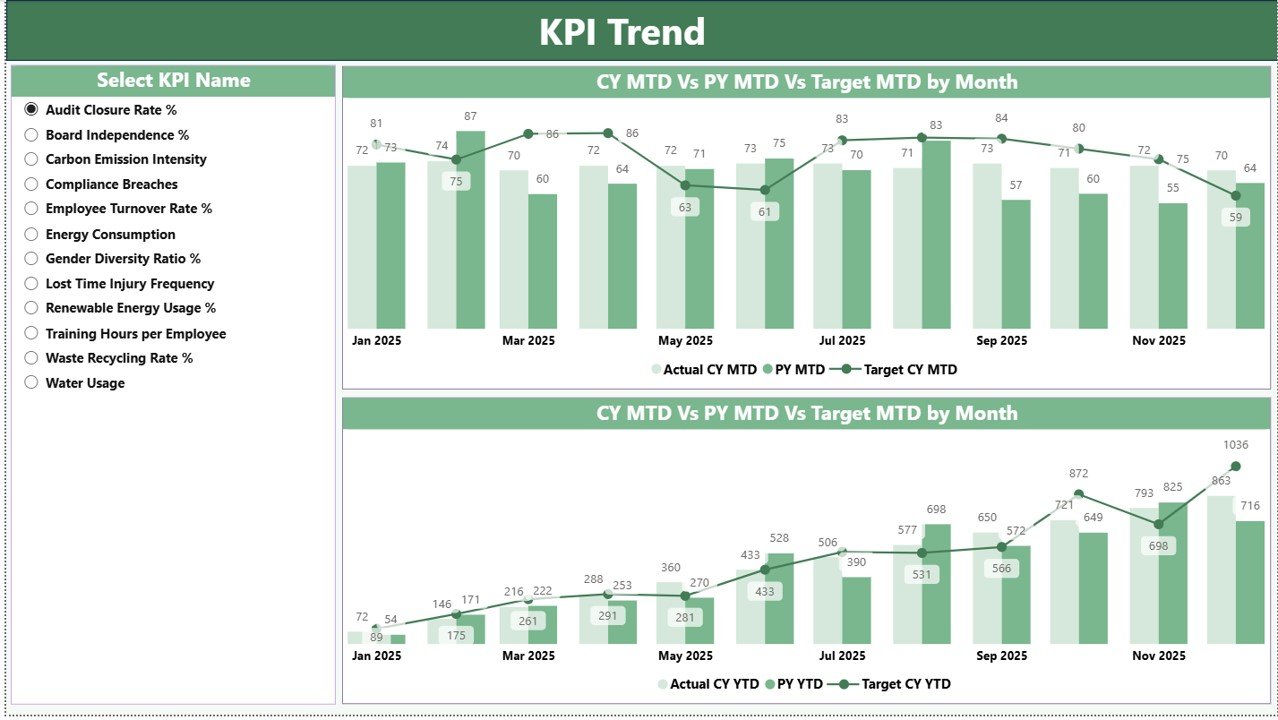
📈 KPI Trend Page
This page focuses on time-based ESG analysis.
Key highlights:
-
KPI Name slicer on the left
-
MTD combo chart (Actual, Target, Previous Year)
-
YTD combo chart (Actual, Target, Previous Year)
These visuals help teams identify patterns, risks, and improvement opportunities early.
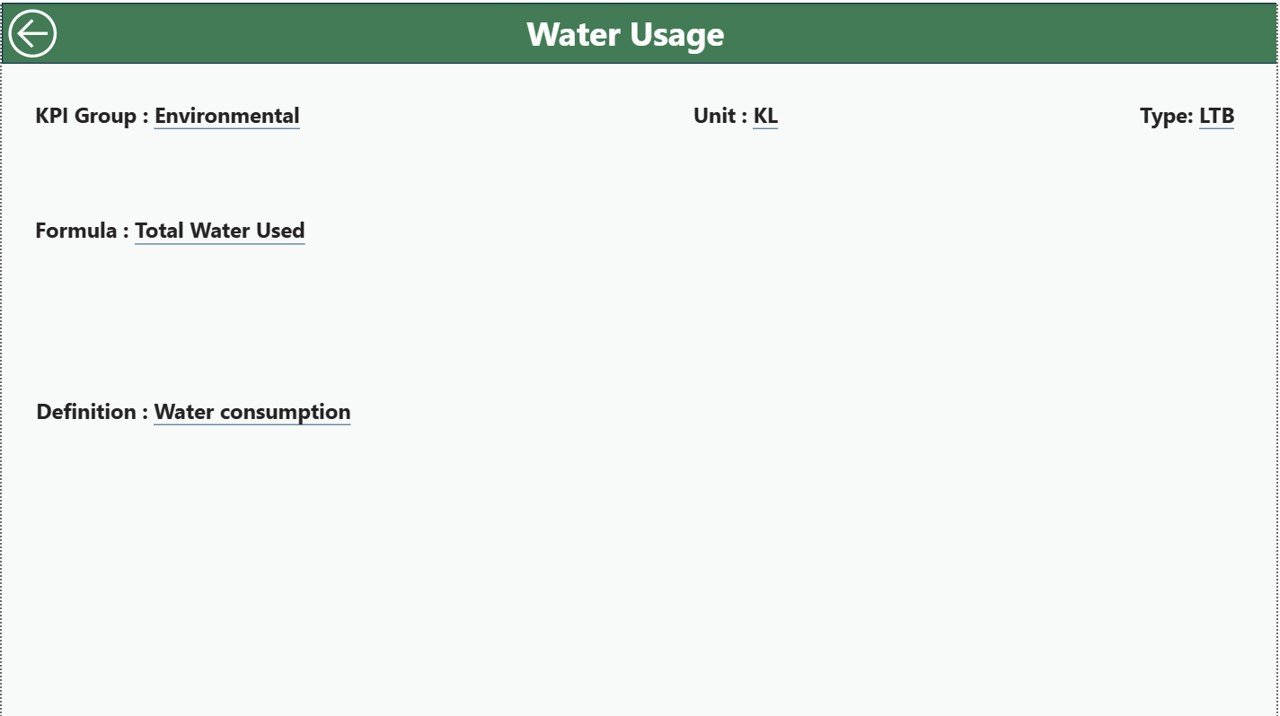
📘 KPI Definition Page (Drill-Through)
A hidden drill-through page that maintains governance and clarity.
Displays:
-
KPI Formula
-
KPI Definition
-
KPI Group, Unit, and Type (LTB / UTB)
-
Back button for easy navigation
This design keeps the dashboard clean while ensuring transparency—ideal for audits and reviews.
🛠️ How to Use the ESG Compliance KPI Dashboard in Power BI
Using the dashboard is simple and structured:
1️⃣ Maintain ESG actual, target, and previous year data in Excel
2️⃣ Refresh the Power BI dashboard
3️⃣ Select Month and KPI Group using slicers
4️⃣ Review MTD and YTD ESG performance instantly
5️⃣ Analyze trends, gaps, and improvements
6️⃣ Drill through for KPI definitions when required
No advanced Power BI development skills are required—basic Power BI usage is sufficient.
👥 Who Can Benefit from This ESG Compliance KPI Dashboard?
This Power BI dashboard is ideal for:
-
🌱 ESG & Sustainability Teams
-
📋 Compliance & Risk Officers
-
🧠 Corporate Governance Teams
-
💼 CFOs, CXOs & Leadership Teams
-
🏢 Organizations preparing ESG disclosures
It works equally well for SMEs and large enterprises.
📖 Click here to read the Detailed blog post
🎥 Visit our YouTube channel to learn step-by-step video tutorials
👉 Youtube.com/@PKAnExcelExpert


Reviews
There are no reviews yet.