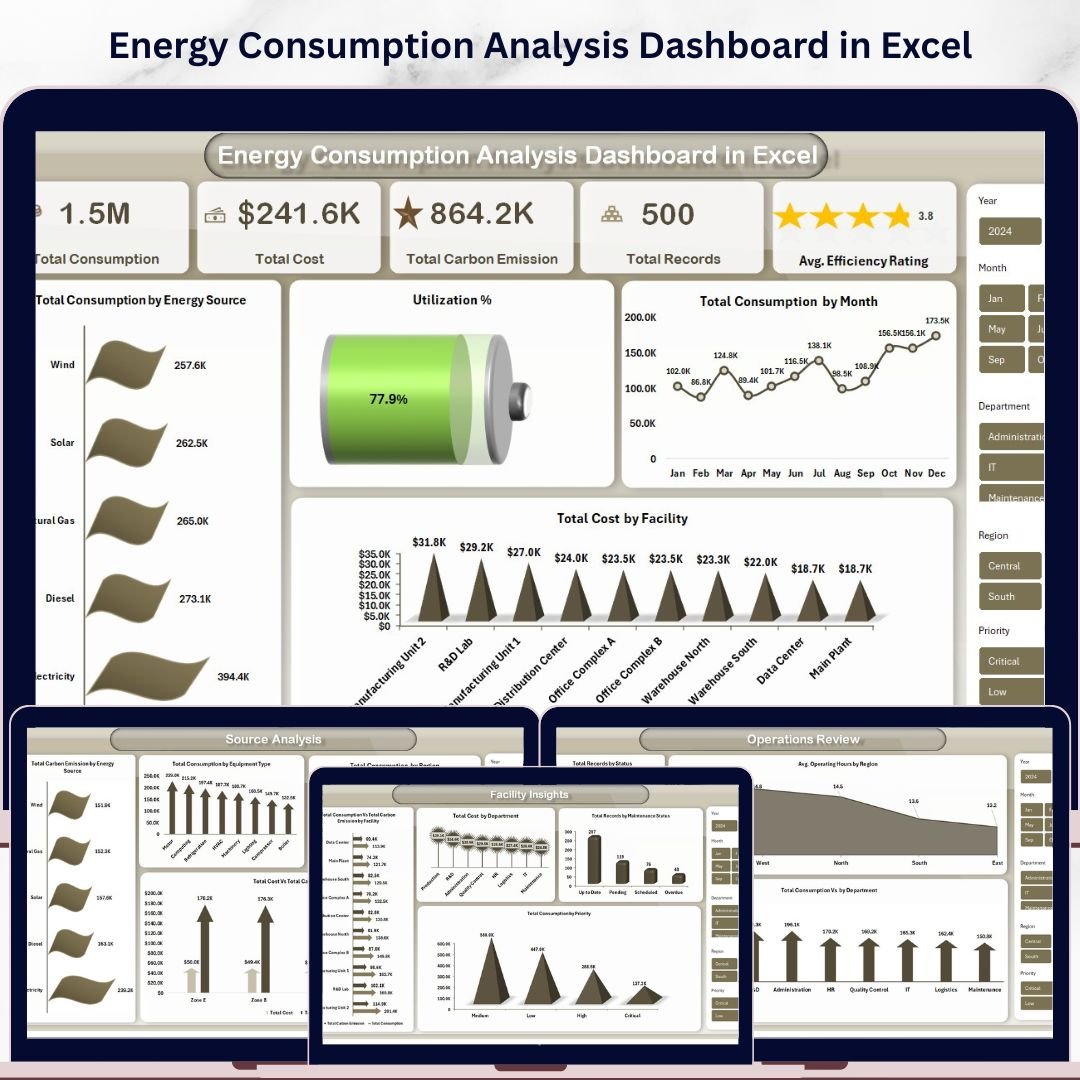
Energy Consumption Analysis Dashboard in Excel is a ready-to-use, interactive analytics template built for energy managers, facility operators, sustainability officers, and operations teams who need complete visibility into energy consumption, costs, carbon emissions, and operational efficiency — all from one centralized Excel Dashboard. This template includes 5 interactive dashboard pages covering Overview, Source Analysis, Facility Insights, Efficiency Trends, and Operations Review — powered by pivot tables and dynamic slicers for instant data exploration.
Whether you manage commercial facilities, industrial plants, or multi-site operations, this dashboard brings all your energy metrics into one powerful view. Instead of reviewing scattered spreadsheets and utility reports, decision-makers can instantly spot consumption trends, compare costs across facilities, track carbon emissions, and benchmark efficiency ratings. For an HTML-based alternative, explore the Energy Consumption Analysis Dashboard in HTML. If you manage building systems, check out the Building Automation Dashboard in Excel.
Energy Consumption Analysis Dashboard in Excel
🔑 Key Features of Energy Consumption Analysis Dashboard in Excel
⚡ 5 Interactive Dashboard Pages — Overview, Source Analysis, Facility Insights, Efficiency Trends, and Operations Review provide comprehensive energy analytics from every angle.
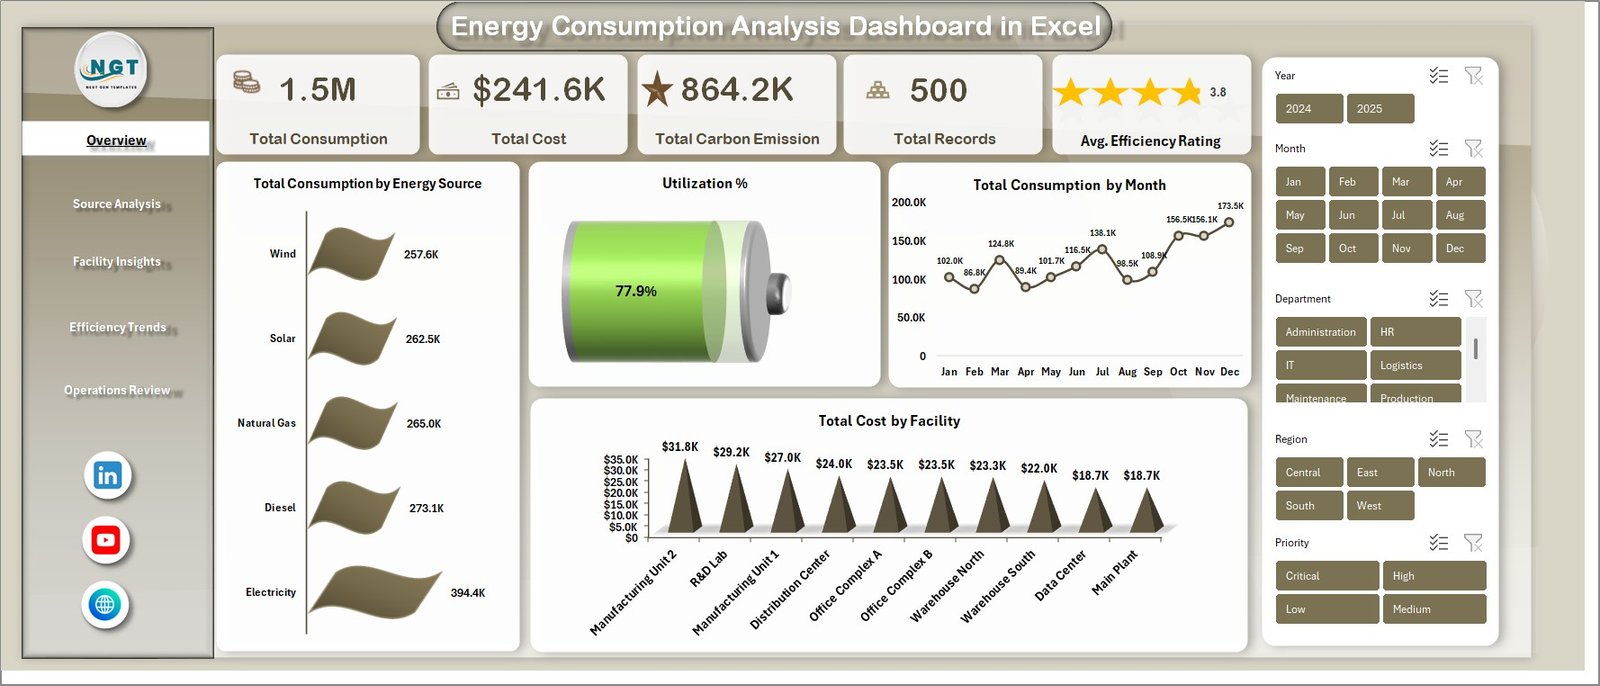
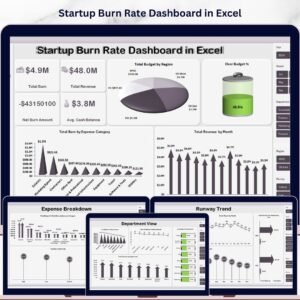
📊 High-Level KPI Cards — Instantly monitor Total Consumption, Total Cost, Total Carbon Emission, Total Records, and Avg. Efficiency Rating on the Overview page.
🔍 Dynamic Slicers and Filters — Filter the entire dashboard by energy source, region, department, facility, equipment type, status, and more with one click.
🌿 Carbon Emission Tracking — Track carbon emissions by energy source, zone, and facility to support environmental compliance and sustainability reporting goals.
📈 Efficiency Trend Analysis — Monitor average efficiency rating by month and facility, compare consumption vs. cost by year, and benchmark operating hours by equipment type.
🏢 Facility-Level Breakdown — Analyze total consumption vs. carbon emission by facility, total cost by department, maintenance status by records, and consumption by priority level.
📋 Pivot Table Powered Analytics — All charts and KPIs are driven by pivot tables in the Support sheet. Refresh All after data updates and the entire dashboard auto-refreshes.
🎨 Professional Design — Clean, modern chart layouts with consistent color themes that make stakeholder presentations effortless and impactful.
📦 What’s Inside the Energy Consumption Analysis Dashboard in Excel
This template contains 7 structured worksheets designed for comprehensive energy consumption analysis. The dashboard tracks 5 key performance indicators and includes over 15 interactive charts across 5 analytical pages.
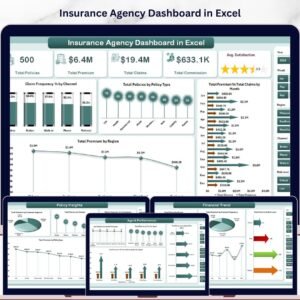
📊 Page 1 — Overview Page: The main command center displays KPI cards for Total Consumption, Total Cost, Total Carbon Emission, Total Records, and Avg. Efficiency Rating. Below the cards, interactive charts show Total Consumption by Energy Source revealing distribution across fuel types, Utilization % providing a quick efficiency snapshot, Total Consumption by Month tracking usage patterns over time, and Total Cost by Facility comparing spending across locations. Multiple slicers allow quick filtering across the entire dashboard.
⚡ Page 2 — Source Analysis: This page provides deep energy source performance analysis with charts for Total Carbon Emission by Energy Source tracking environmental impact per fuel type, Total Consumption by Equipment Type identifying high-consumption equipment categories, Total Consumption by Region showing geographic distribution, and Total Cost Vs Total Carbon Emission by Zone revealing cost-to-emission relationships across operational zones.
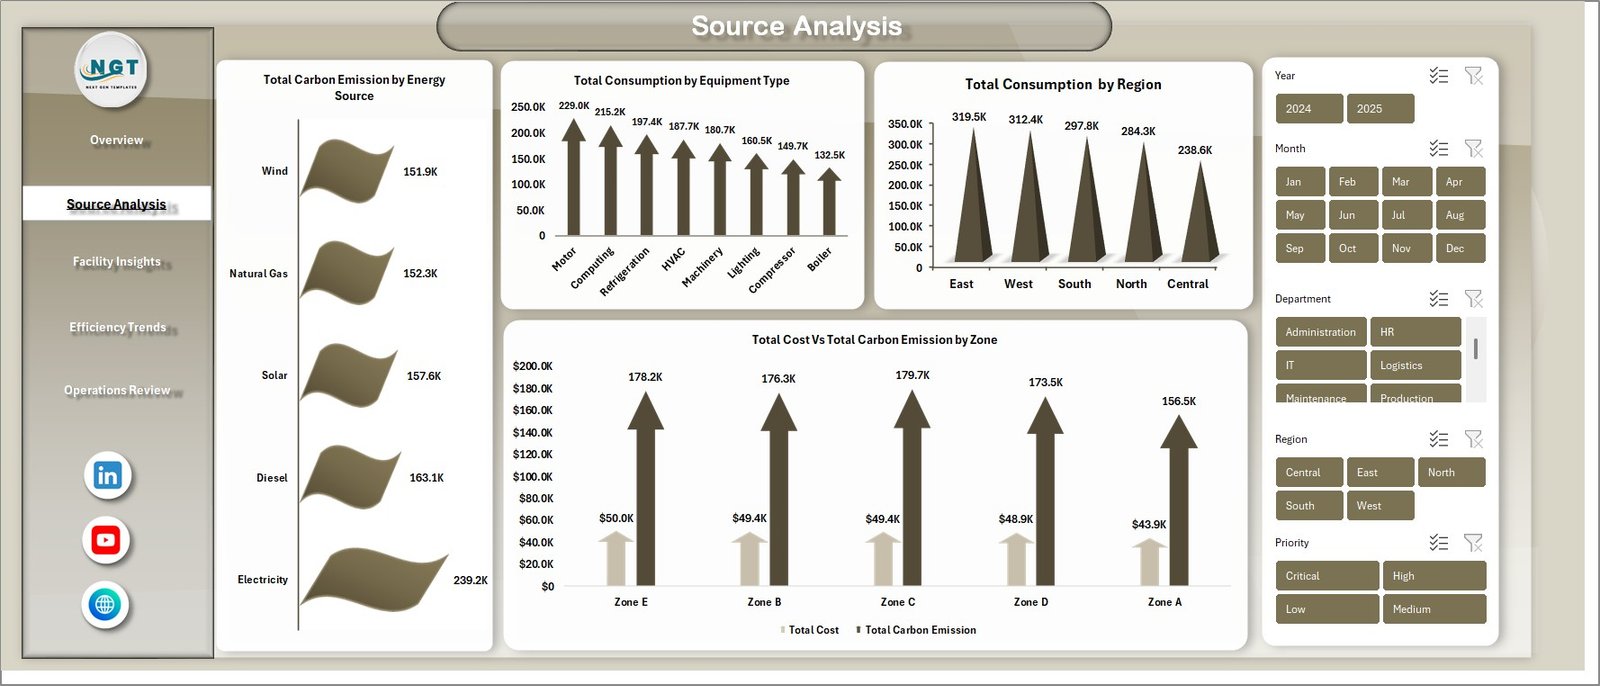
Source Analysis
🏢 Page 3 — Facility Insights: Analyze operational performance at the facility level with charts for Total Consumption Vs Total Carbon Emission by Facility comparing energy usage against environmental impact per location, Total Cost by Department revealing departmental spending patterns, Total Records by Maintenance Status monitoring equipment health, and Total Consumption by Priority highlighting consumption across priority levels.
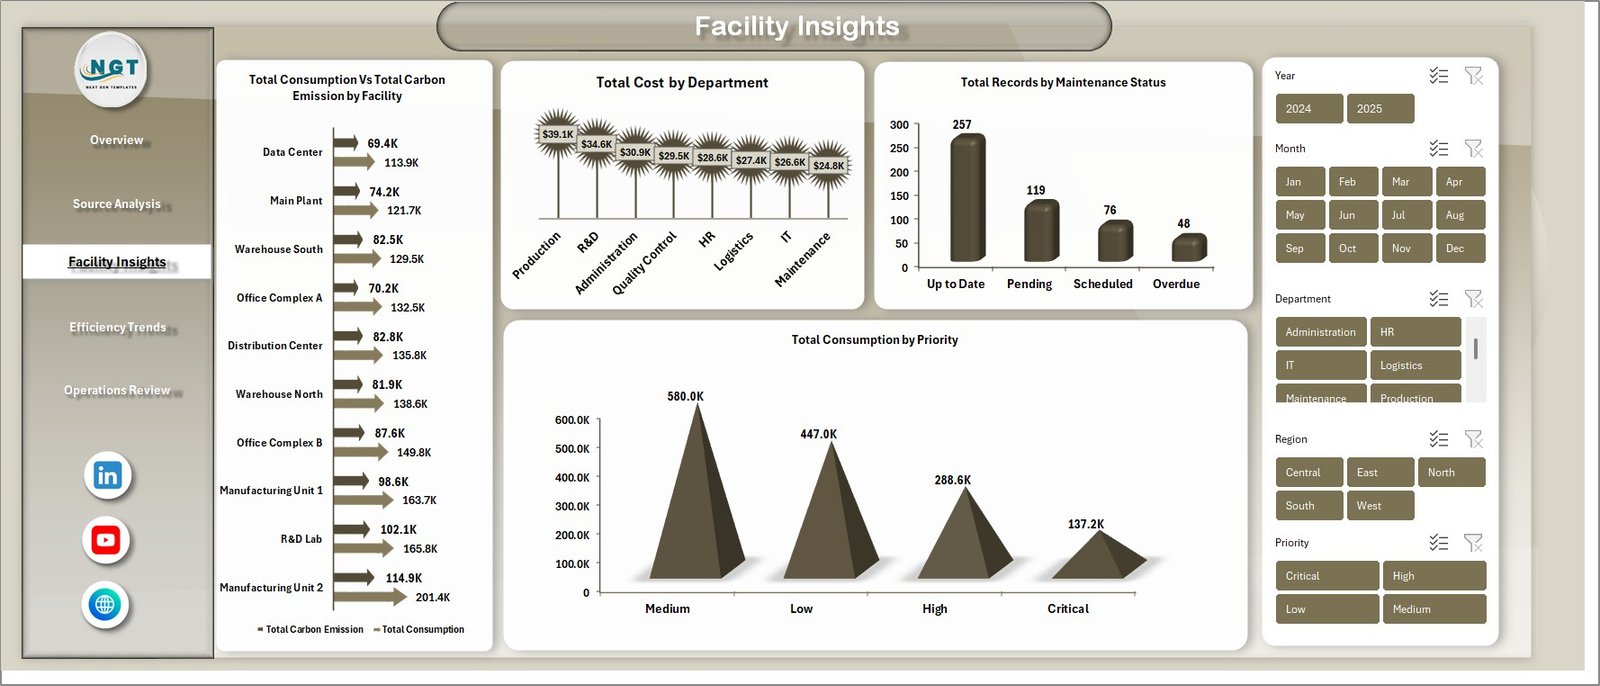
Facility Insights
📈 Page 4 — Efficiency Trends: Track efficiency performance over time with charts for Avg. Efficiency Rating by Month monitoring efficiency patterns month by month, Total Consumption Vs Total Cost by Year benchmarking annual performance, Avg. Operating Hours by Equipment Type comparing runtime across equipment categories, and Avg. Efficiency Rating by Facility ranking facilities by efficiency performance.
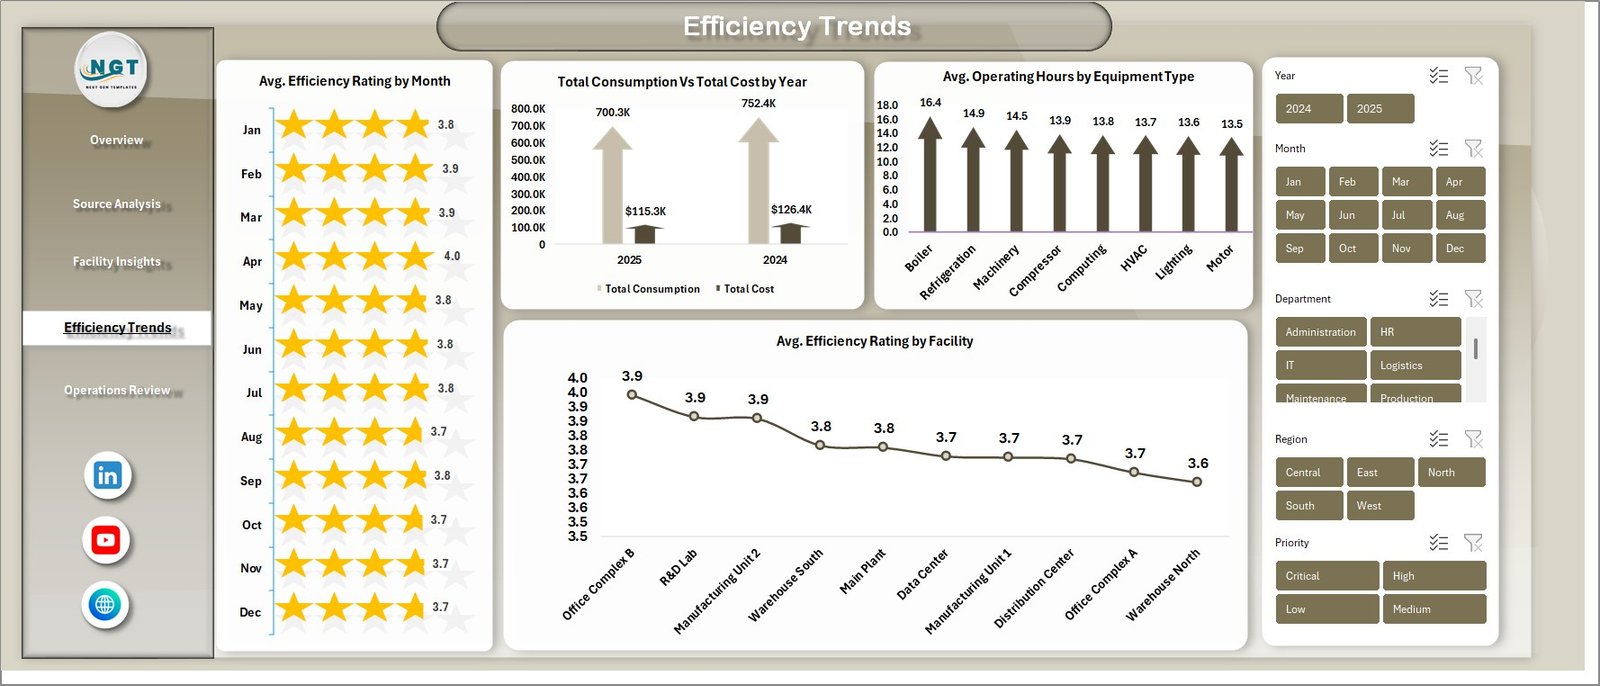
Efficiency Trends
📋 Page 5 — Operations Review: Get operational visibility with charts for Total Records by Status breaking down operational status distribution, Avg. Operating Hours by Region comparing runtime across geographic areas, and Total Consumption Vs by Department analyzing departmental consumption patterns.
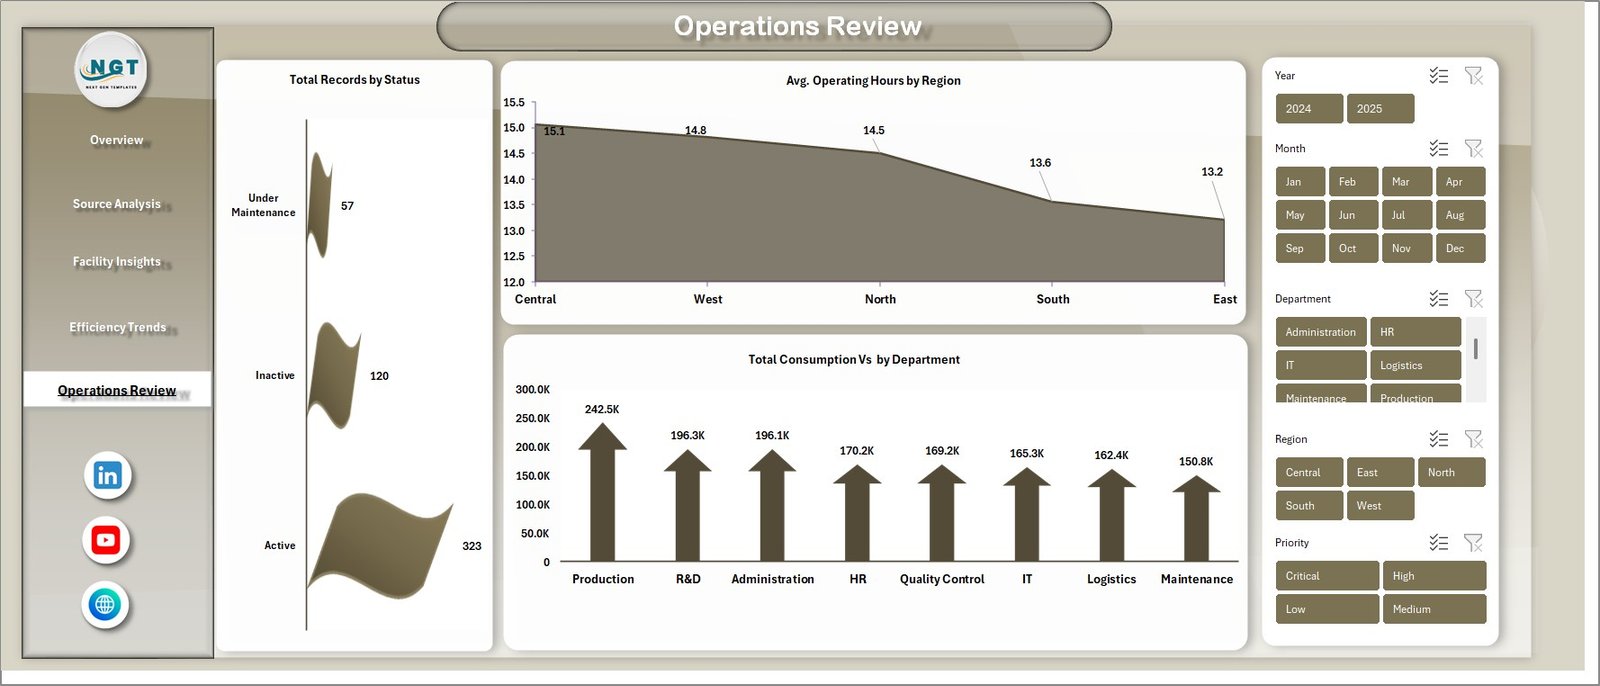
Operations Review
📂 Page 6 — Data Sheet: This is the main data sheet where you enter your energy consumption records in the structured format provided. All dashboard pages pull data from this sheet.
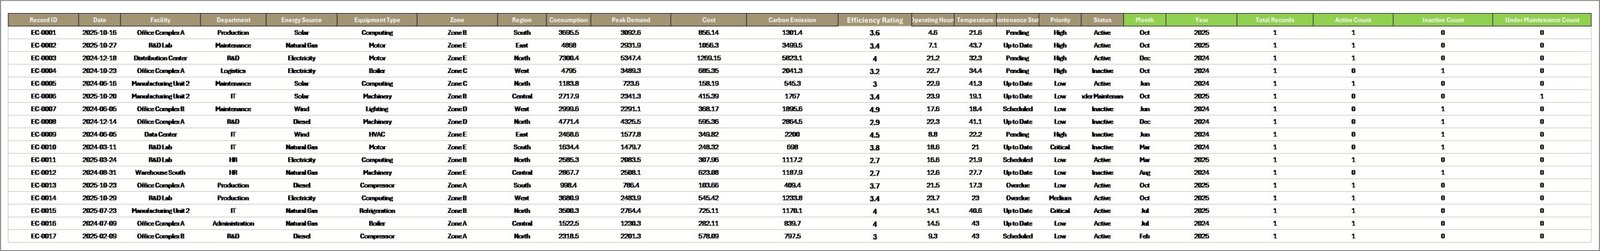
Data Sheet Tab
⚙️ Page 7 — Support Sheet: Contains all pivot tables that power the dashboard dynamically. After updating data in the Data Sheet, go to the Data tab in the Excel Ribbon and click Refresh All. All pivots and charts will refresh automatically. You can keep this sheet hidden.
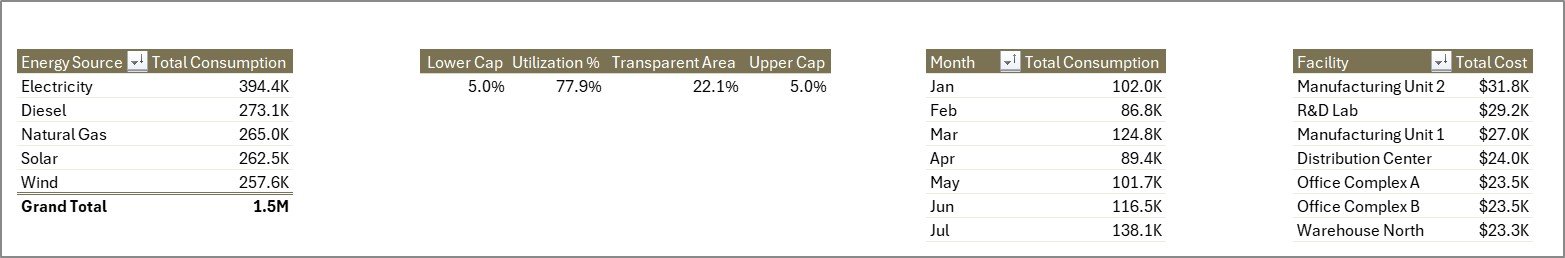
Support Sheet Tab
⚙️ How to Use the Energy Consumption Analysis Dashboard in Excel
1️⃣ Open the Excel file and navigate to the Data Sheet tab.
2️⃣ Replace the sample data with your own energy consumption records in the same column format.
3️⃣ Go to the Data tab in the Excel Ribbon and click Refresh All.
4️⃣ All pivot tables in the Support Sheet will refresh and all charts across all 5 dashboard pages will update automatically.
5️⃣ Use the slicers on each page to filter by energy source, region, facility, department, equipment type, and more.
6️⃣ Present the dashboard to stakeholders or use it for daily energy management reviews.
👥 Who Can Benefit from This Energy Consumption Analysis Dashboard
⚡ Energy Managers — Monitor consumption patterns, costs, and efficiency across all energy sources and facilities
🏢 Facility Operators — Track energy usage by facility, department, and equipment type for operational optimization
🌿 Sustainability Officers — Analyze carbon emissions by source and facility to meet environmental compliance targets
📊 Data Analysts — Generate actionable insights from energy performance data with interactive pivot-driven visualizations
🏭 Operations Directors — Compare efficiency trends by month and year to drive cost reduction strategies
🎓 Students and Researchers — Use the structured Excel dashboard for academic projects and energy analytics case studies
❓ Frequently Asked Questions
What KPIs does the Energy Consumption Analysis Dashboard in Excel track?
The Energy Consumption Analysis Dashboard in Excel tracks 5 key performance indicators including Total Consumption, Total Cost, Total Carbon Emission, Total Records, and Avg. Efficiency Rating across 5 interactive dashboard pages with over 15 charts.
Do I need advanced Excel skills to use this dashboard?
No. Simply replace the sample data in the Data Sheet with your own energy records and click Refresh All in the Data tab. All charts and pivot tables update automatically. No VBA or macros required.
Can I customize this dashboard with my own facilities and energy sources?
Yes. Add new records in the Data Sheet following the same column format. After refreshing the pivot tables, the new facilities, sources, and departments will appear in all charts and slicers automatically.
What Excel version is required for this energy dashboard?
This dashboard works with Microsoft Excel 2016 and later versions, including Excel for Microsoft 365. It uses pivot tables, slicers, and charts that are supported in all modern Excel versions.
How does this dashboard help with carbon emission tracking?
The dashboard includes dedicated Total Carbon Emission by Energy Source, Total Cost Vs Total Carbon Emission by Zone, and Total Consumption Vs Total Carbon Emission by Facility charts that help sustainability teams monitor environmental impact and prepare compliance reports.
What is the best Excel dashboard template for energy consumption analysis?
The Energy Consumption Analysis Dashboard in Excel by NextGenTemplates is a top-rated template with 5 interactive pages, 5 KPI cards, 15+ charts, and dynamic slicers — all powered by pivot tables for automatic updates when you refresh your data.
🔗 Explore Related Templates
🔹 Energy Consumption Analysis Dashboard in HTML — Browser-based interactive version with 5 pages, filters, and CSV export.
🔹 Building Automation Dashboard in Excel — Track building energy, alerts, maintenance costs, comfort scores, and occupancy.
🔹 Browse all Excel Dashboard Templates for more interactive analytics solutions.
📖 Click here to read the Detailed Blog Post<
Watch the step-by-step video tutorial:
/h3>


Reviews
There are no reviews yet.