Emergency Medical Services (EMS) operate in environments where every second matters. Ambulance providers, emergency response teams, and healthcare logistics units must monitor incidents, control costs, and ensure high service quality simultaneously. However, many EMS organizations still depend on scattered spreadsheets and manual reporting systems. As a result, managers struggle to track operational efficiency, response outcomes, and financial performance in real time.
The Emergency Medical Services Dashboard in Power BI solves this challenge by transforming raw operational data into powerful, interactive insights.
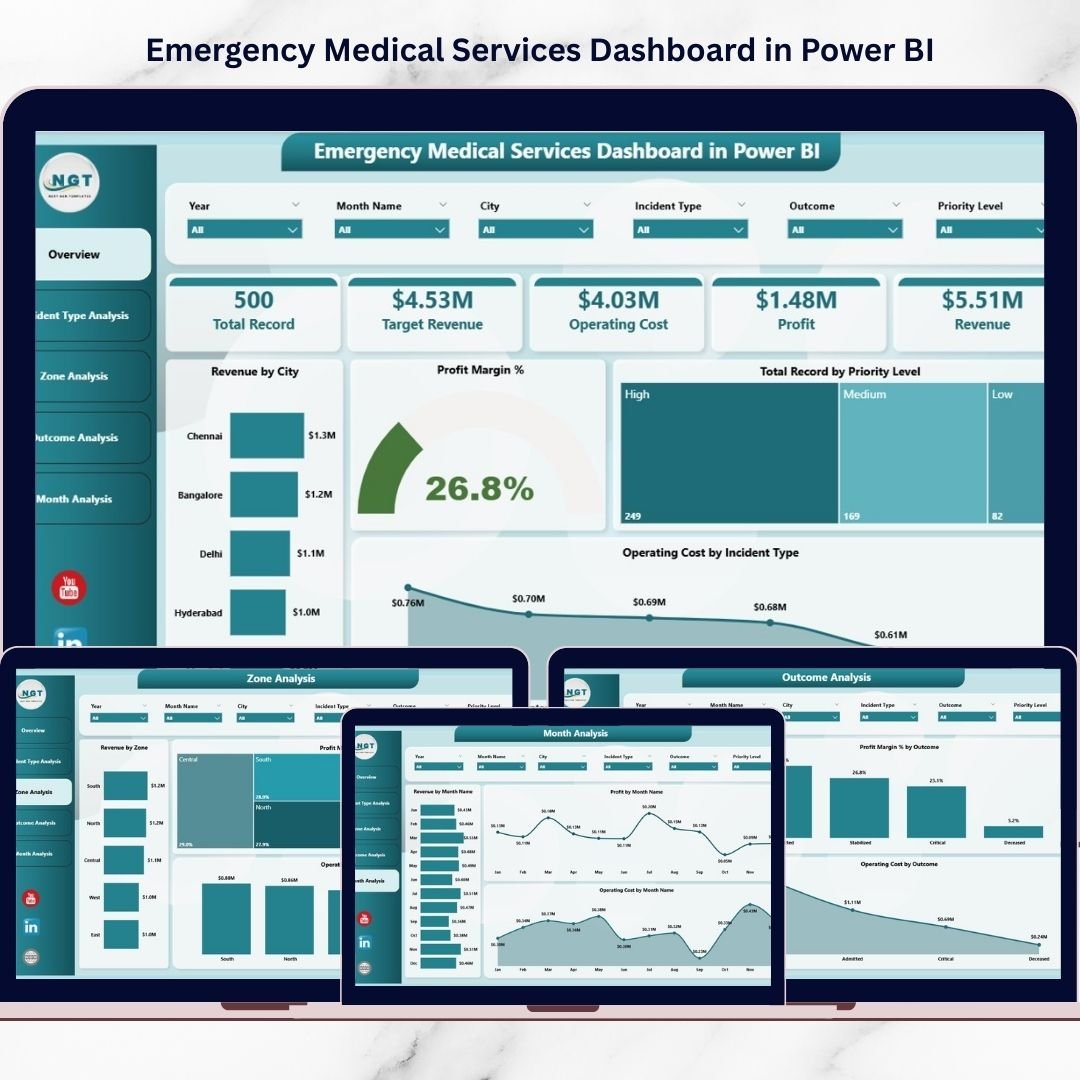
This ready-to-use Power BI dashboard centralizes EMS analytics into one intelligent platform. Instead of compiling multiple reports, leaders can instantly monitor KPIs, analyze incident trends, evaluate zone performance, and optimize emergency operations using dynamic visuals and real-time analytics.
Whether you manage ambulance fleets, hospital emergency units, or public safety operations, this dashboard enables faster, data-driven decision-making.
🔑 Key Feature of Emergency Medical Services Dashboard in Power BI
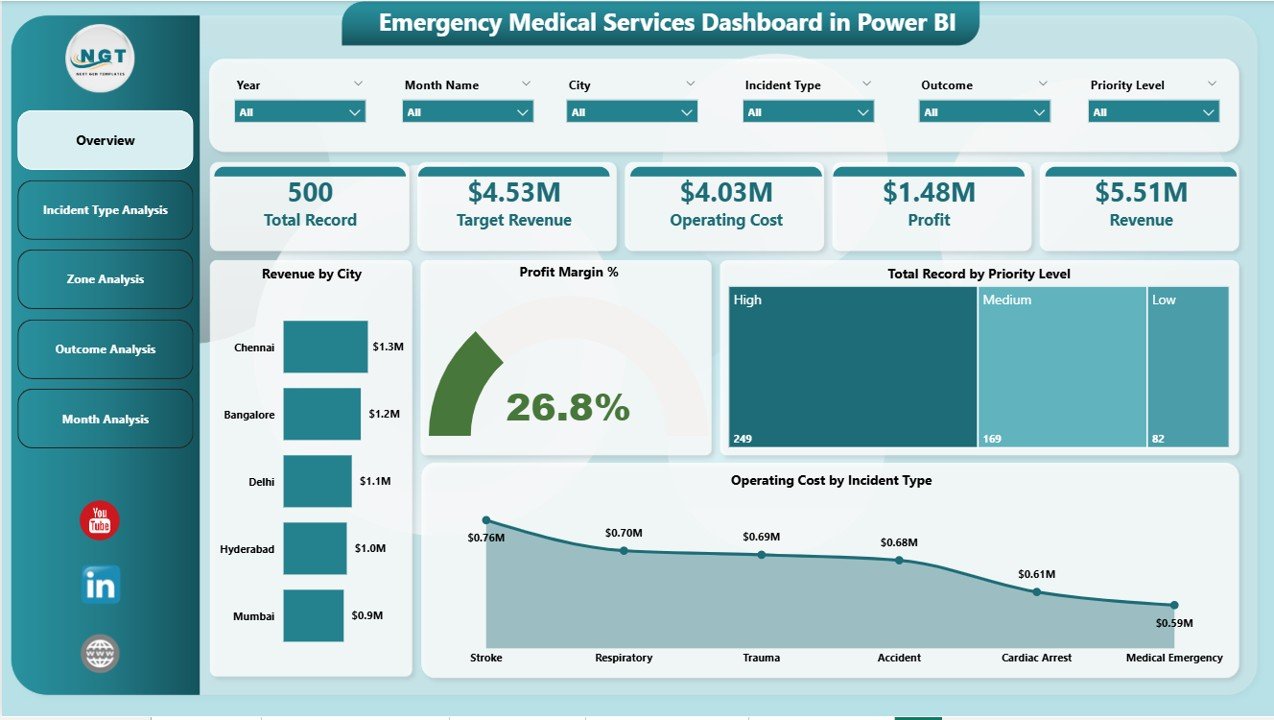
🚑 Executive Overview Command Center
Instantly monitor revenue, operating costs, incident distribution, and profit margin.
📊 Real-Time KPI Monitoring
Track EMS performance using interactive KPI cards and automated calculations.
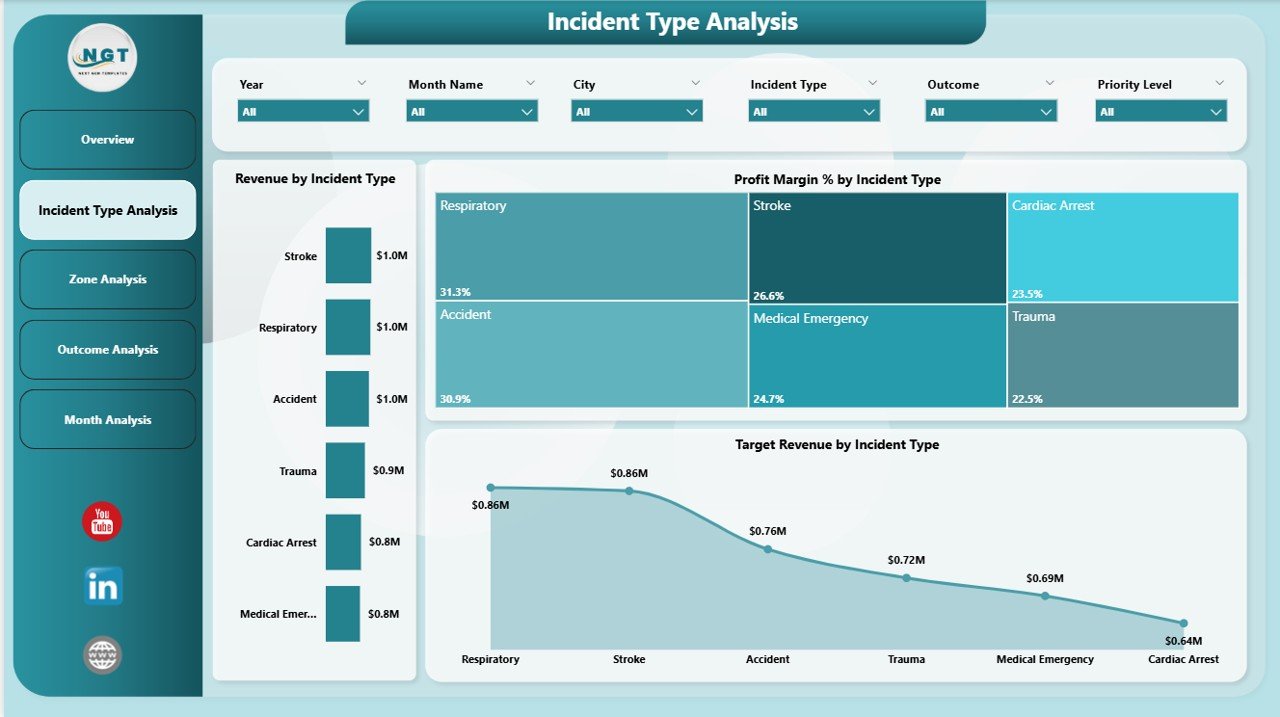
🧭 Incident Type Performance Analysis
Understand which emergency categories drive cost and operational impact.
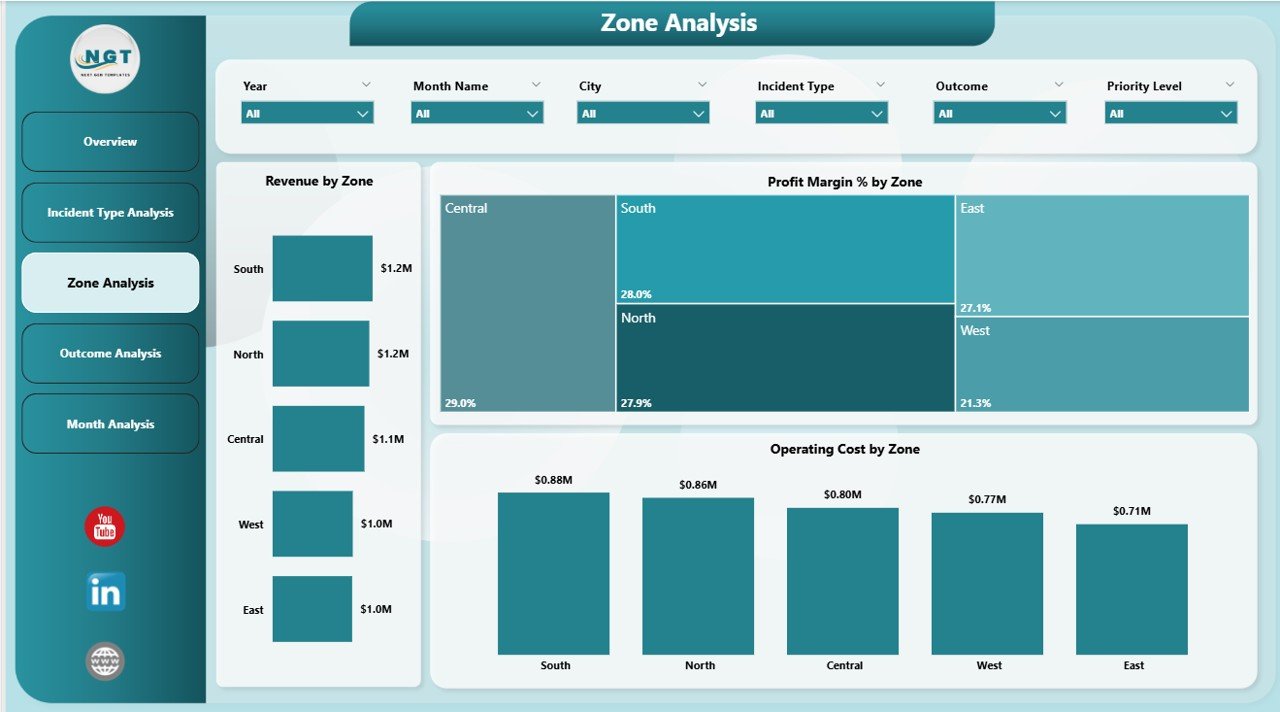
🌍 Zone-Based Operational Insights
Compare performance across regions to optimize ambulance deployment.
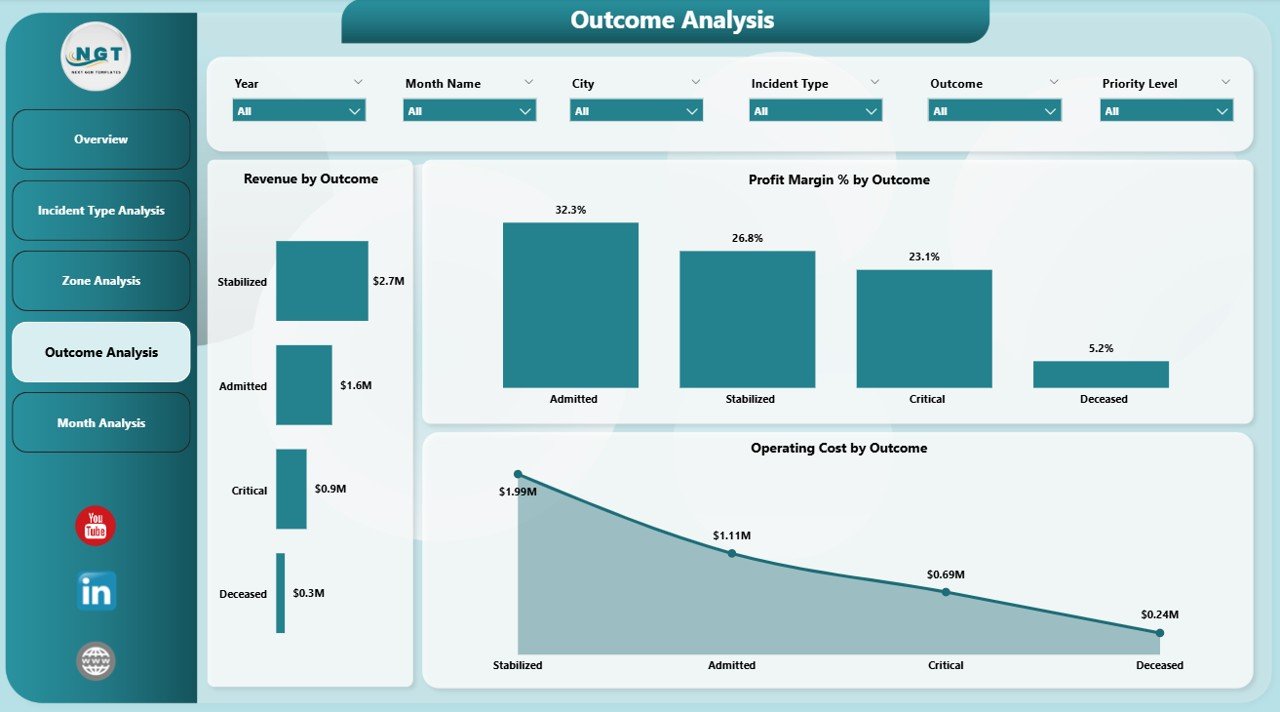
📈 Outcome Performance Tracking
Evaluate emergency response effectiveness and service quality.
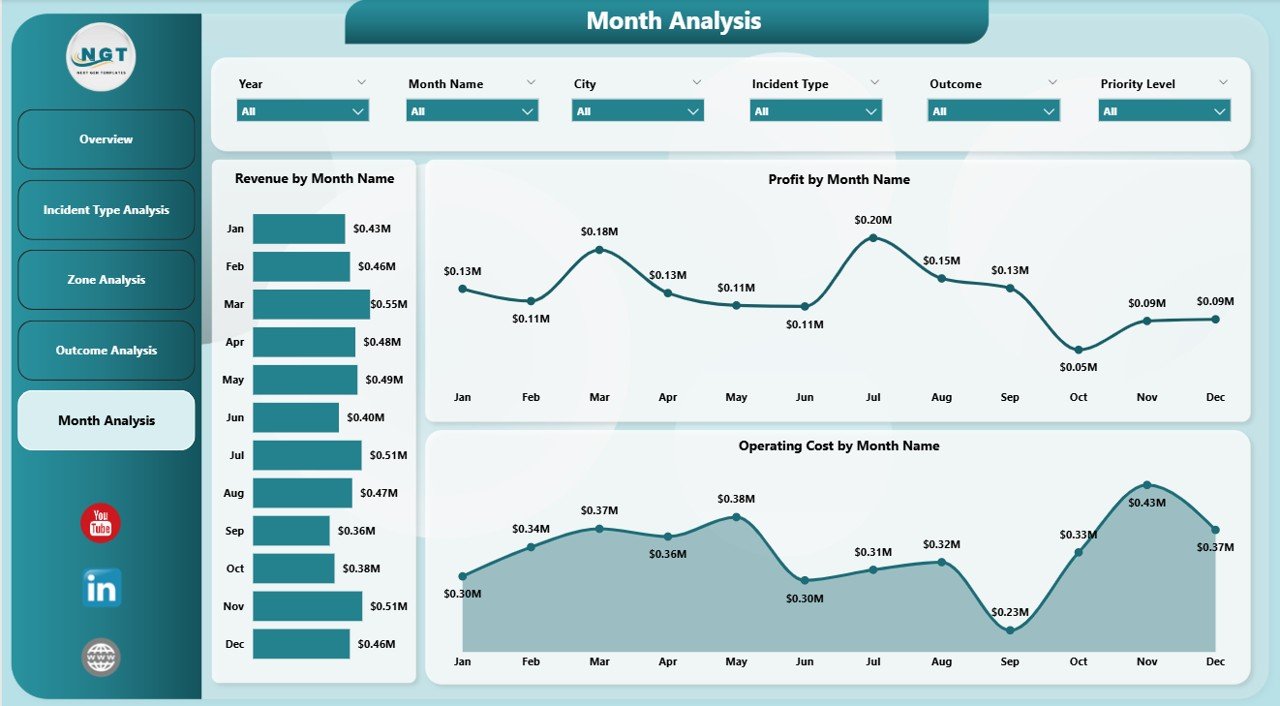
📅 Monthly Trend Analytics
Monitor seasonal patterns and financial performance trends over time.
⚡ Interactive Filters & Slicers
Analyze data dynamically by time, incident type, outcome, or zone.
🔄 Automated Power BI Refresh
Update insights instantly when data refreshes.
🧩 Flexible & Scalable Dashboard Model
Customize KPIs and visuals according to EMS operational structure.
📦 What’s Inside the Emergency Medical Services Dashboard in Power BI
This dashboard includes five interactive analytical pages:
✔️ Overview Page – High-level operational snapshot
✔️ Incident Type Analysis – Emergency category insights
✔️ Zone Analysis – Geographic performance monitoring
✔️ Outcome Analysis – Service effectiveness evaluation
✔️ Month Analysis – Trend and forecasting analysis
Additional features include:
-
KPI summary cards
-
Interactive slicers and filters
-
Dynamic charts and visuals
-
Drill-down analytics capability
-
Automated performance calculations
Simply connect your EMS dataset and begin analyzing immediately.
🛠️ How to Use the Emergency Medical Services Dashboard in Power BI
Getting started is simple:
Step 1: Import EMS operational data into Power BI
Step 2: Refresh dataset to update visuals
Step 3: Use slicers to filter zones, incidents, or time periods
Step 4: Review KPI cards and performance charts
Step 5: Conduct daily, weekly, or monthly performance reviews
Within minutes, your organization gains a centralized emergency analytics system.
🎯 Who Can Benefit from This Emergency Medical Services Dashboard in Power BI
This dashboard is ideal for:
✅ Emergency Medical Service Providers
✅ Ambulance Service Companies
✅ Hospital Emergency Departments
✅ Public Safety Agencies
✅ Healthcare Operations Managers
✅ Government Emergency Organizations
✅ EMS Data Analysts
If your organization needs real-time visibility and smarter operational planning, this dashboard delivers immediate value.
Why This Dashboard Improves Emergency Operations
Instead of manual reporting, you gain:
✔️ Centralized EMS performance monitoring
✔️ Faster operational decision-making
✔️ Improved resource allocation
✔️ Better cost control and financial visibility
✔️ Enhanced outcome tracking
✔️ Automated reporting workflows
As a result, EMS organizations improve efficiency, reduce delays, and enhance patient outcomes.
### Click hare to read the Detailed blog post
📺 Visit our YouTube channel to learn step-by-step video tutorials
👉 Youtube.com/@PKAnExcelExpert