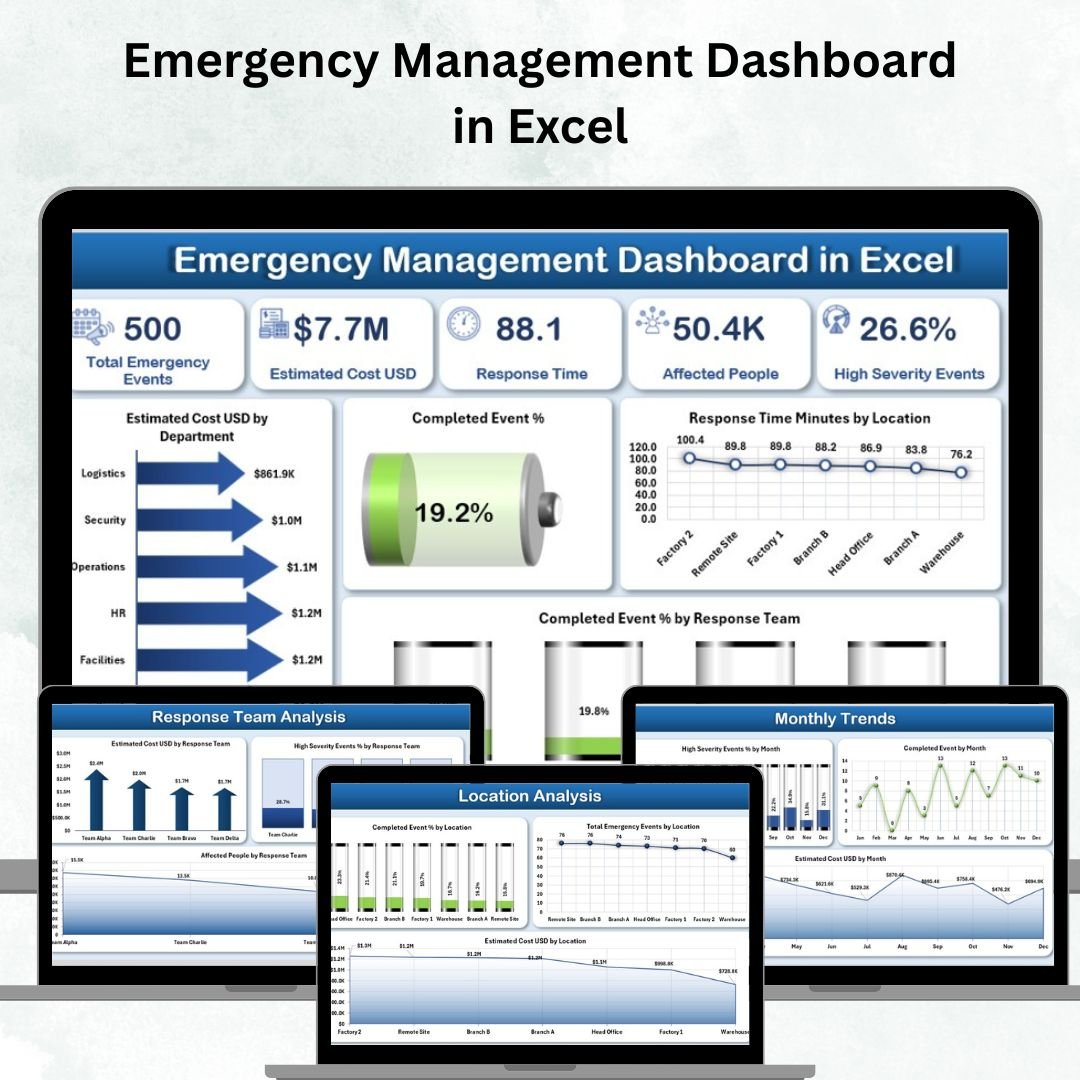
Emergencies are unpredictable — but your response doesn’t have to be. The Emergency Management Dashboard in Excel gives organizations a powerful, centralized, and data-driven system to track incidents, analyze performance, and strengthen preparedness.
From natural disasters to workplace accidents, this ready-to-use Excel dashboard helps emergency teams monitor every critical metric — from response time to cost, severity, and completion rates — in one interactive, visual platform.
⚙️ Key Features of Emergency Management Dashboard in Excel
-
📊 Five Insightful Dashboard Pages — Overview, Department Analysis, Response Team Analysis, Location Analysis, and Monthly Trends.
-
📈 KPI Cards at a Glance — Total Emergencies, Completed Events %, Average Response Time, Estimated Cost (USD), and High Severity %.
-
🗂 Dynamic Slicers — Instantly filter data by department, location, or response team.
-
🧩 Visual Analysis — Interactive charts track incident counts, severity, and response times.
-
💡 Department and Team Insights — Identify performance gaps and recurring high-severity events.
-
🌍 Location Tracking — Monitor emergencies and costs by site or region.
-
🕒 Trend Monitoring — See monthly trends for severity, completion %, and cost.
-
📚 Support Sheet Included — Centralized dropdowns for error-free, standardized data entry.
-
🔒 No Add-ons Required — 100% Excel-based, works offline, and customizable for all industries.
-
🚀 Real-Time Visualization — Refresh your dashboard in one click to analyze the latest data.
📂 What’s Inside the Emergency Management Dashboard
This professional Excel template includes five interactive pages and one support sheet:
1️⃣ Overview Page
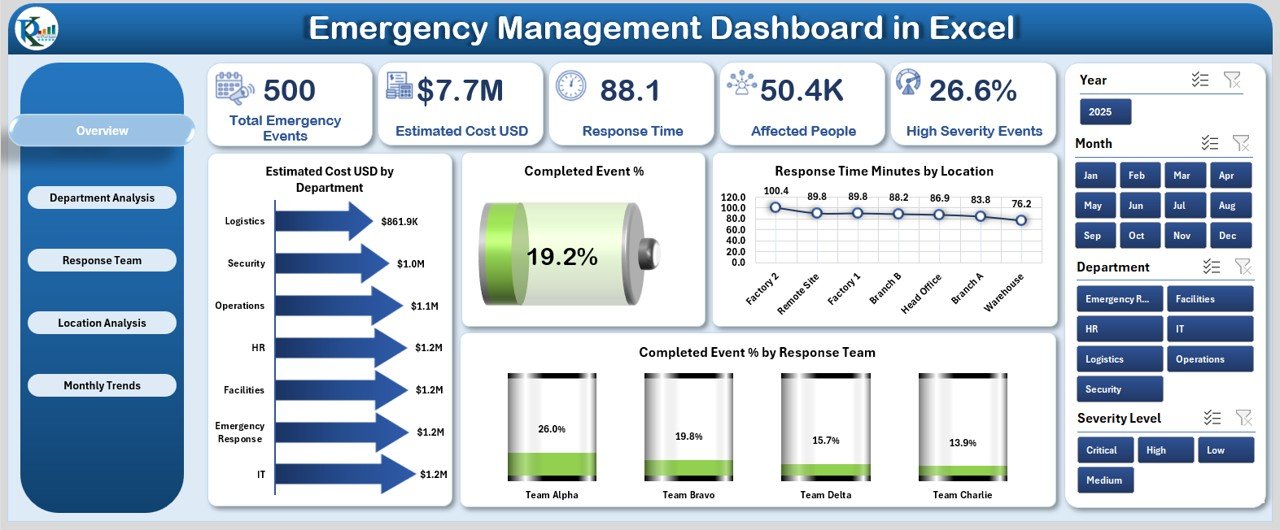
The main control center featuring top KPIs, slicers, and visuals.
-
Key charts: Estimated Cost (USD) by Department, Completed Event %, Response Time by Location, Completed Events % by Response Team.
-
Perfect for quick situational analysis and leadership reporting.
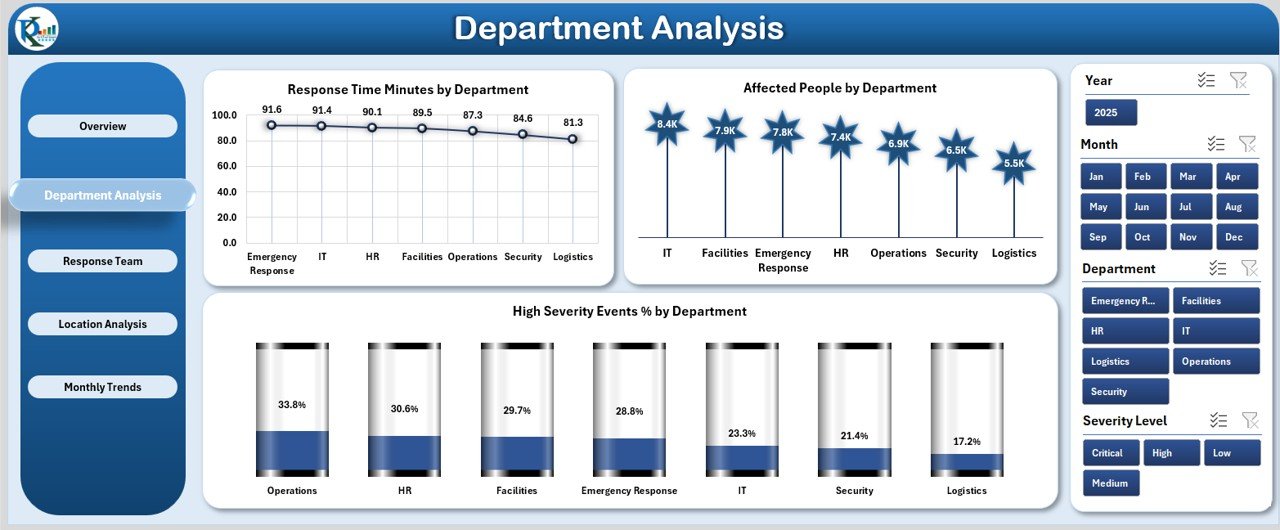
2️⃣ Department Analysis Page
Dive deeper into departmental performance.
-
Charts include Response Time, Affected People, and High Severity Event % by Department.
-
Helps identify high-risk areas and improve resource allocation.
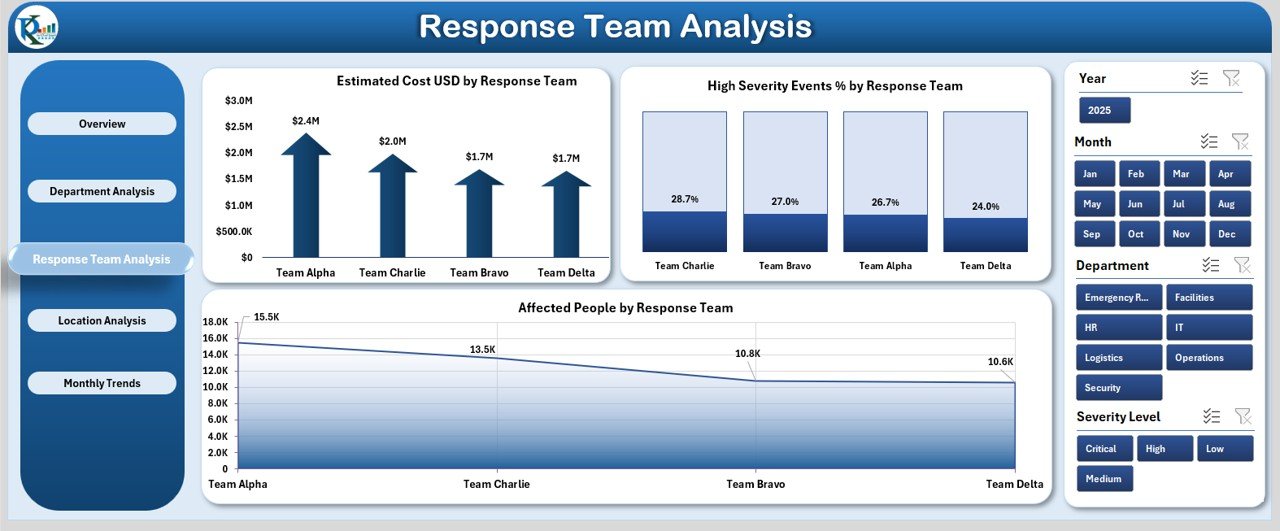
3️⃣ Response Team Analysis Page
Evaluate the efficiency and performance of emergency response teams.
-
Charts for Estimated Cost, High Severity %, and Affected People by Team.
-
Great for identifying training and staffing needs.
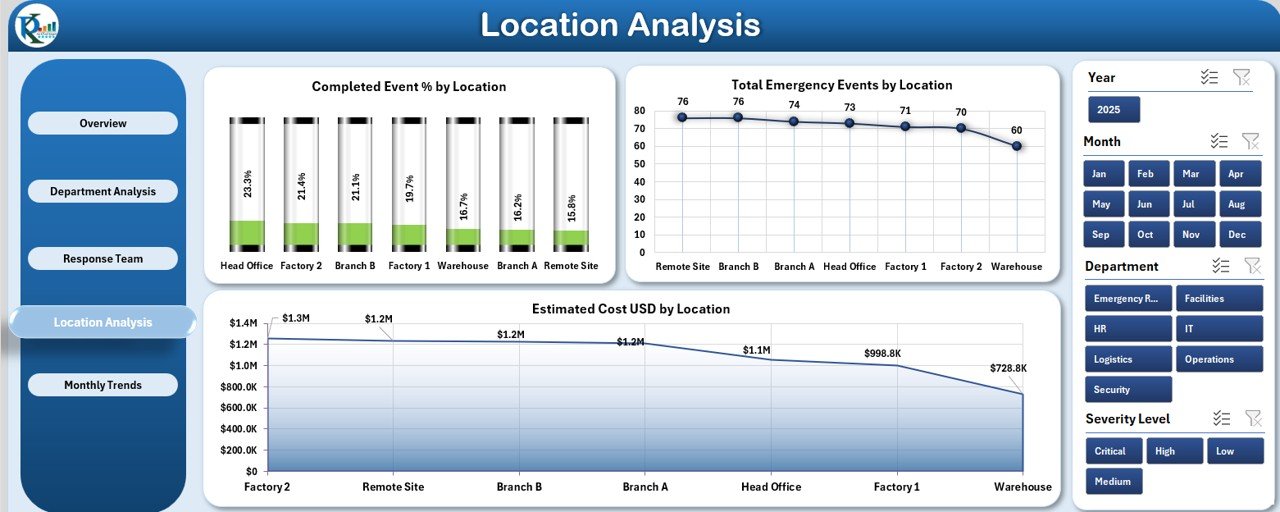
4️⃣ Location Analysis Page
Visualize how different locations manage emergencies.
-
Displays Completed Event %, Total Emergencies, and Estimated Cost by Location.
-
Supports better risk mapping and resource distribution.
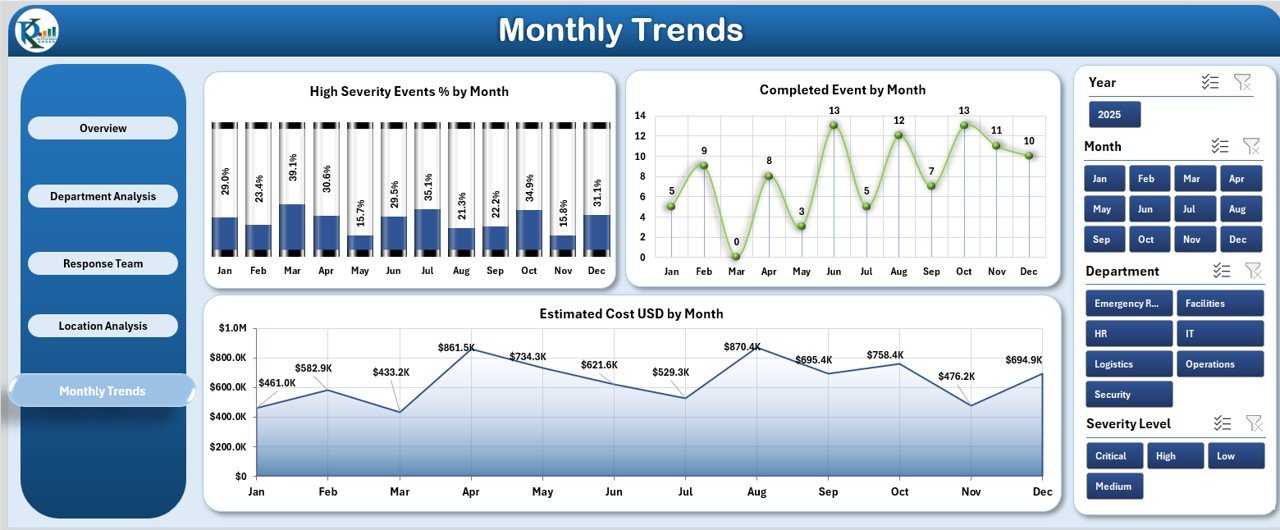
5️⃣ Monthly Trends Page
Analyze historical patterns and trends.
-
Charts include High Severity %, Completed Events, and Estimated Cost by Month.
-
Enables proactive planning and future forecasting.
🧾 Support Sheet
Contains dropdowns for Departments, Locations, Response Teams, and Event Types — ensuring consistency and clean data entry.
🧠 How to Use the Emergency Management Dashboard
-
Input Data: Enter or import emergency event data into the main data table.
-
Refresh Data: Click “Refresh All” to update KPIs and visuals automatically.
-
Filter Easily: Use slicers to filter incidents by location, team, or department.
-
Review Insights: Check Overview and Department pages for key takeaways.
-
Track Trends: Use Monthly Trends for long-term performance visualization.
-
Export Reports: Print or share dashboard summaries with decision-makers.
👥 Who Can Benefit from This Dashboard
-
🏥 Hospitals & Healthcare Facilities — Track patient incidents and response times.
-
🏢 Corporate Offices — Monitor safety events and emergency drills.
-
🏫 Schools & Universities — Manage student safety and preparedness reports.
-
🏛 Government Departments — Coordinate disaster response and public emergencies.
-
🏭 Manufacturing Plants — Track equipment incidents and workplace safety.
-
🌍 Municipal Bodies — Evaluate cross-location emergency handling efficiency.
This dashboard is ideal for safety officers, compliance managers, and emergency response coordinators who want clear, actionable insights from their data.
🎯 Why Choose This Dashboard
Unlike manual spreadsheets or expensive software, this Excel-based Emergency Management Dashboard combines simplicity, affordability, and powerful analytics in one tool.
It’s designed to help you:
✅ Stay prepared.
✅ Respond faster.
✅ Improve decision-making.
✅ Reduce risk and costs.
📖 Click here to read the Detailed blog post
👉 Visit our YouTube channel to learn step-by-step video tutorials


Reviews
There are no reviews yet.