Managing electricity purchasing without a structured KPI system often results in rising costs, missed savings opportunities, and unclear reporting. Many organizations still depend on scattered Excel sheets, emails, and manual calculations, which makes it difficult to track performance accurately and take timely decisions.
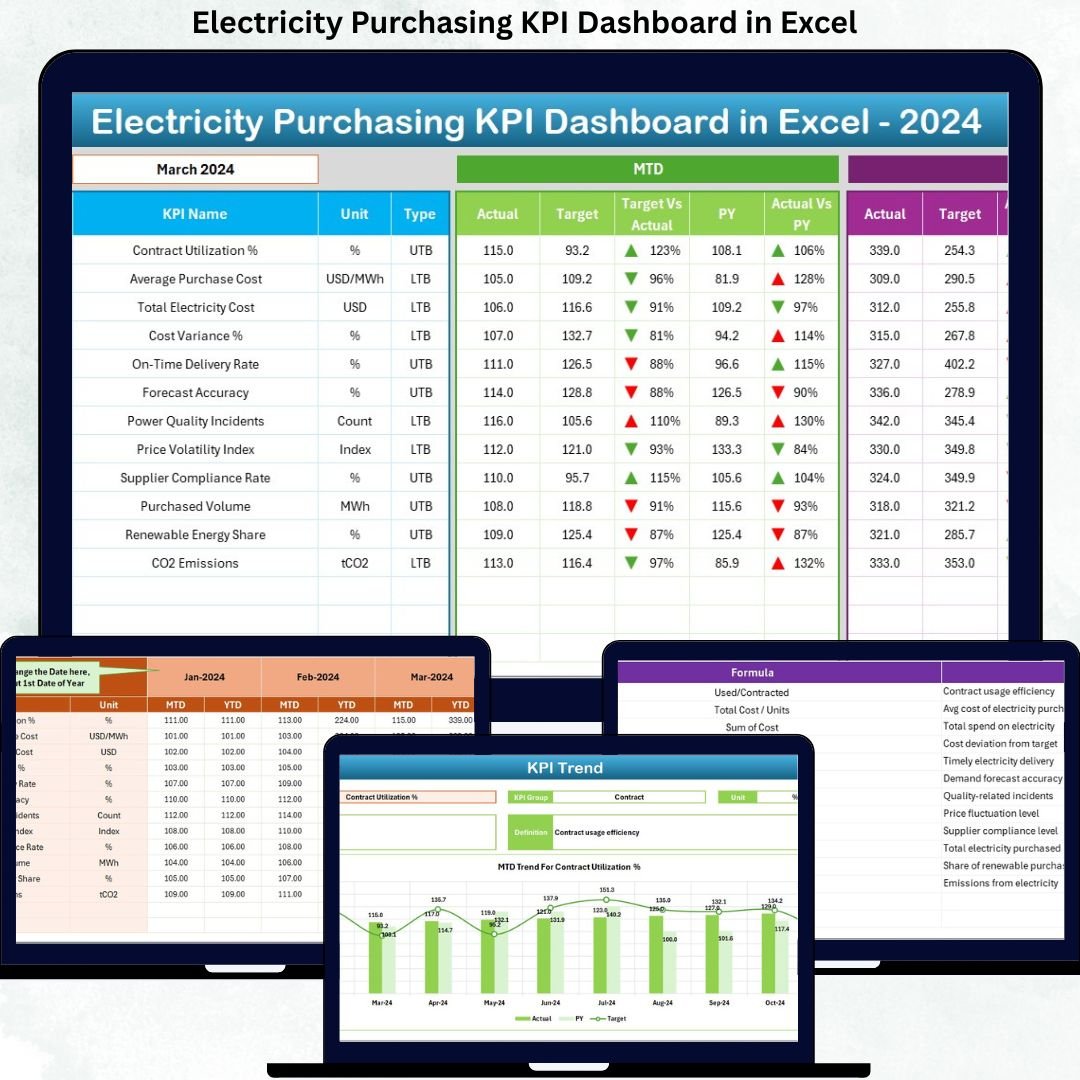
The Electricity Purchasing KPI Dashboard in Excel is a powerful, ready-to-use solution designed to eliminate these challenges. This professionally built Excel dashboard converts complex electricity purchasing data into clear, visual, and actionable insights—without the need for expensive BI tools or advanced technical skills.
Whether you manage electricity procurement for a manufacturing unit, facility, utility, or large organization, this dashboard helps you monitor performance, control costs, and improve purchasing decisions with confidence.
🚀 Key Features of Electricity Purchasing KPI Dashboard in Excel
⚡ Centralized KPI Monitoring – Track all electricity purchasing KPIs in one structured Excel dashboard instead of managing multiple files.
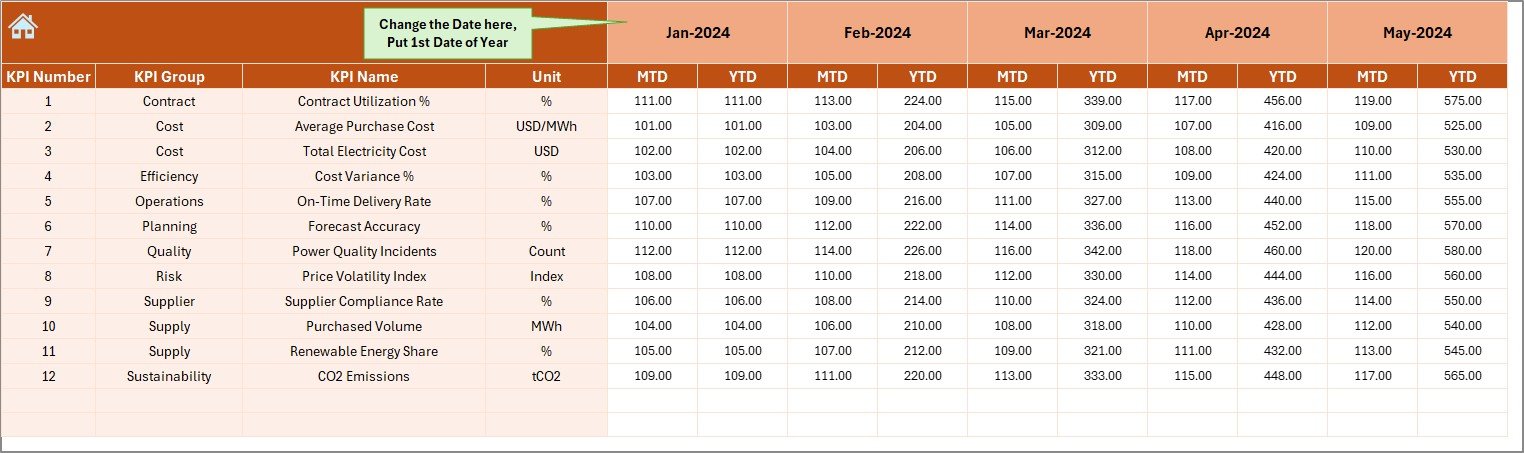
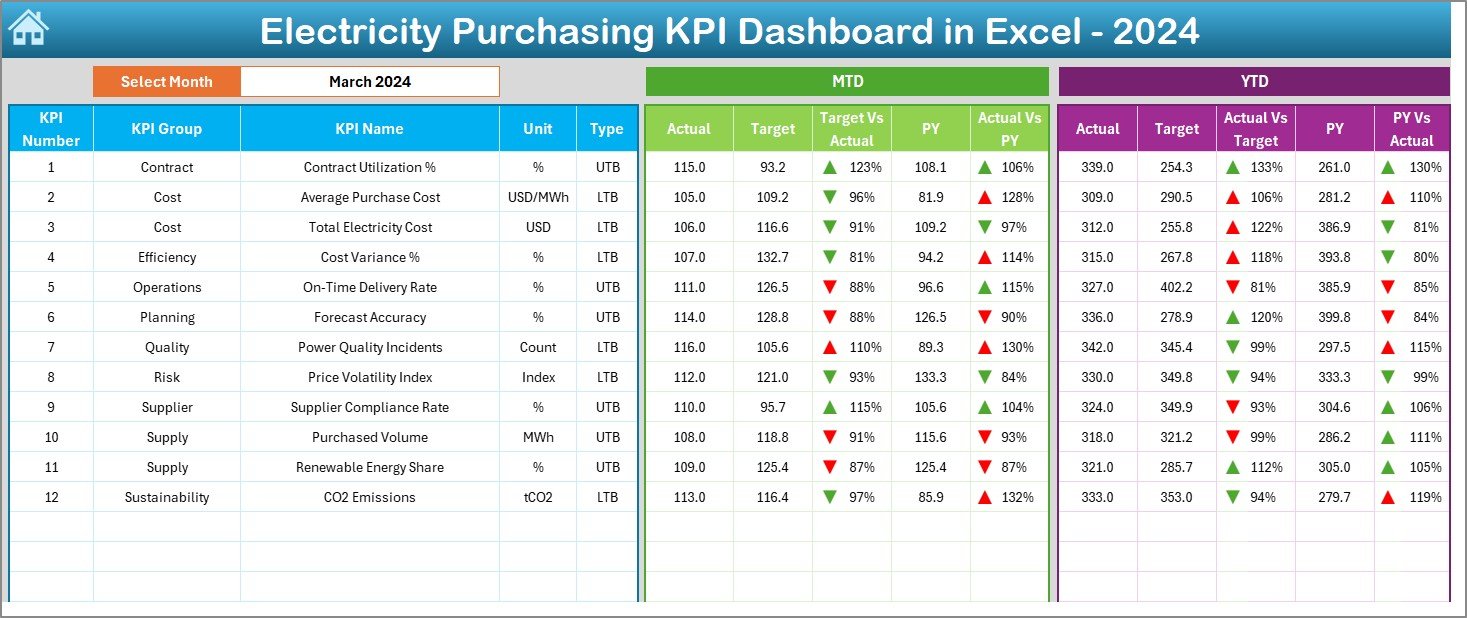
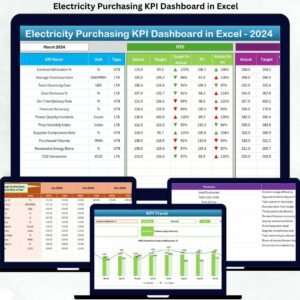
📊 MTD & YTD Performance Tracking – Monitor Month-to-Date and Year-to-Date actuals, targets, and previous-year values in a single view.
🎯 Target vs Actual Comparison – Instantly identify cost overruns and performance gaps using automated variance calculations.
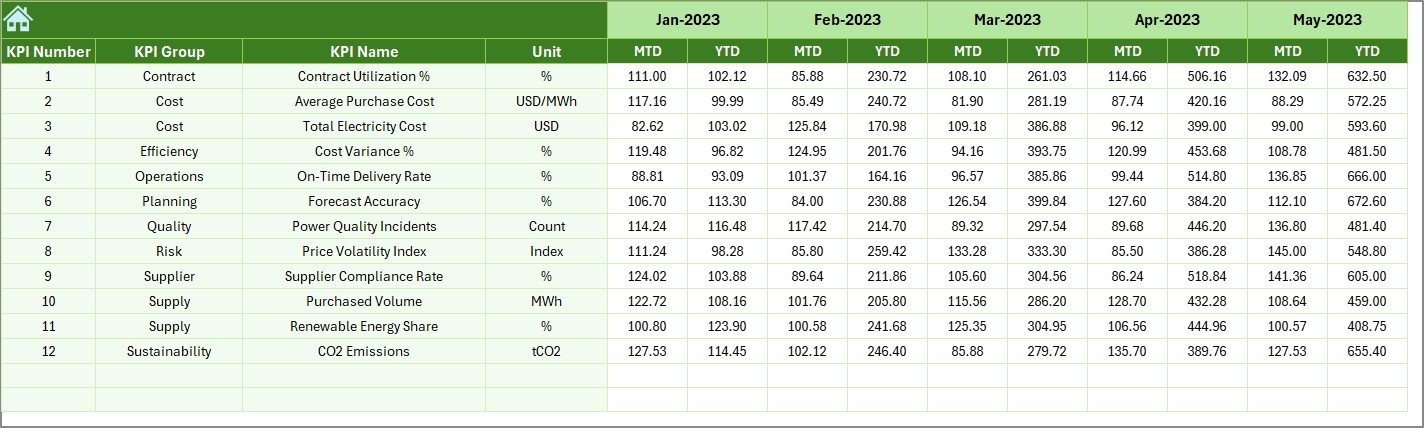
📉 Previous Year Comparison – Analyze year-over-year performance to identify trends and recurring issues.
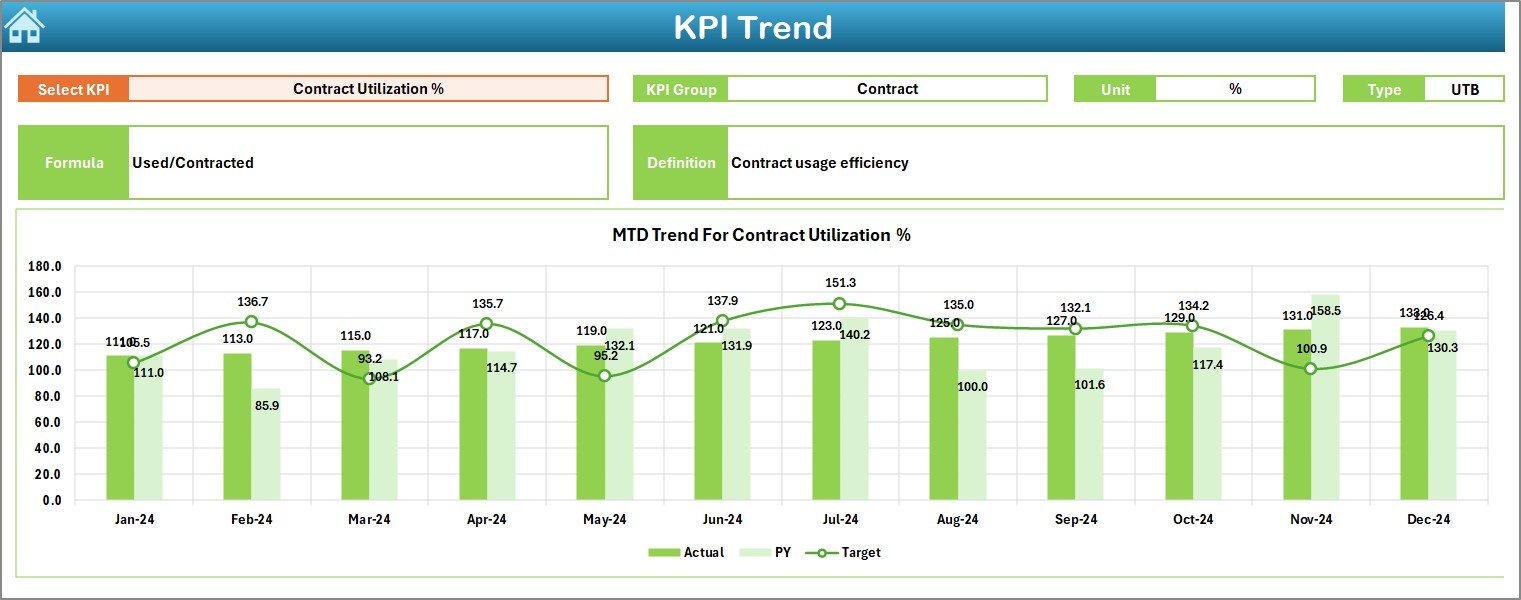
📈 Interactive Trend Analysis – Visual MTD and YTD trend charts for deeper KPI-level insights.
🔽 Dynamic Month Selection – Change the month from a simple drop-down and watch the entire dashboard update automatically.
🟢 Visual Performance Indicators – Conditional formatting arrows clearly highlight good and poor performance.
📦 What’s Inside the Electricity Purchasing KPI Dashboard
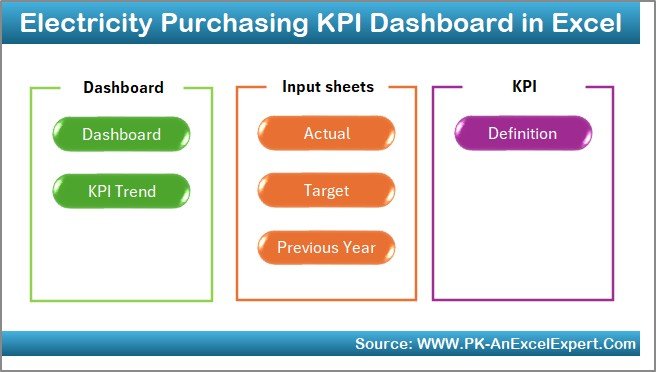
This Excel dashboard includes 7 well-structured worksheets, each designed for a specific purpose:
📌 Summary Page (Index Sheet) – A clean navigation hub with 6 interactive buttons for quick access to all sections.
📌 Dashboard Sheet – The main visualization page displaying all KPIs with MTD, YTD, Target, and Previous Year comparisons.
📌 Trend Sheet – Detailed KPI-level analysis with dynamic charts and KPI definitions linked to a drop-down selector.
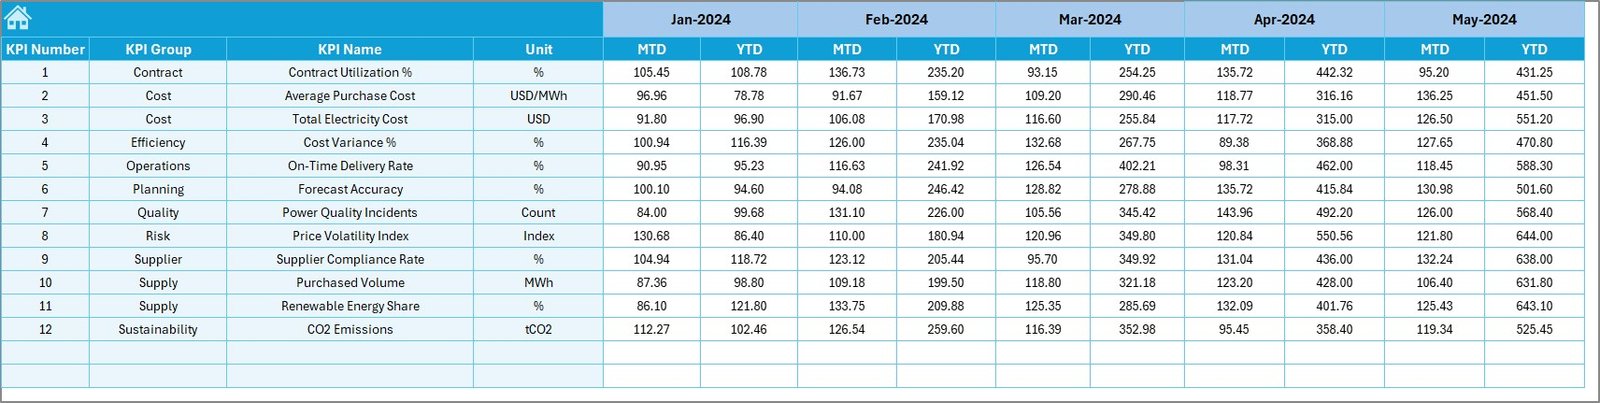
📌 Actual Numbers Input Sheet – Easy-to-use sheet for entering actual electricity purchasing data with automatic calculations.
📌 Target Sheet – Store planned MTD and YTD targets for accurate performance benchmarking.
📌 Previous Year Sheet – Maintain historical MTD and YTD data for year-over-year analysis.
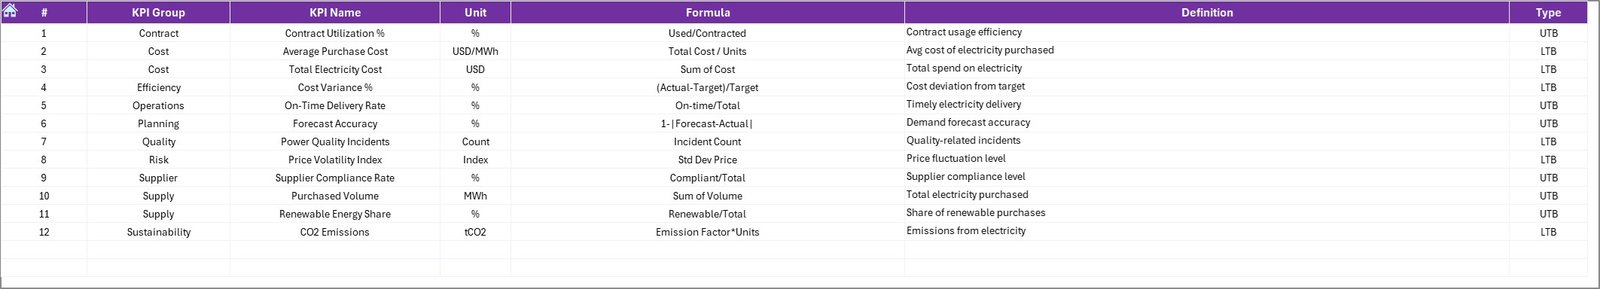
📌 KPI Definition Sheet – A complete reference guide defining KPI names, groups, units, formulas, and definitions.
🛠️ How to Use the Electricity Purchasing KPI Dashboard
Using this dashboard is simple and does not require advanced Excel skills:
1️⃣ Enter your KPI definitions once in the KPI Definition Sheet
2️⃣ Add monthly targets in the Target Sheet
3️⃣ Enter actual electricity purchasing data in the Actual Numbers Sheet
4️⃣ Input previous year data for comparison
5️⃣ Select the month from the drop-down in cell D3
6️⃣ Instantly review performance insights on the Dashboard and Trend Sheets
All calculations, comparisons, and visuals update automatically, saving time and reducing manual errors.
👥 Who Can Benefit from This Electricity Purchasing KPI Dashboard?
This dashboard is ideal for:
🔹 Electricity procurement teams
🔹 Finance and accounting professionals
🔹 Facility and operations managers
🔹 Manufacturing and industrial organizations
🔹 Utilities and energy-intensive businesses
🔹 Consultants and analysts managing energy costs
Anyone responsible for electricity purchasing, cost optimization, or procurement performance can gain immediate value from this dashboard.
Click here to read the Detailed Blog Post
Watch the step-by-step video tutorial:
Visit our YouTube channel to learn step-by-step video tutorials


Reviews
There are no reviews yet.