Electricity purchasing has become increasingly complex. Organizations today deal with multiple utility providers, diverse energy sources, fluctuating consumption, transmission charges, and changing tax structures. When this information is scattered across spreadsheets or manual reports, cost visibility drops. As a result, decision-making slows down, inefficiencies increase, and savings opportunities go unnoticed.
That is exactly why the Electricity Purchasing Dashboard in Excel becomes a powerful and practical solution.
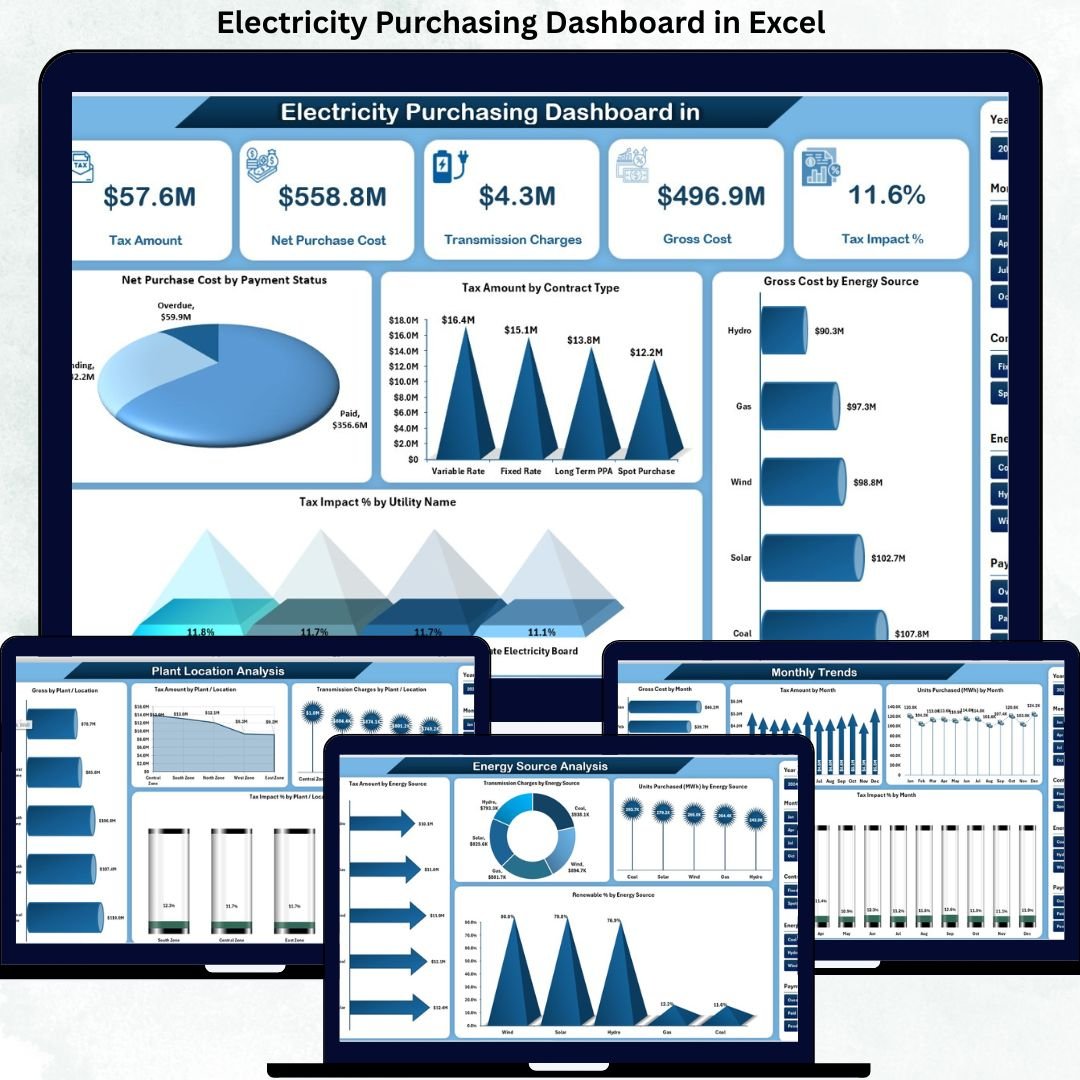
Electricity Purchasing Dashboard in Excel This ready-to-use Excel dashboard transforms raw electricity purchasing data into clear KPIs, interactive charts, and insightful trends. Instead of manually analyzing data tables, finance teams, energy managers, procurement professionals, and operations leaders gain instant visibility into gross cost, net purchase cost, tax impact, transmission charges, energy mix, and monthly trends—all in one structured Excel file. As a result, organizations move from reactive reporting to data-driven electricity cost optimization.
🔑 Key Features of Electricity Purchasing Dashboard in Excel
⚡ Centralized Electricity Purchasing Analysis
Track all electricity purchase data from one structured Excel dashboard.
💰 Cost & Tax Transparency
Monitor Gross Cost, Net Purchase Cost, Transmission Charges, and Tax Impact % clearly.
📊 Utility-Wise Performance Insights
Compare costs, taxes, and units purchased across utility providers.
🏭 Plant / Location-Based Analysis
Understand electricity cost variation by plant or location.
🌱 Energy Source & Renewable Tracking
Analyze electricity cost and consumption by energy source and renewable percentage.
📅 Monthly Trend Analysis
Track cost, consumption, and tax impact trends over time.
🧭 Page Navigator for Easy Navigation
Move smoothly across analytical pages without scrolling.
⚙️ 100% Excel-Based & Customizable
No macros, no BI tools—easy to modify and extend.
📦 What’s Inside the Electricity Purchasing Dashboard in Excel
This professionally designed dashboard includes five powerful analytical pages, supported by structured backend sheets.
📊 Overview Page
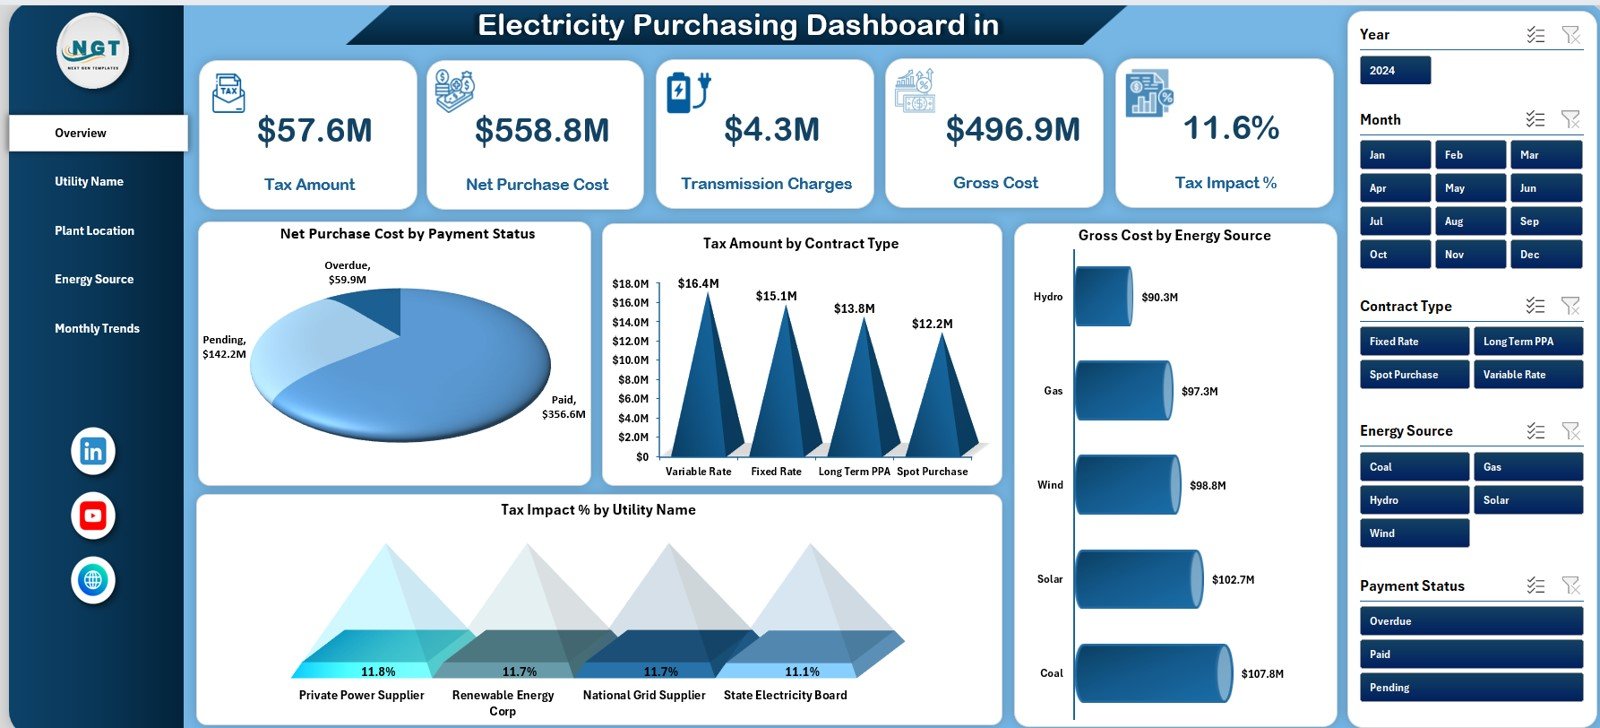
Acts as the executive control panel with KPI cards for:
-
Tax Amount
-
Net Purchase Cost
-
Transmission Charge
-
Gross Cost
-
Tax Impact %
Includes charts for:
-
Net Purchase Cost by Payment Status
-
Tax Amount by Contract Type
-
Gross Cost by Energy Source
-
Tax Impact % by Utility Name
This page instantly explains where electricity money is going.
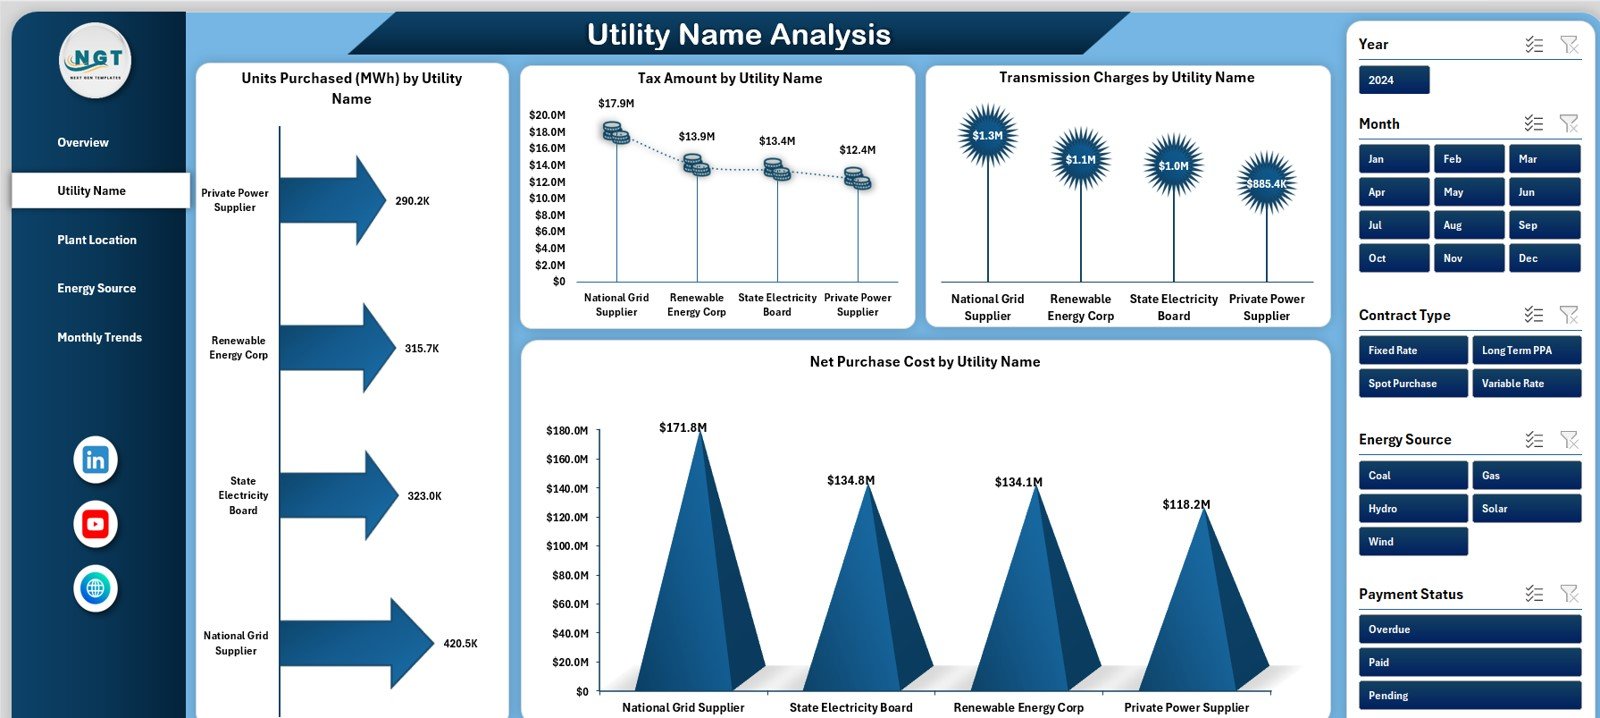
🏢 Utility Name Analysis Page
Provides supplier-level insights using:
-
Units Purchased (MWh) by Utility Name
-
Tax Amount by Utility Name
-
Transmission Charges by Utility Name
-
Net Purchase Cost by Utility Name
Helps negotiate better utility contracts.
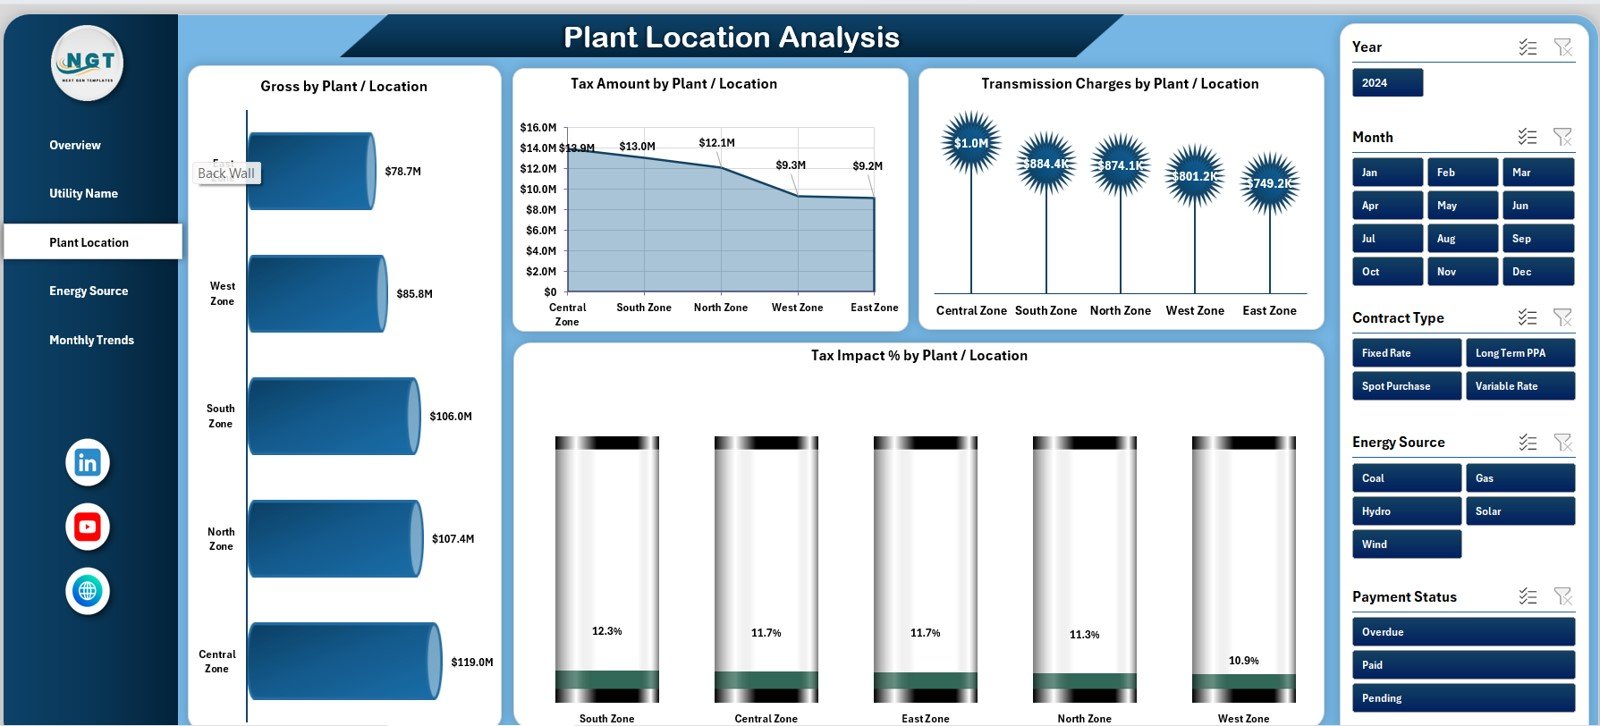
🏭 Plant / Location Analysis Page
Delivers site-wise cost insights using:
-
Gross Cost by Plant / Location
-
Tax Amount by Plant / Location
-
Transmission Charges by Plant / Location
-
Tax Impact % by Plant / Location
Supports targeted cost-reduction actions.
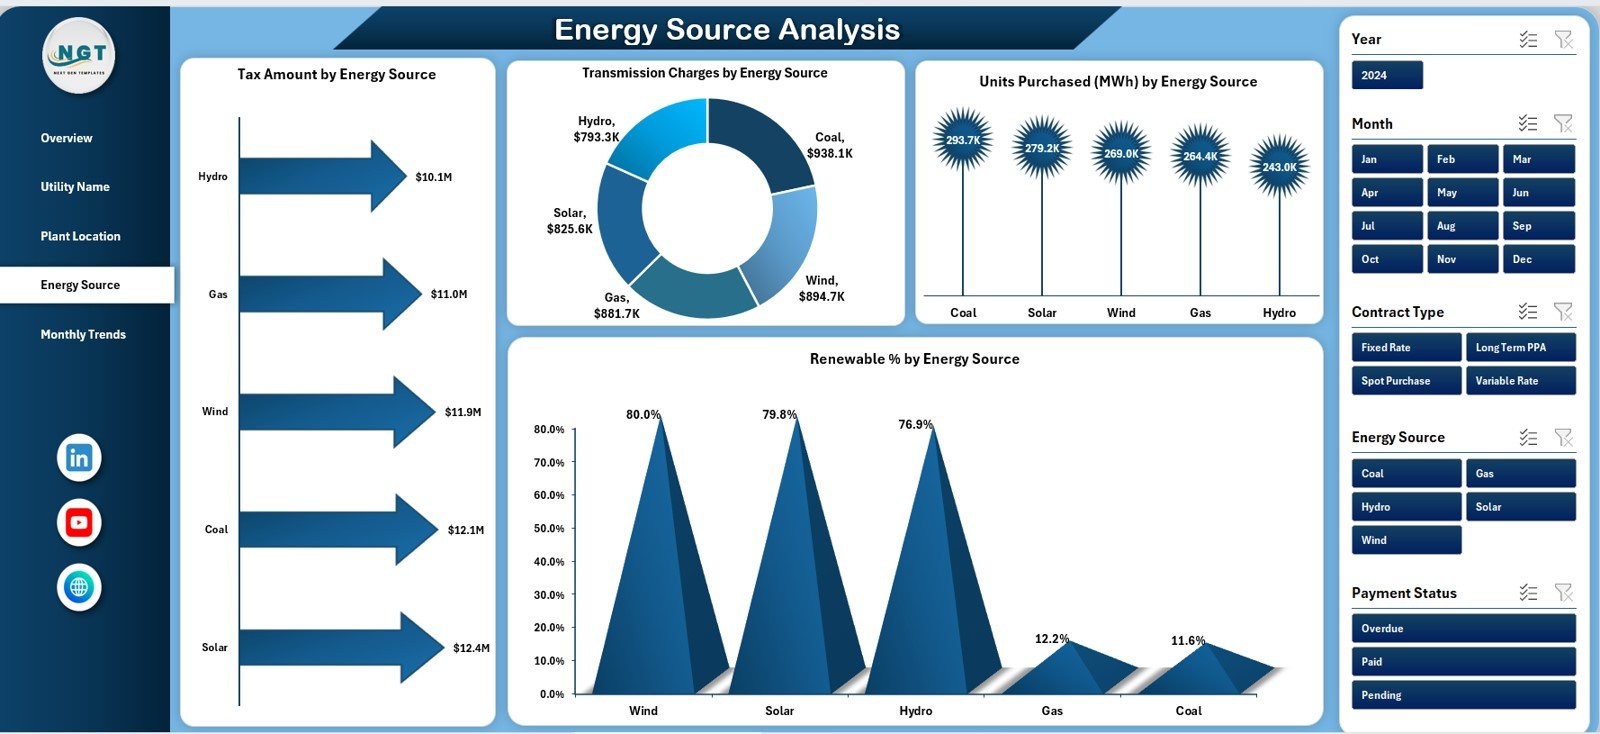
🌱 Energy Source Analysis Page
Explains energy mix using:
-
Tax Amount by Energy Source
-
Transmission Charges by Energy Source
-
Units Purchased (MWh) by Energy Source
-
Renewable % by Energy Source
Supports sustainability and ESG reporting.
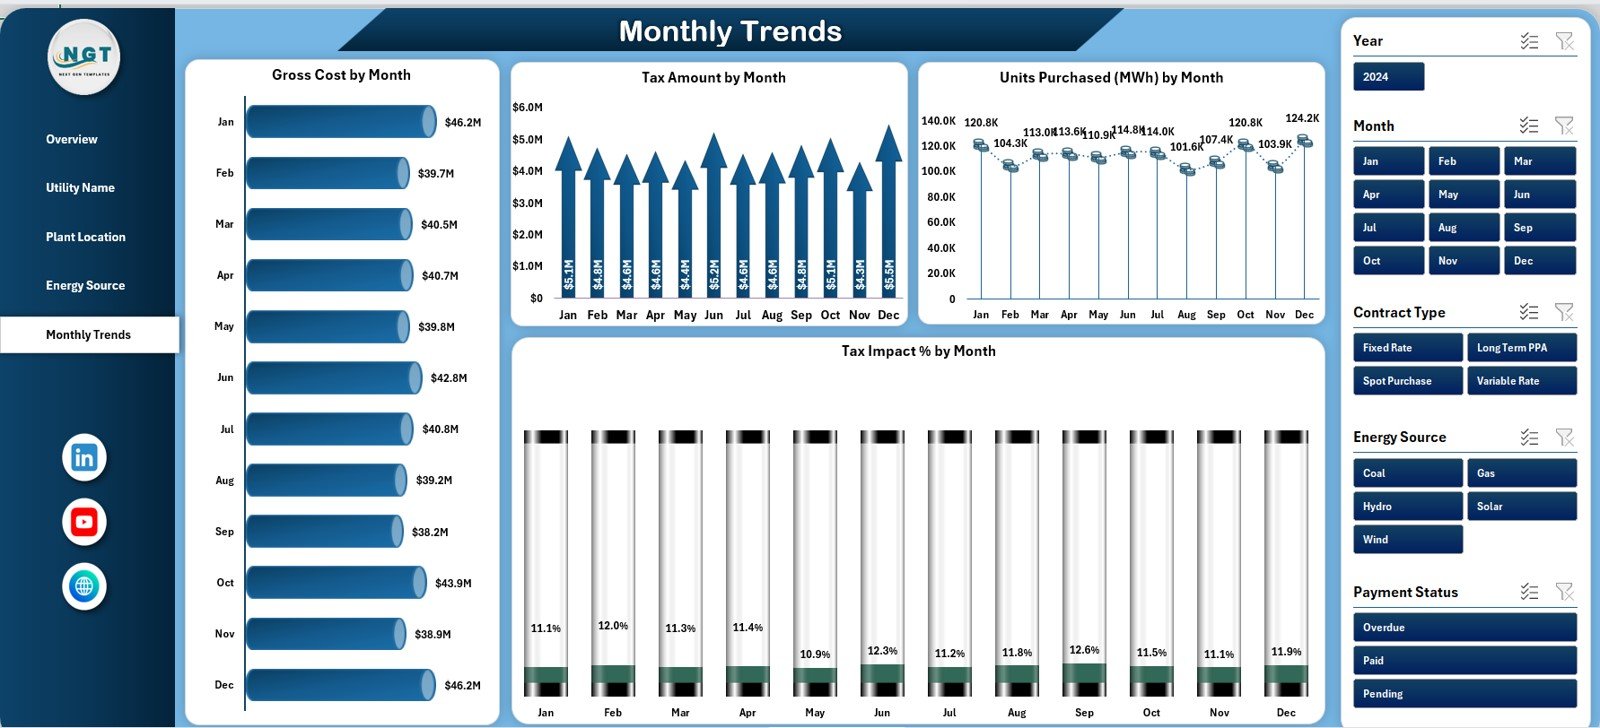
📅 Monthly Trends Page
Tracks time-based performance using:
-
Gross Amount by Month
-
Tax Amount by Month
-
Units Purchased (MWh) by Month
-
Tax Impact % by Month
Helps with budgeting and forecasting.
🗂️ Data Sheet & Support Sheet
Store structured raw data, helper calculations, mappings, and validations to keep analysis accurate and scalable.
▶️ How to Use the Electricity Purchasing Dashboard in Excel
Using this dashboard is simple and business-friendly:
1️⃣ Enter or update electricity purchase data in the Data Sheet
2️⃣ Use standardized utility, location, and energy source names
3️⃣ Review KPIs on the Overview Page
4️⃣ Navigate to Utility, Location, or Energy Source analysis
5️⃣ Monitor tax impact, transmission charges, and cost drivers
6️⃣ Analyze monthly trends for forecasting
7️⃣ Take faster, data-driven purchasing decisions
No advanced Excel skills are required.
🎯 Who Can Benefit from This Electricity Purchasing Dashboard in Excel
⚡ Energy & Utility Managers – Improve cost visibility
💼 Procurement & Purchasing Teams – Optimize supplier decisions
💰 Finance & Accounting Teams – Control electricity expenses
🌱 Sustainability & ESG Teams – Track renewable usage
🏭 Plant & Operations Managers – Control location-level costs
🏛️ Senior Management – Make informed energy decisions
This dashboard supports both operational control and strategic planning.
👉 Click here to read the Detailed Blog Post
🔔 Visit our YouTube channel to learn step-by-step video tutorials
👉 YouTube.com/@PKAnExcelExpert


Reviews
There are no reviews yet.