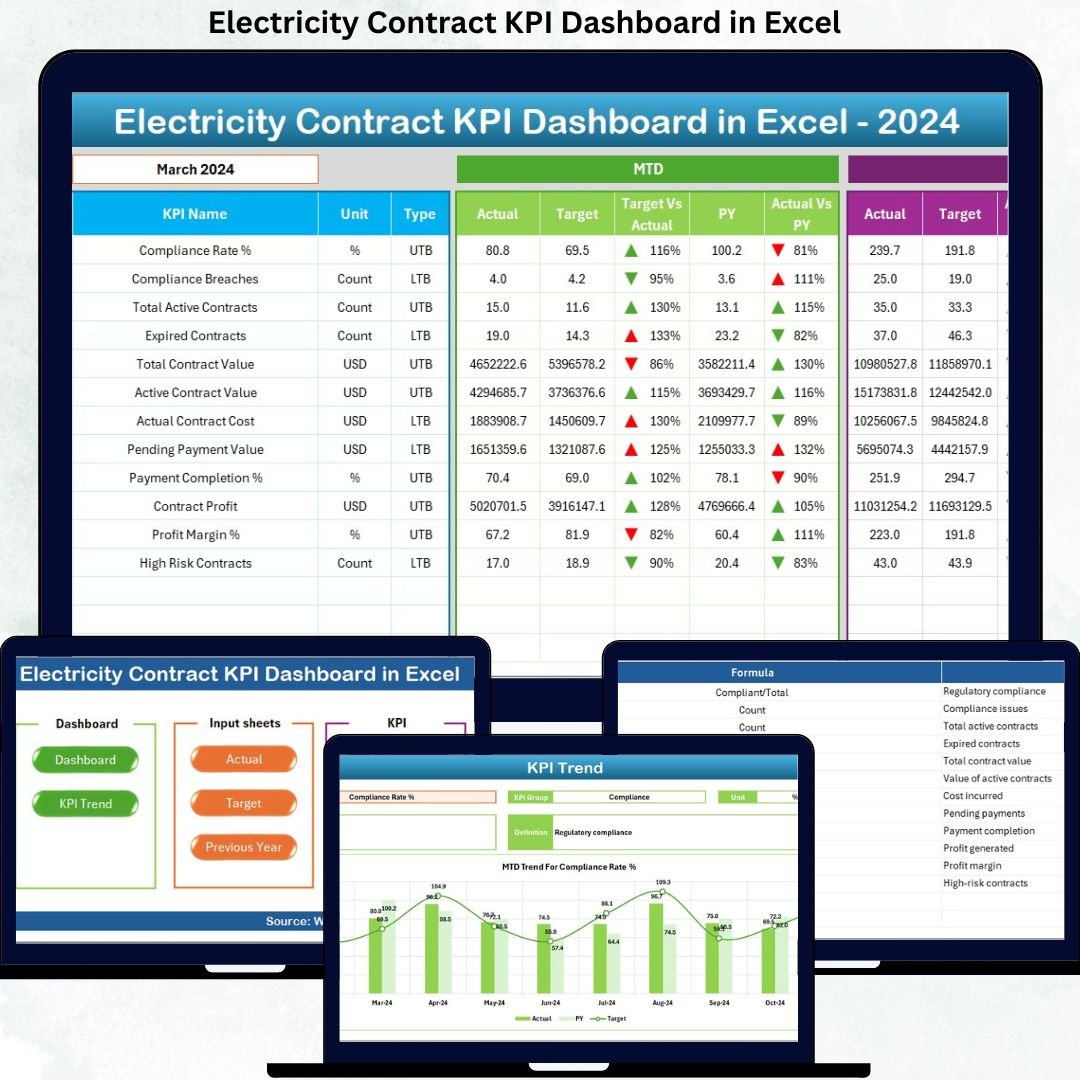
Managing electricity contracts without a clear performance-tracking system often leads to missed targets, rising costs, and delayed decisions. If your organization still relies on multiple Excel files, emails, and manual reports, it becomes difficult to track KPIs, compare results, and take timely action. That is exactly where the Electricity Contract KPI Dashboard in Excel delivers unmatched value.
This professionally designed dashboard transforms complex electricity contract data into a single, structured, and interactive Excel solution. It helps organizations monitor performance, track targets, compare historical data, and analyze trends—without any technical complexity. Built using standard Excel features, this dashboard ensures clarity, accuracy, and control for electricity contract management.
Whether you manage utility contracts, energy procurement, or cost control, this dashboard gives you instant visibility and confidence in decision-making.
⭐ Key Features of Electricity Contract KPI Dashboard in Excel
⚡ Centralized KPI Monitoring – Track all electricity contract KPIs in one structured Excel dashboard instead of multiple scattered files.
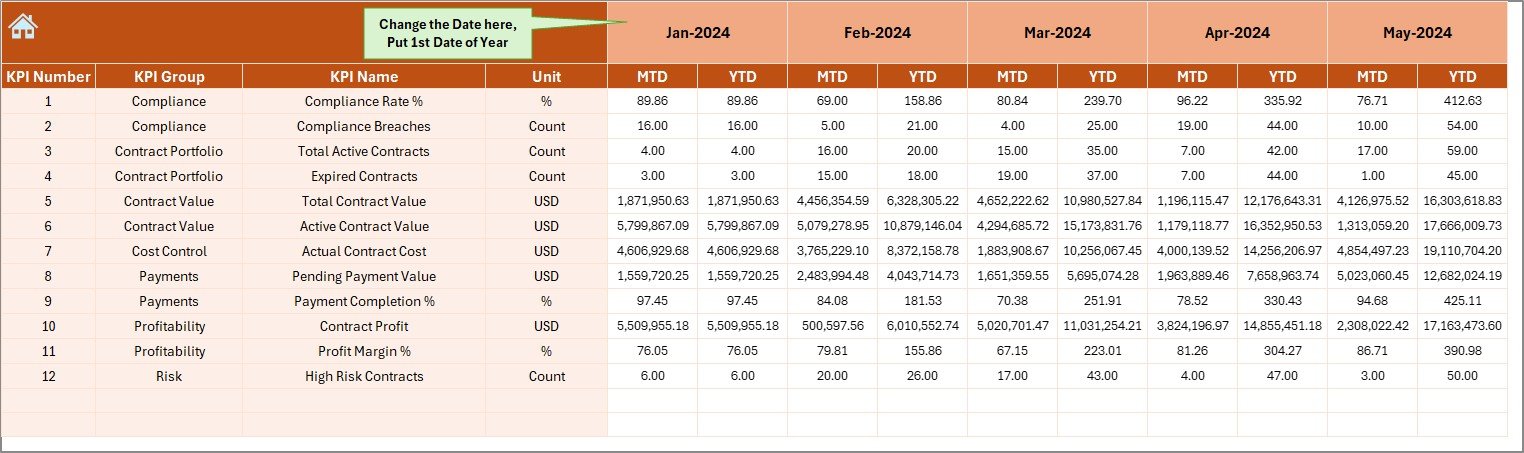
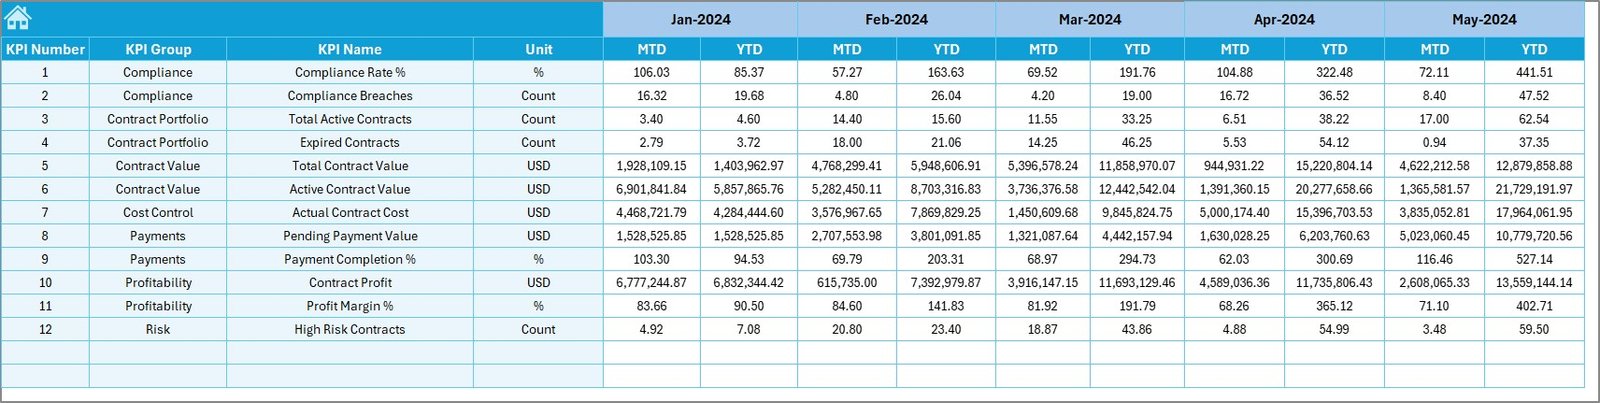
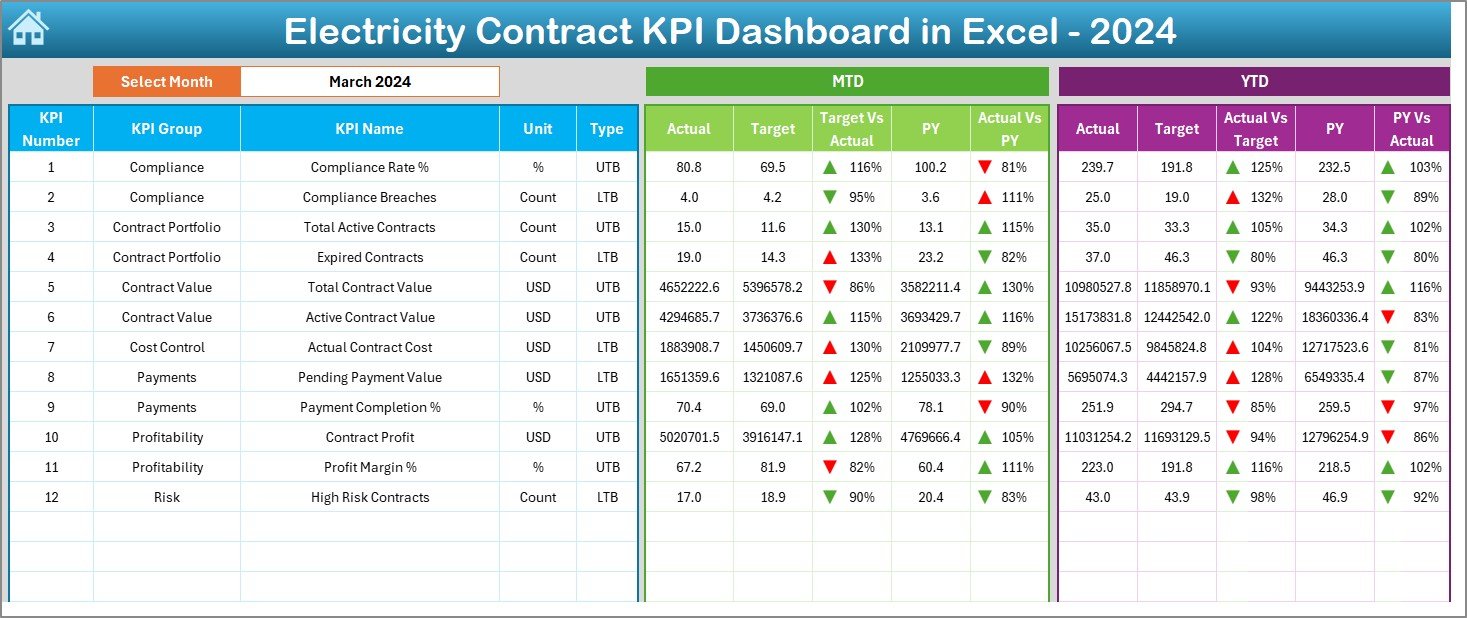
📊 MTD & YTD Performance Tracking – Monitor Month-to-Date and Year-to-Date actuals, targets, and previous-year values in one view.
🎯 Target vs Actual Analysis – Instantly identify performance gaps using automated calculations and visual indicators.
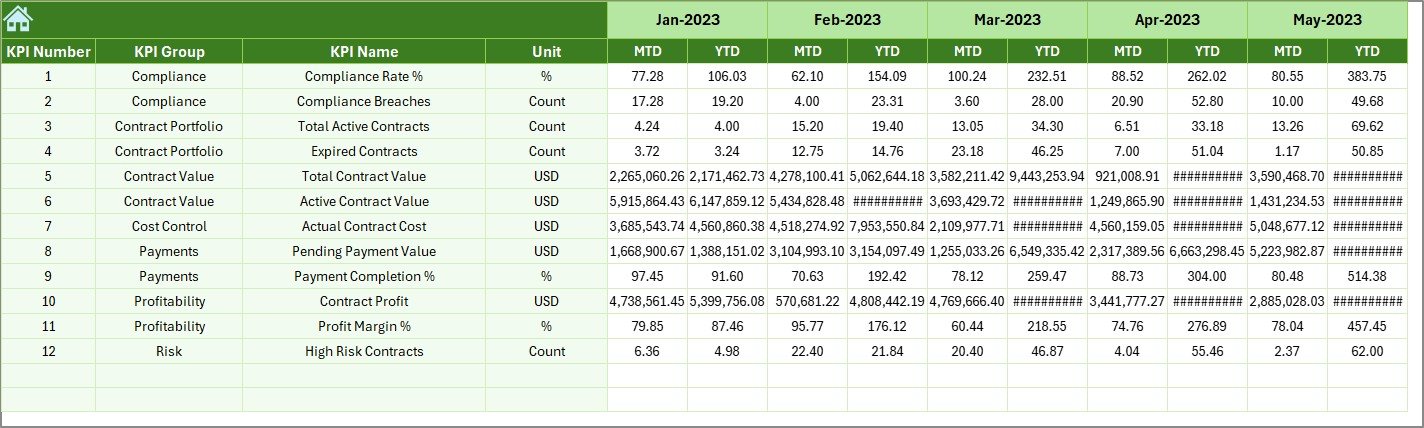
📉 Previous Year Comparison – Measure year-over-year performance to evaluate improvement or decline.
🔄 Dynamic Month Selection – Change the month from a simple dropdown and watch the entire dashboard update automatically.
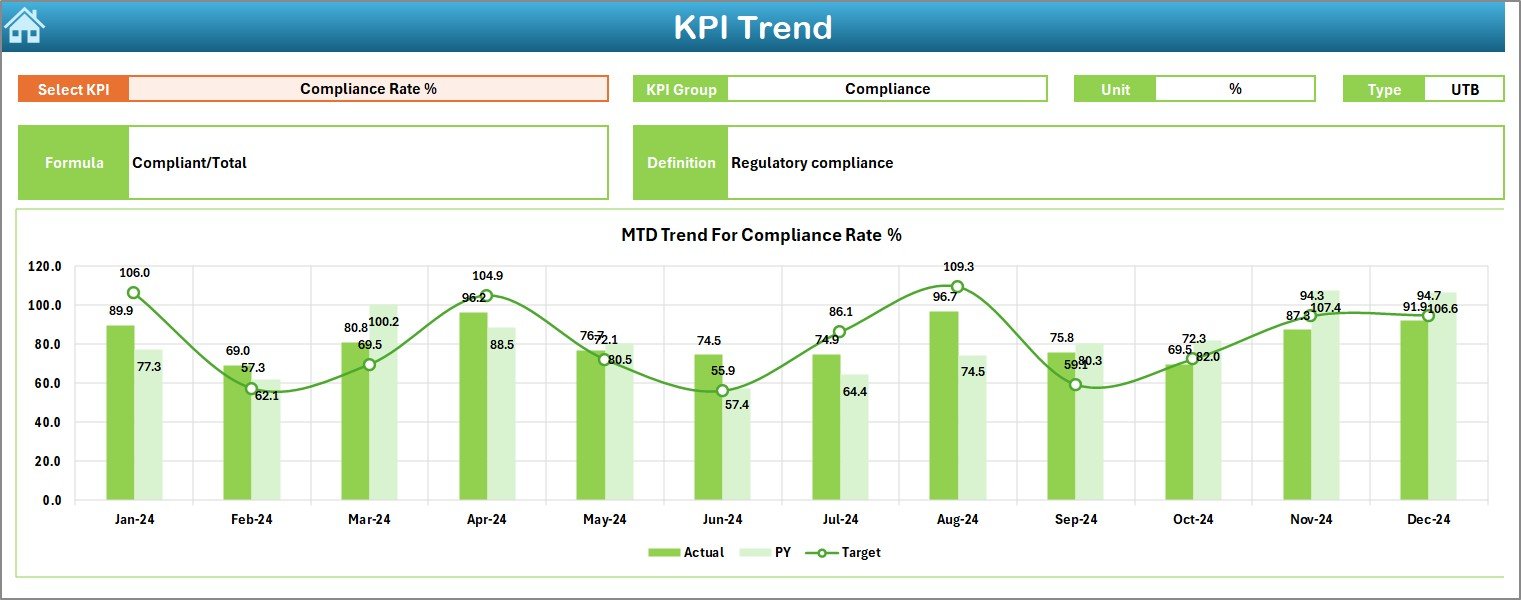
📈 Trend Analysis Charts – Analyze KPI trends over time to identify risks and opportunities early.
🚦 Conditional Formatting Indicators – Up and down arrows make KPI performance easy to understand at a glance.
💻 100% Excel-Based – No Power BI, no macros, no advanced tools—just pure Excel efficiency.
📂 What’s Inside the Electricity Contract KPI Dashboard in Excel
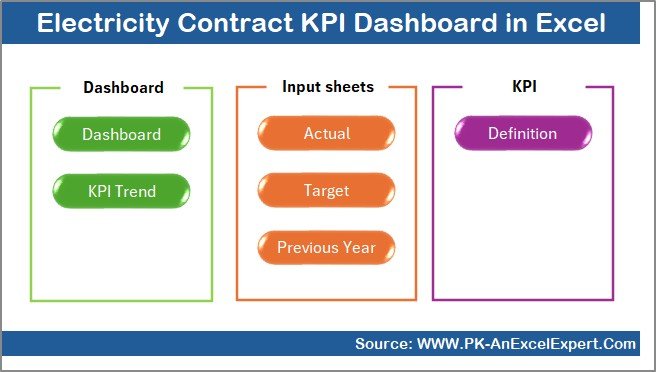
This dashboard includes 7 well-structured worksheets, each designed for clarity and usability:
📌 Summary Page – Acts as a navigation hub with buttons for one-click access to all sheets.
📌 Dashboard Sheet – Displays all KPIs with MTD and YTD actuals, targets, and previous-year comparisons.
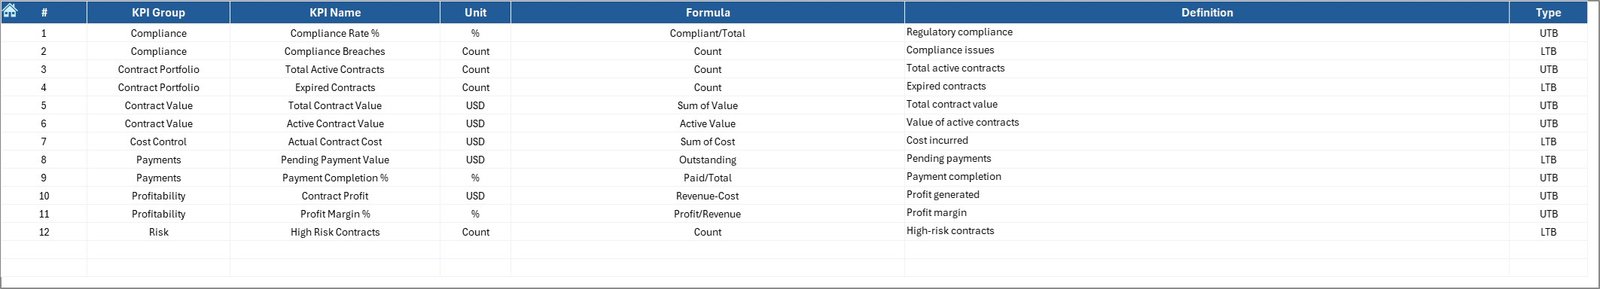
📌 Trend Sheet – Shows KPI trends with detailed information such as KPI group, unit, type, formula, and definition.
📌 Actual Numbers Input Sheet – A structured area to enter real performance data with automatic updates.
📌 Target Sheet – Stores MTD and YTD target values for accurate comparisons.
📌 Previous Year Number Sheet – Enables year-over-year analysis for performance benchmarking.
📌 KPI Definition Sheet – Clearly defines each KPI to avoid confusion and maintain reporting consistency.
This logical structure ensures both technical and non-technical users can work confidently.
🛠️ How to Use the Electricity Contract KPI Dashboard in Excel
Using this dashboard is simple and intuitive:
1️⃣ Enter KPI definitions, targets, and previous-year values in their respective sheets.
2️⃣ Update actual performance data monthly in the Actual Numbers Input Sheet.
3️⃣ Select the required month from the dropdown.
4️⃣ Review KPI status, trends, and comparisons instantly on the Dashboard and Trend sheets.
No manual recalculations. No complex setup. Just instant insights with every update.
👥 Who Can Benefit from This Electricity Contract KPI Dashboard in Excel
This dashboard is ideal for:
⚙️ Electricity & energy managers
📑 Contract management professionals
💼 Procurement and sourcing teams
💰 Finance and cost-control teams
🏭 Operations managers
📊 Senior management and decision-makers
Because it is built entirely in Excel, adoption is fast and organization-wide.
🎯 Why This Dashboard Is a Smart Investment
Unlike traditional reports, this dashboard updates automatically, highlights issues visually, and supports faster decisions. It reduces manual effort, improves transparency, and helps organizations stay in control of electricity contract performance.
If your goal is to reduce risks, improve efficiency, and gain complete KPI visibility, this dashboard is the perfect solution.


Reviews
There are no reviews yet.