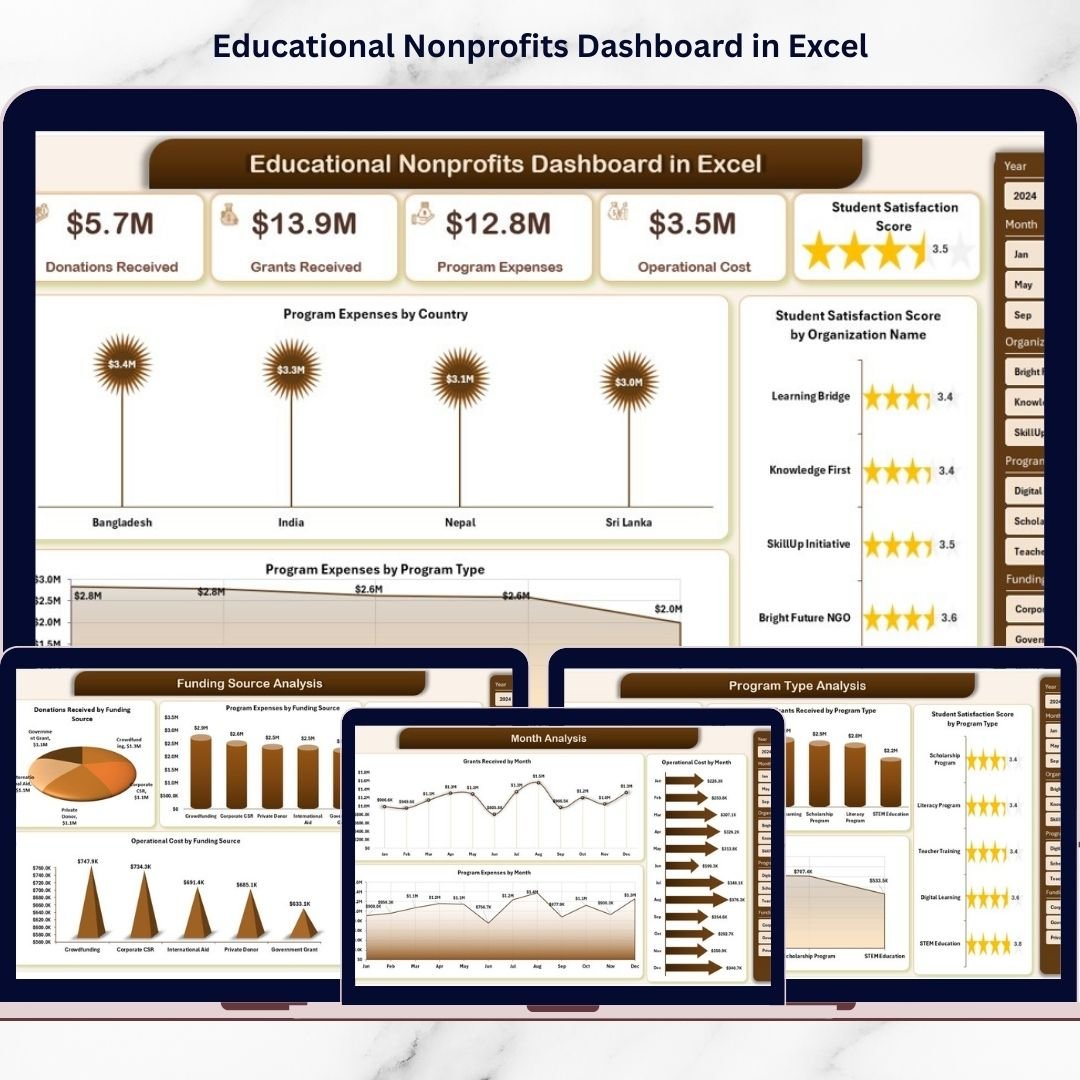
The Educational Nonprofits Dashboard in Excel is a ready-to-use, professionally designed analytics solution that helps nonprofit organizations monitor performance, funding utilization, operational costs, and student satisfaction in one centralized platform. Instead of spending hours compiling reports, nonprofit leaders can instantly analyze key performance indicators (KPIs) through interactive charts, slicers, and automated calculations.
Built entirely in Microsoft Excel, this dashboard transforms raw nonprofit data into meaningful visual insights that support faster decision-making and improved organizational transparency. Because Excel is widely accessible and easy to use, nonprofits can implement advanced analytics without investing in expensive software systems.
Whether your organization manages international education programs, local learning initiatives, scholarship projects, or community outreach missions, this dashboard helps you move from manual reporting to data-driven impact management.
🚀 Key Feature of Educational Nonprofits Dashboard in Excel
📊 Centralized Nonprofit Performance Monitoring
Track programs, donations, expenses, and satisfaction metrics from one unified dashboard.
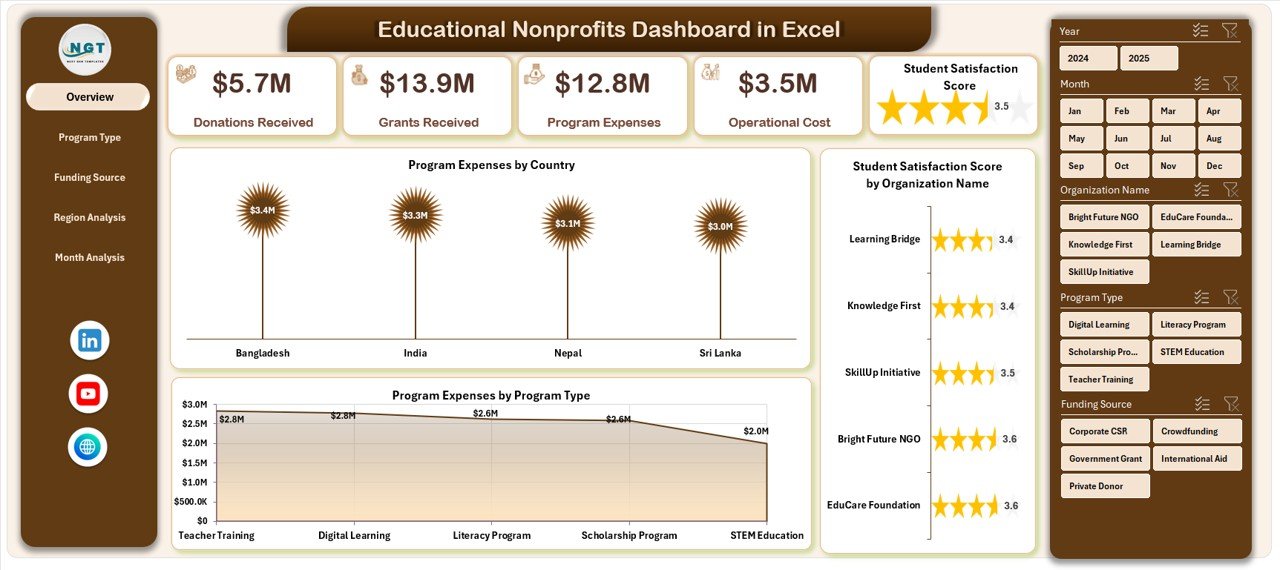
🎯 Interactive Overview Dashboard
View KPI cards and high-level charts that instantly summarize organizational performance.
🌍 Program & Country Analysis
Analyze program expenses and performance across different countries and organizations.
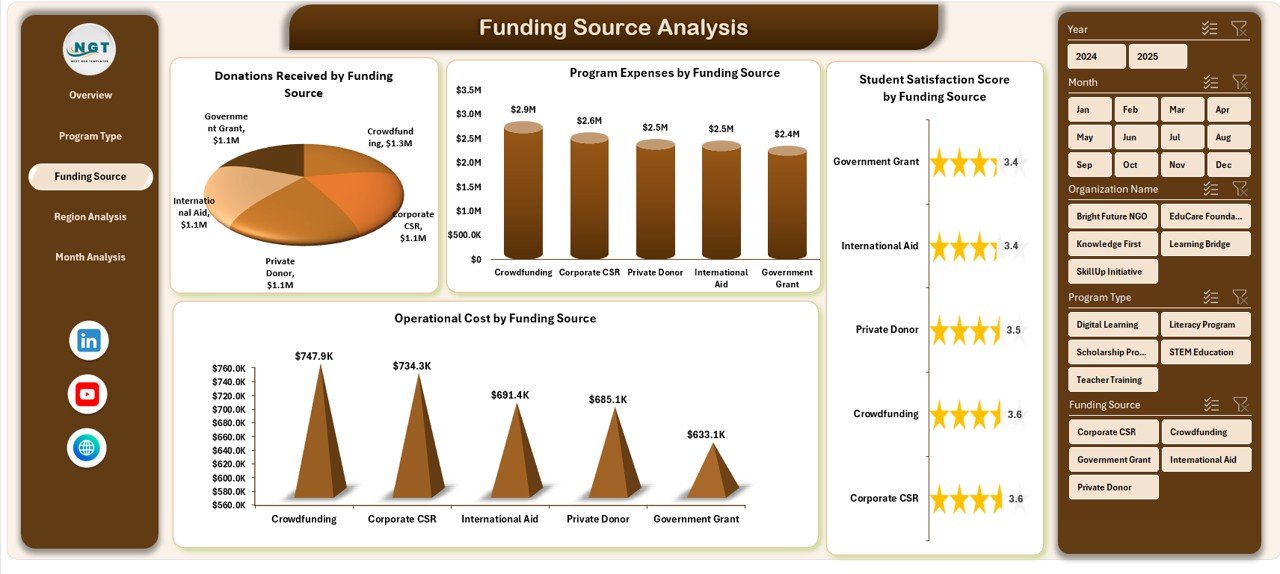
💰 Funding Source Transparency
Monitor donations, grants, and operating costs by funding source for improved accountability.
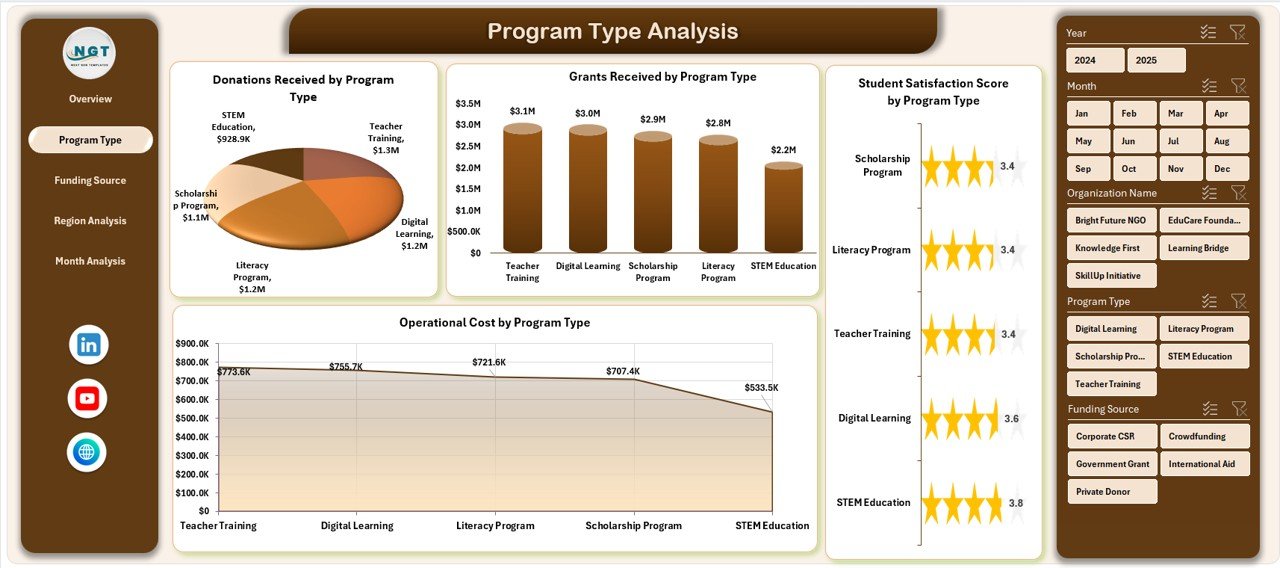
📈 Program Type Performance Insights
Compare program effectiveness and cost efficiency across educational initiatives.
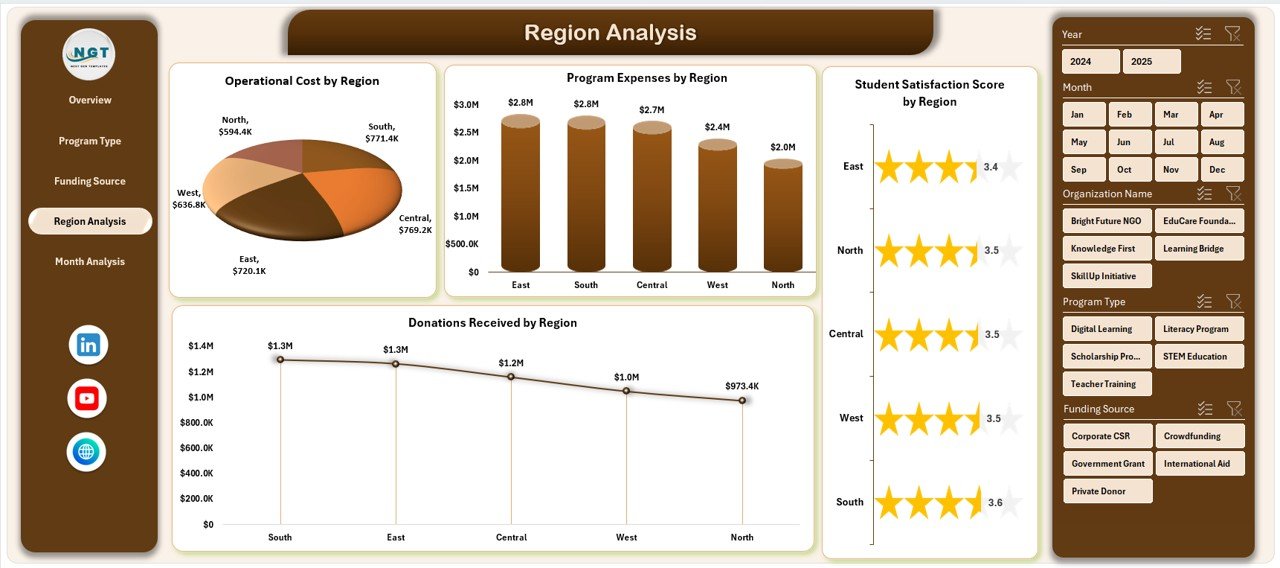
📍 Region-Based Impact Analysis
Evaluate performance differences across geographic regions for smarter resource allocation.
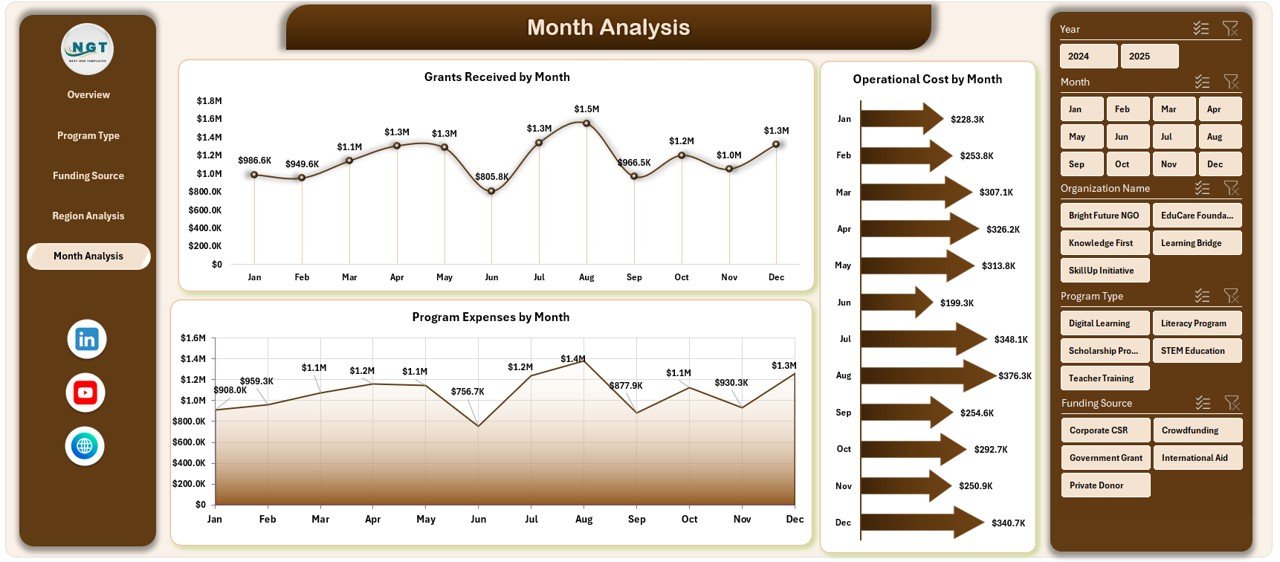
📅 Monthly Financial Trend Analysis
Track expenses, grants, and operating costs over time to support budgeting decisions.
⚡ Automated Excel Calculations & Charts
Update data once and refresh Pivot Tables to instantly update visuals.
📦 What’s Inside the Educational Nonprofits Dashboard in Excel
This ready-to-use template provides a complete nonprofit analytics framework:
✅ Five Interactive Dashboard Pages
-
Overview Page
-
Program Type Analysis
-
Funding Source Analysis
-
Region Analysis
-
Month Analysis
✅ Page Navigator for Easy Navigation
✅ Dynamic Slicers for Interactive Filtering
✅ Prebuilt Pivot Charts & KPI Cards
✅ Structured Data Sheet for Easy Input
✅ Support Sheet for Backend Calculations
Simply enter your data and begin analyzing nonprofit performance immediately.
🛠️ How to Use the Educational Nonprofits Dashboard in Excel
The dashboard is designed for simplicity and quick adoption:
1️⃣ Enter program and financial data into the Data Sheet.
2️⃣ Maintain standardized entries using predefined columns.
3️⃣ Refresh Pivot Tables to update dashboard visuals.
4️⃣ Apply slicers to filter by region, program type, or funding source.
5️⃣ Navigate between analysis pages using the Page Navigator.
6️⃣ Generate reports instantly for meetings or donor presentations.
No advanced Excel knowledge is required — automation handles calculations and visualization.
👥 Who Can Benefit from This Educational Nonprofits Dashboard in Excel
This dashboard is ideal for professionals and organizations working in the nonprofit education sector:
🎓 Educational Nonprofit Leaders
📊 Program Managers & Coordinators
💰 Finance & Grant Management Teams
🌍 International Education Organizations
🤝 Donors & Stakeholders
📈 Analysts & Reporting Teams
From small nonprofits to large global organizations, this dashboard provides clear performance visibility.
By implementing this dashboard, nonprofits centralize reporting, improve financial transparency, enhance donor communication, and make smarter strategic decisions. Instead of managing multiple spreadsheets, teams gain a structured analytics system that highlights impact and performance clearly.
### Click here to read the Detailed blog post
Visit our YouTube channel to learn step-by-step video tutorials:
👉 https://youtube.com/@PKAnExcelExpert


