Economic development organizations constantly work to attract investments, stimulate industrial growth, create employment opportunities, and strengthen regional economies. However, monitoring the performance of these initiatives becomes challenging when teams rely on scattered spreadsheets and manual reporting systems.
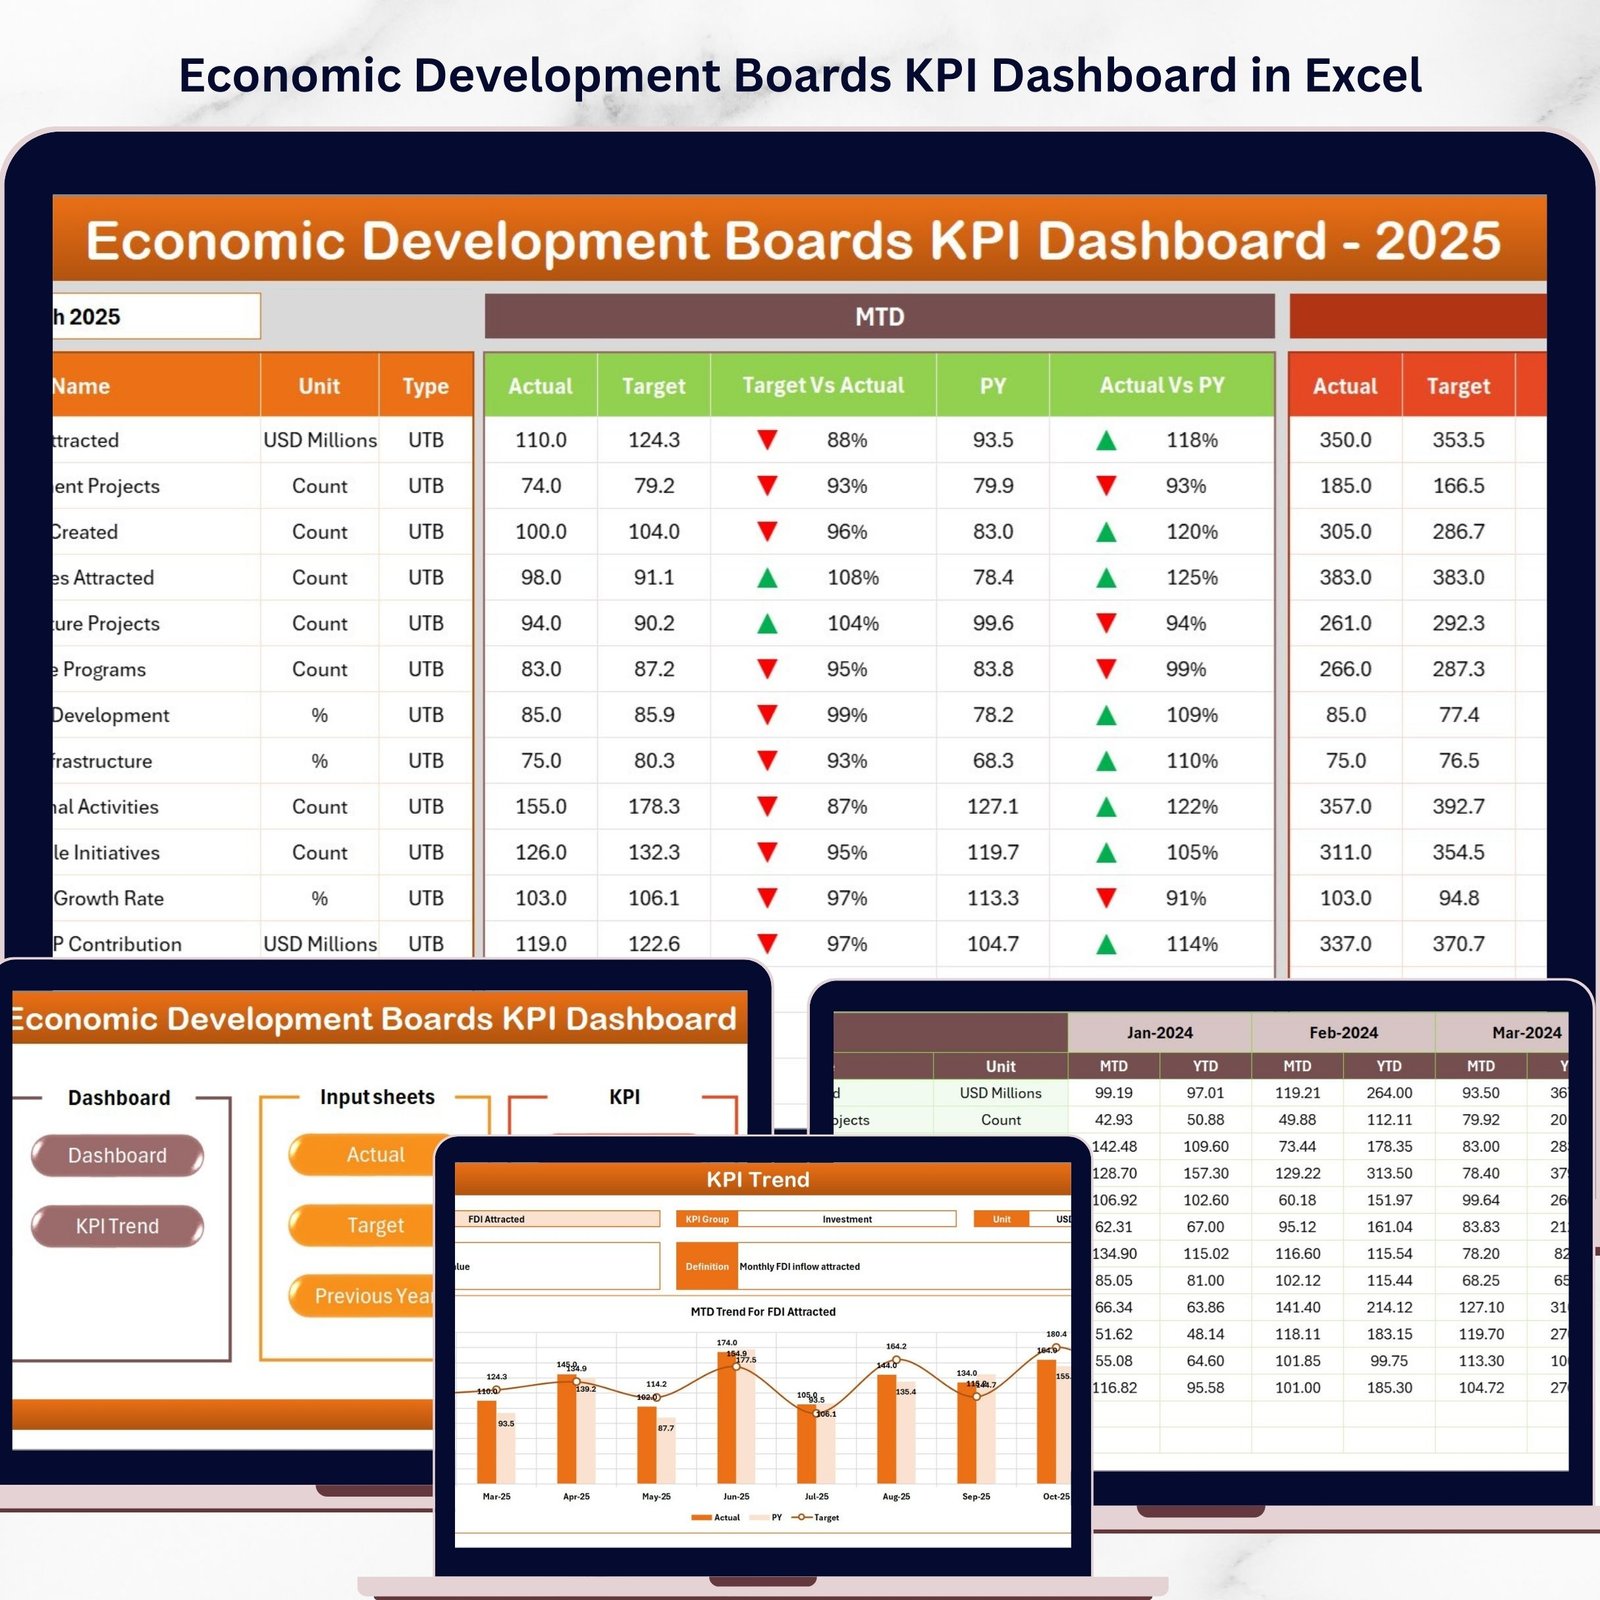
This is where the Economic Development Boards KPI Dashboard in Excel becomes a powerful solution. This ready-to-use Excel dashboard helps economic development boards, government agencies, and policy planners track critical economic indicators in one centralized and interactive reporting system.
Instead of spending hours compiling reports, decision-makers can instantly visualize economic performance using structured KPI scorecards, charts, and comparisons. Because the dashboard converts raw economic data into meaningful insights, leaders can quickly evaluate development progress, compare targets with actual performance, and identify areas that require improvement.
Whether your organization focuses on investment promotion, job creation, infrastructure development, or regional economic growth, this dashboard provides a structured framework to monitor progress effectively.
Key Feature of Economic Development Boards KPI Dashboard in Excel
🚀 Interactive KPI Monitoring Dashboard
Track multiple economic development KPIs in one centralized dashboard designed for clear and structured performance monitoring.
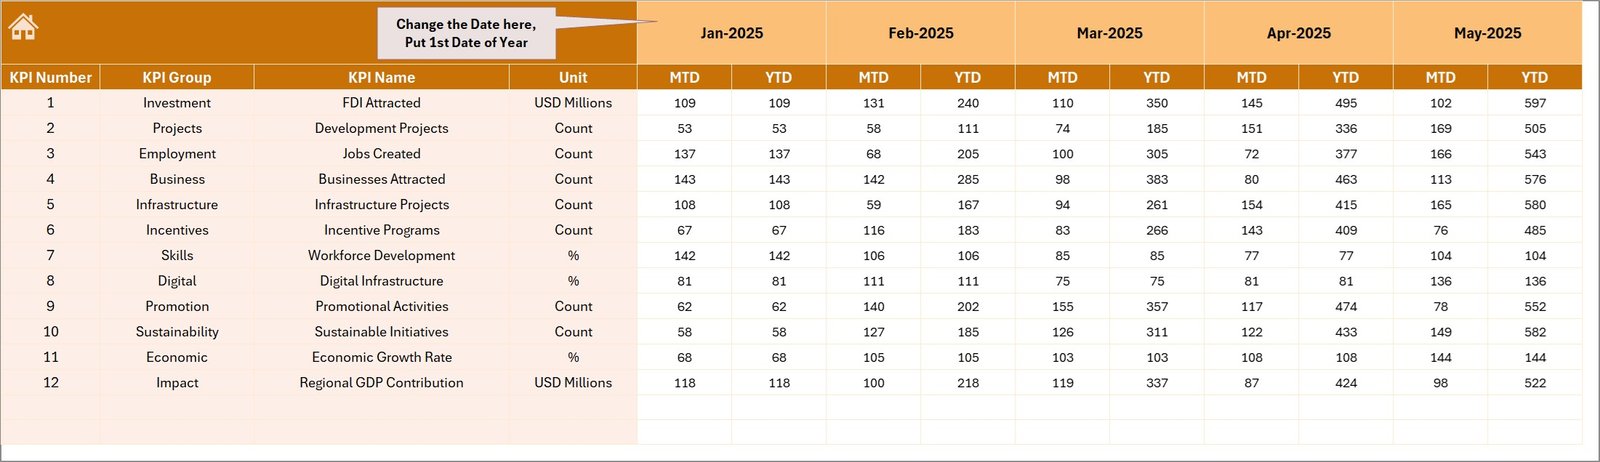
📊 MTD and YTD Performance Analysis
Analyze Month-to-Date (MTD) and Year-to-Date (YTD) performance metrics to understand short-term and long-term economic progress.
📅 Dynamic Month Selection
Select any month from the drop-down menu and the entire dashboard automatically updates with the selected period’s data.
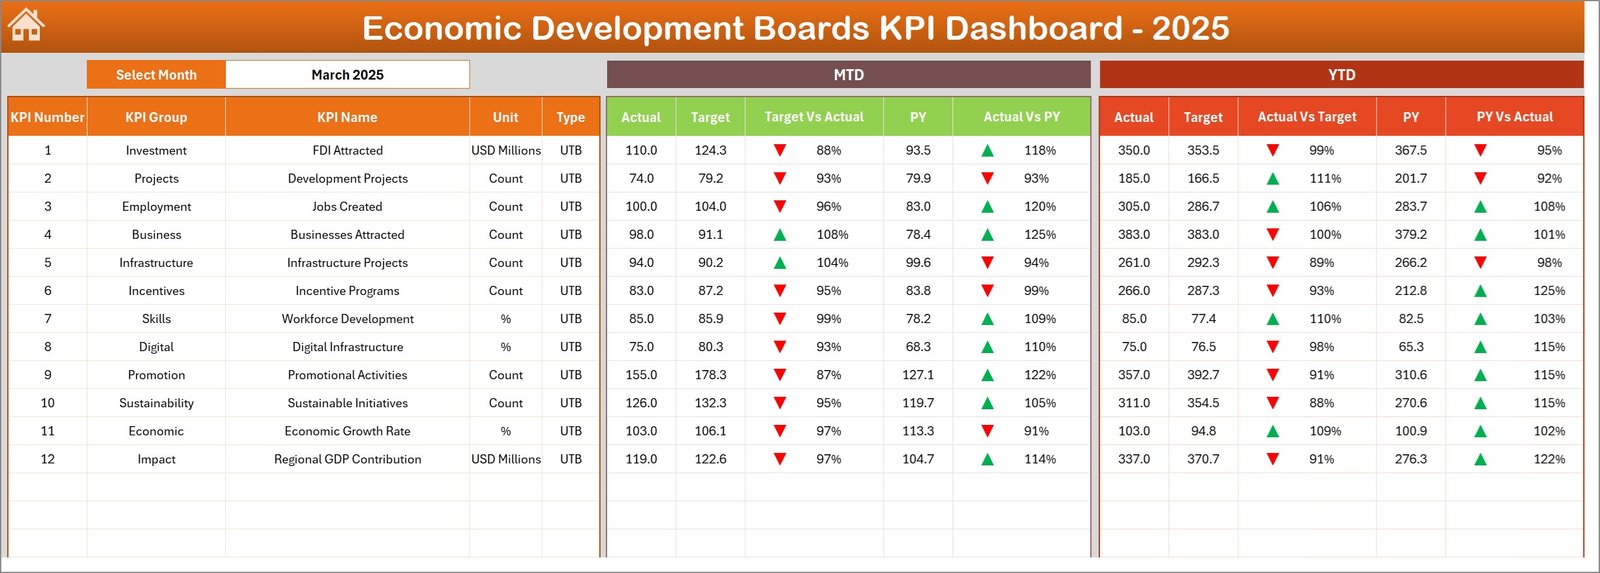
📈 Actual vs Target vs Previous Year Comparison
Instantly compare actual results with planned targets and historical performance to measure development success.
📉 Conditional Formatting Performance Indicators
Visual up and down arrows highlight KPI performance trends, helping users quickly identify growth or performance gaps.
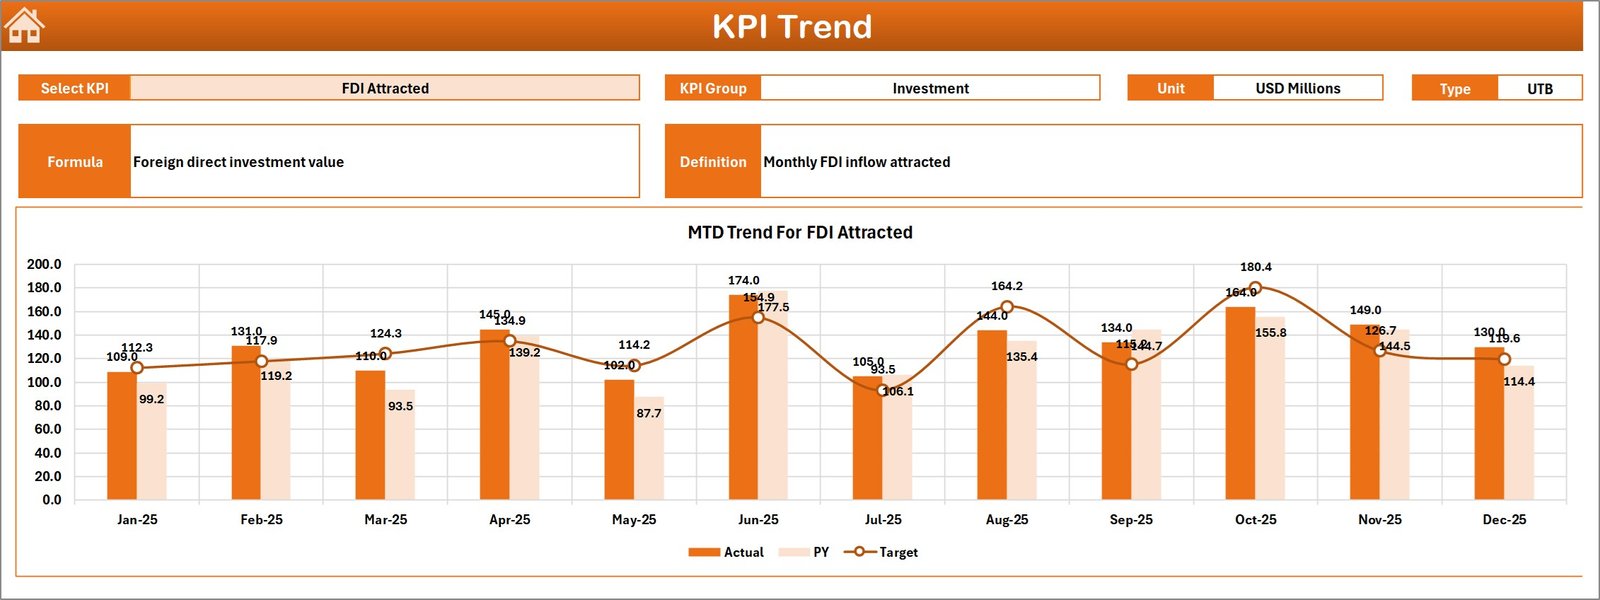
📑 Dedicated Trend Analysis Sheet
Monitor KPI trends using dynamic charts that show Actual vs Target vs Previous Year comparisons over time.
📁 Seven Structured Excel Worksheets
The dashboard includes well-organized sheets for navigation, KPI monitoring, trend analysis, data input, targets, historical data, and KPI documentation.
⚡ Automatic Dashboard Updates
Once users update the input data sheets, the entire dashboard refreshes automatically without manual calculations.
📚 Centralized KPI Definitions
All KPI formulas, units, and definitions are documented in one place to maintain reporting clarity and data consistency.
💡 Excel-Based and Easy to Use
Built entirely in Excel, the dashboard does not require advanced BI software, making it easy for organizations to implement.
What’s Inside the Economic Development Boards KPI Dashboard in Excel
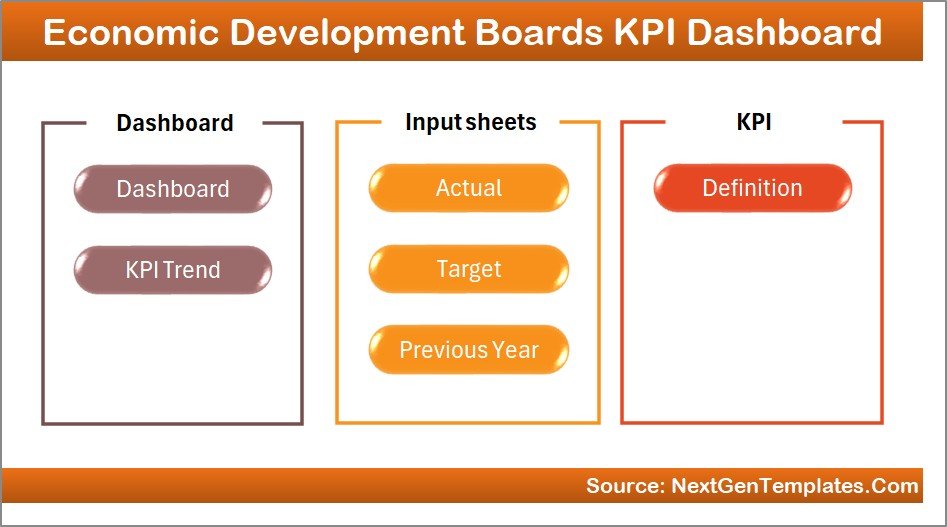
The dashboard contains 7 well-structured worksheets designed for different analytical purposes.
📌 Summary Page
Acts as the navigation hub of the dashboard. It includes clickable buttons that allow users to quickly jump to different sheets.
📊 Dashboard Sheet
The main KPI monitoring page where users analyze economic performance metrics using comparisons between Actual, Target, and Previous Year values.
📈 Trend Sheet
Allows users to select any KPI and analyze its performance trends with dynamic charts showing MTD and YTD comparisons.
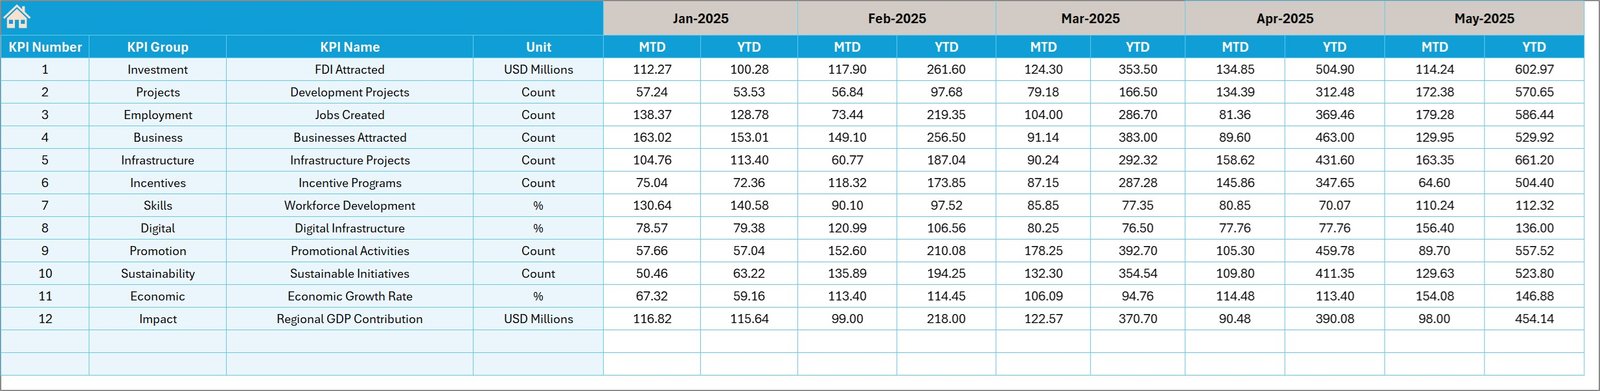
📝 Actual Numbers Input Sheet
This sheet stores the current year KPI data. Users simply enter the latest performance numbers to update the dashboard.
🎯 Target Sheet
Stores monthly and yearly KPI targets used to measure performance accuracy.
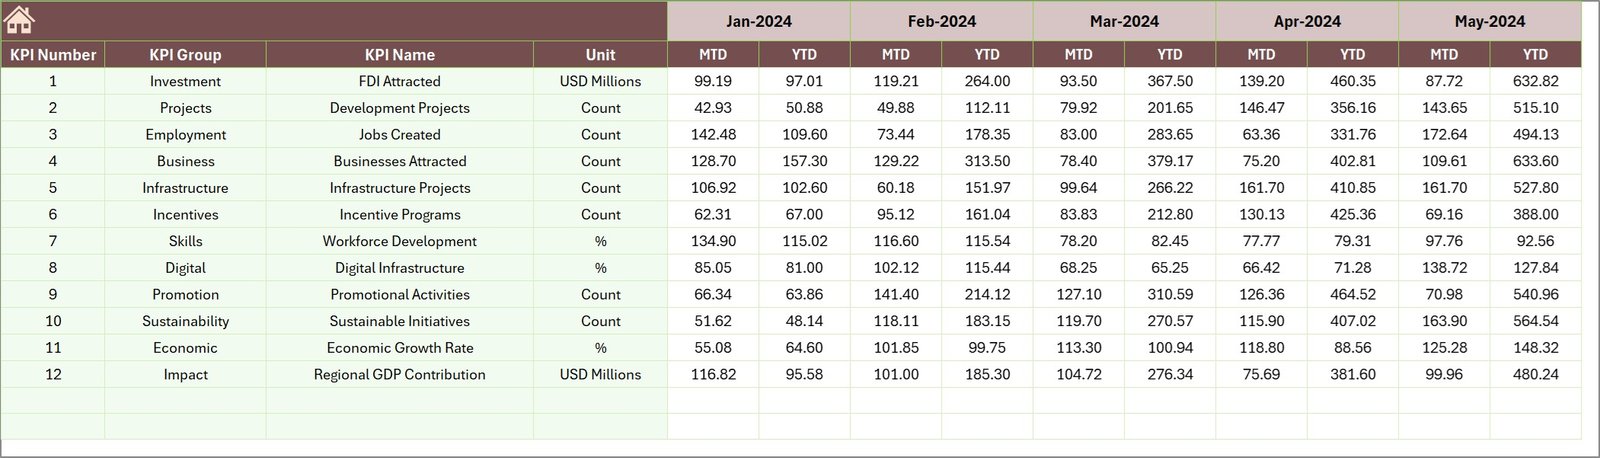
📅 Previous Year Numbers Sheet
Contains historical data used to compare current results with past performance trends.
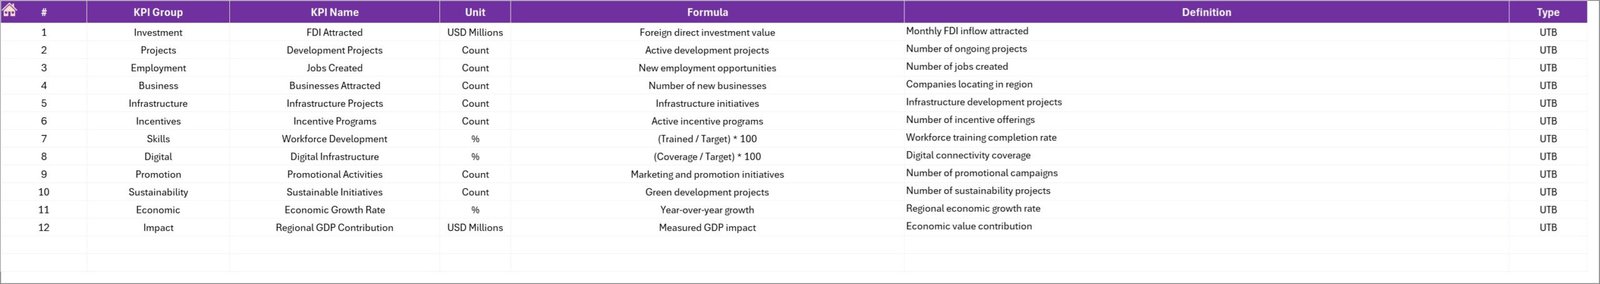
📘 KPI Definition Sheet
Documents KPI names, formulas, groups, units, and definitions to ensure clear understanding across stakeholders.
How to Use the Economic Development Boards KPI Dashboard in Excel
Using this dashboard is simple and does not require advanced Excel skills.
1️⃣ Enter KPI data in the Actual Numbers Input sheet.
2️⃣ Define performance targets in the Target sheet.
3️⃣ Add historical data in the Previous Year Numbers sheet.
4️⃣ Select a month from the drop-down menu in the Dashboard sheet.
5️⃣ Analyze KPI performance using visual charts and comparisons.
Once data is updated, the dashboard automatically recalculates metrics and displays updated insights.
Therefore, organizations can generate monthly or yearly economic performance reports in seconds.
Who Can Benefit from This Economic Development Boards KPI Dashboard
This dashboard is useful for organizations responsible for economic growth monitoring.
🏛 Economic Development Boards – Track investment programs and regional growth initiatives.
🏢 Government Departments – Monitor employment generation, infrastructure projects, and industrial development.
📊 Economic Policy Analysts – Evaluate whether economic policies deliver expected results.
💼 Investment Promotion Agencies – Analyze investment inflows and project performance.
🌍 Regional Development Authorities – Monitor sector growth and regional economic indicators.
📑 Strategy and Planning Teams – Track KPIs related to economic performance and development targets.
Because the dashboard provides structured KPI tracking, organizations can make data-driven economic policy decisions faster and more effectively.
Watch the step-by-step video tutorial:
Click here to read the Detailed blog post
Visit our YouTube channel to learn step-by-step video tutorials


