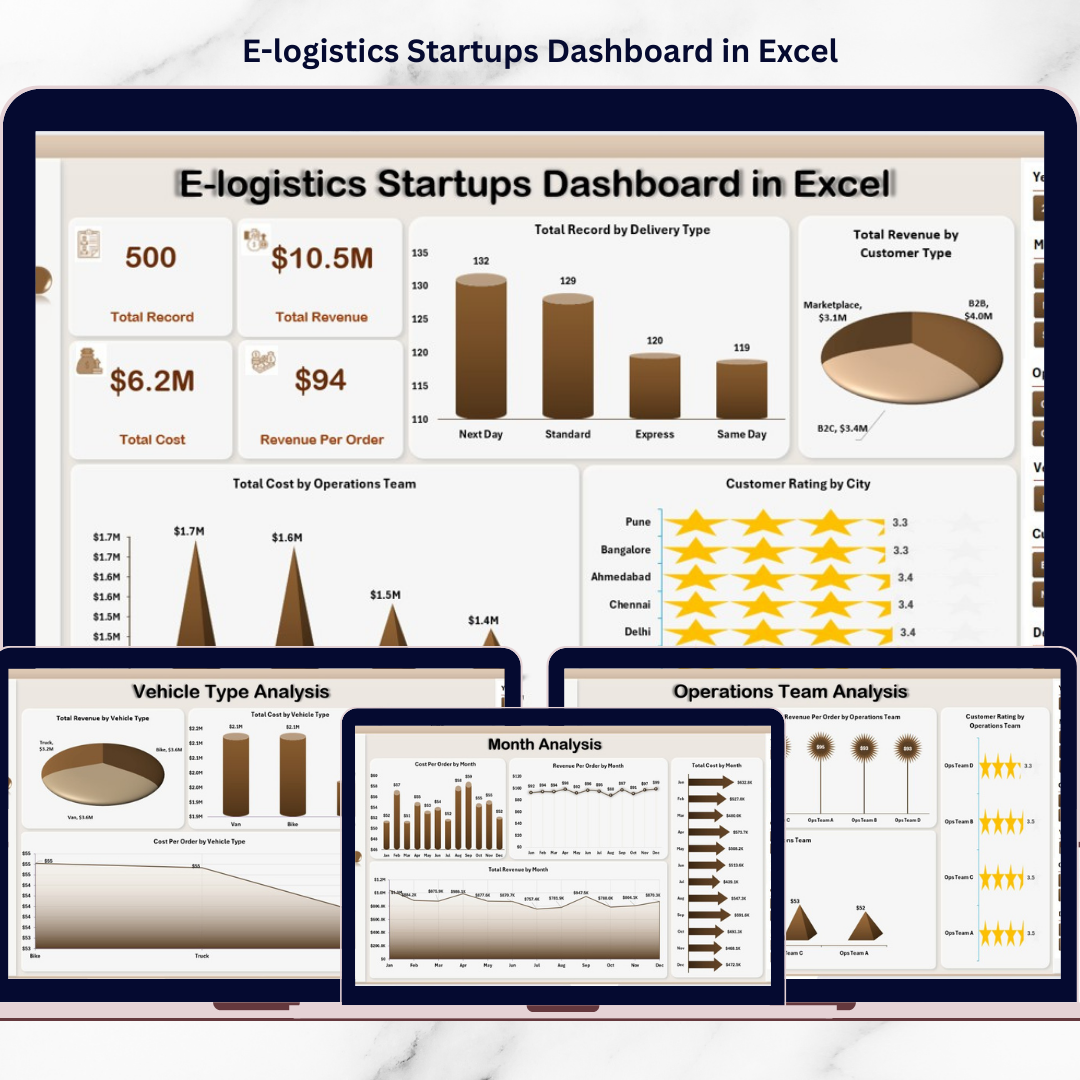
E-logistics Startups Dashboard startups operate in a fast-moving and competitive environment where every delivery, vehicle movement, cost, and customer rating matters. Companies must track thousands of delivery records, manage fleets, monitor operational teams, and ensure customers receive orders on time. At the same time, startups must control costs and maintain profitability while delivering excellent service.
However, many e-logistics businesses still rely on scattered spreadsheets and manual reports. As a result, managers struggle to clearly understand operational performance. It becomes difficult to identify which vehicle type performs best, which operations team controls costs efficiently, or which startup brand generates the most revenue.
That is where the E-logistics Startups Dashboard in Excel becomes an extremely powerful solution.
This ready-to-use Excel dashboard converts raw logistics data into clear visual insights using charts, KPI indicators, and interactive filters. Instead of reviewing multiple reports, startup founders and operations managers can monitor deliveries, analyze revenue, track operational costs, and measure customer satisfaction from a single interactive dashboard.
Because Excel provides pivot tables, slicers, and dynamic charts, users can easily explore logistics data and make faster data-driven decisions.
If you want better operational visibility and improved logistics performance, this dashboard offers a practical and powerful solution.
🚚 Key Feature of E-logistics Startups Dashboard in Excel
This structured Excel dashboard includes five analytical pages designed to analyze logistics performance from multiple operational perspectives.
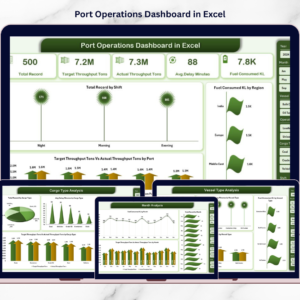
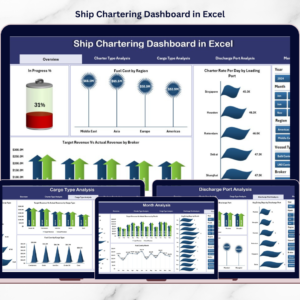
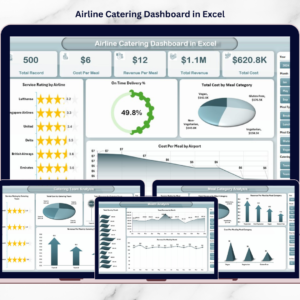
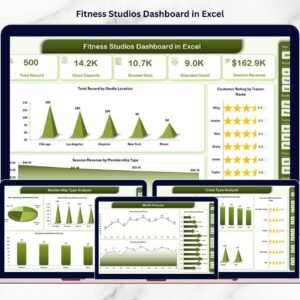
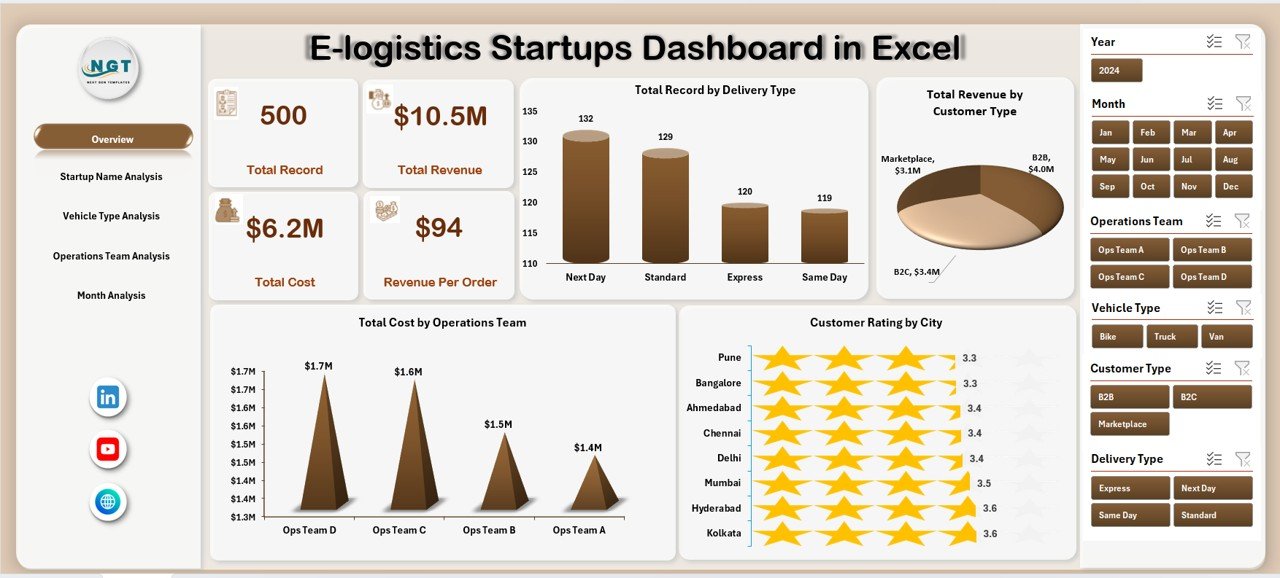
📊 Overview Dashboard Page – A centralized page displaying key logistics performance metrics.
🎯 Interactive Slicers & Filters – Analyze logistics data by delivery type, startup name, vehicle type, operating team, and month.
📦 Delivery Performance Monitoring – Track the total number of deliveries by delivery type.
💰 Revenue Performance Analysis – Monitor revenue generated from different customer types and startups.
💸 Cost Monitoring by Operations Team – Analyze operational expenses across logistics teams.
⭐ Customer Satisfaction Tracking – Monitor customer ratings across cities and service areas.
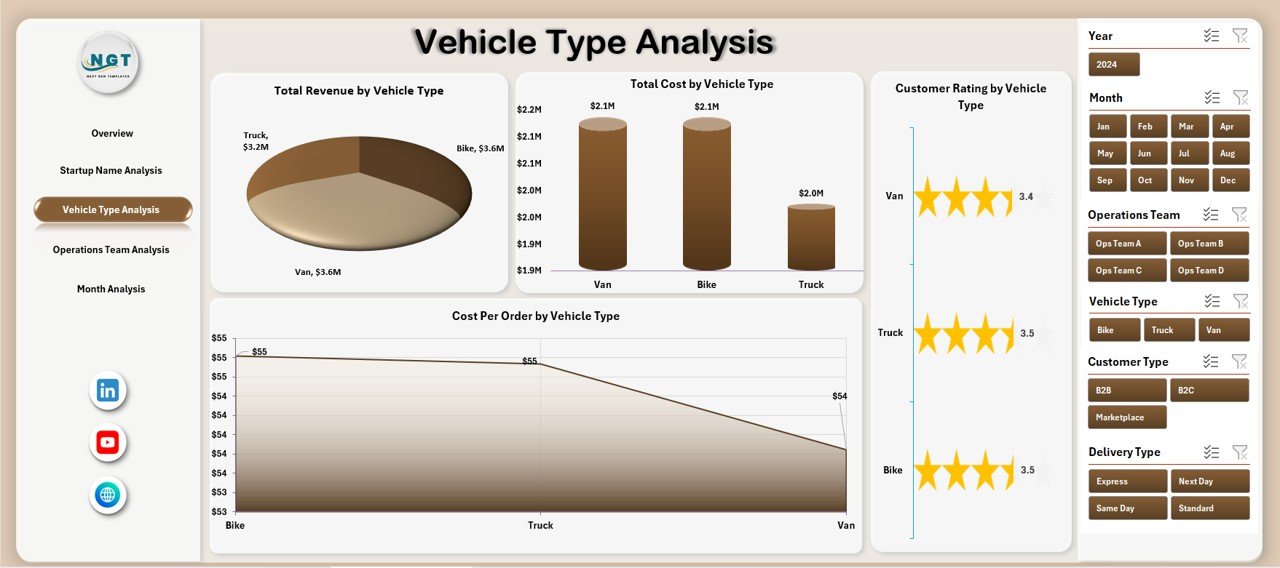
🚗 Vehicle Performance Analysis – Evaluate vehicle utilization, revenue generation, and operating cost.
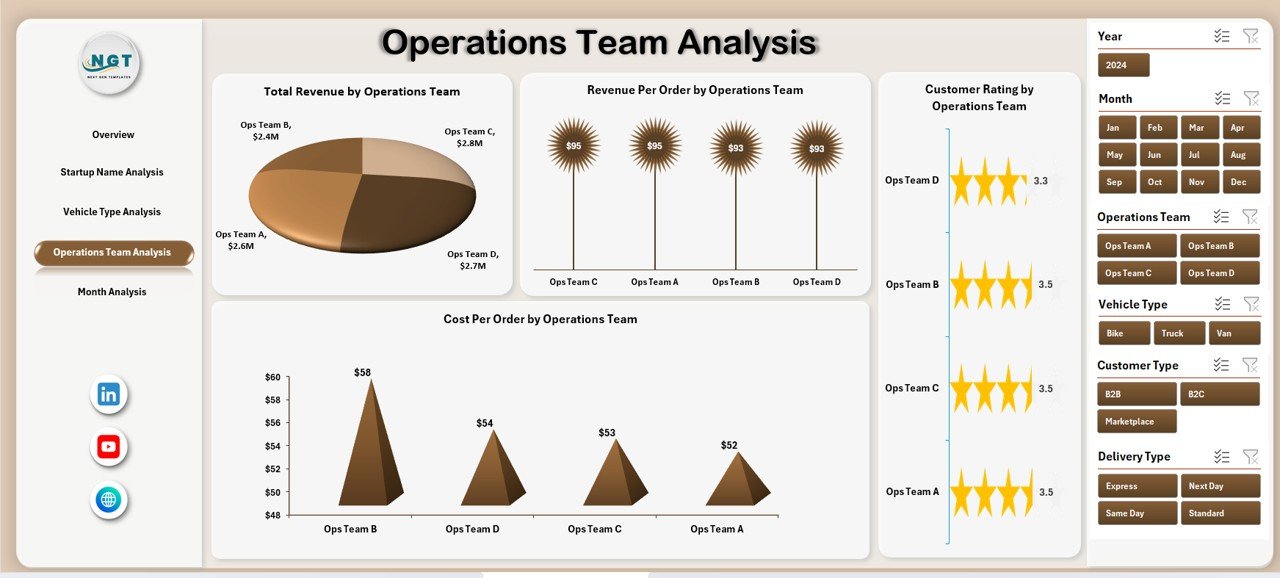
👥 Operations Team Efficiency Monitoring – Compare team productivity, revenue performance, and cost control.
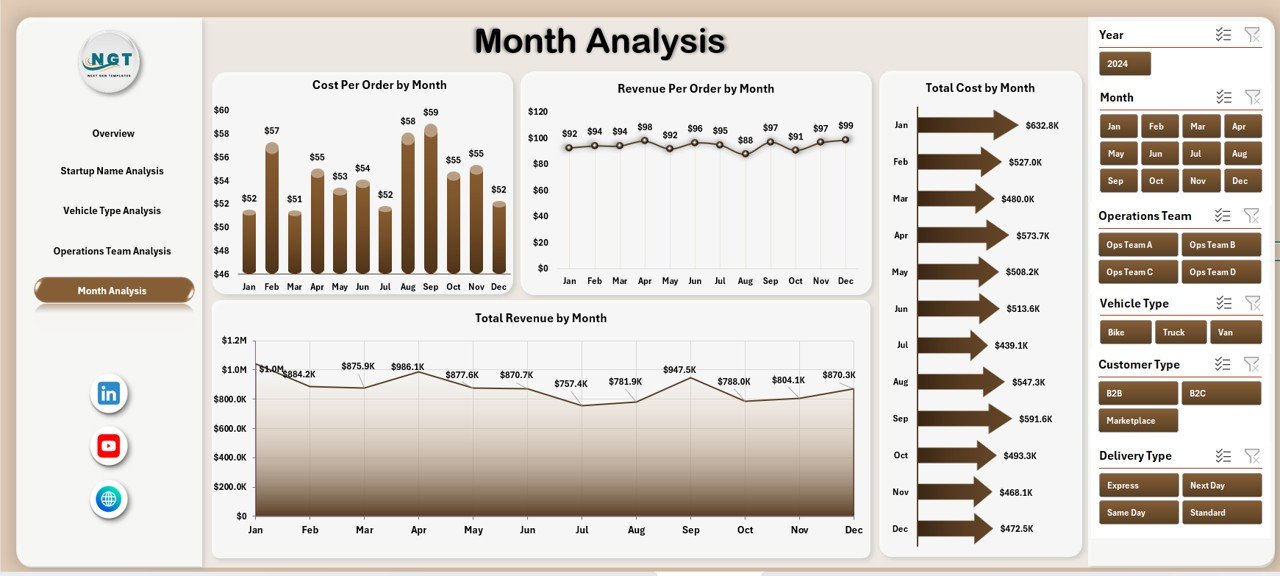
📅 Monthly Trend Analysis – Track cost, revenue, and profitability trends across months.
Because the dashboard updates dynamically, managers can analyze logistics operations instantly and identify performance gaps quickly.
📦 What’s Inside the E-logistics Startups Dashboard in Excel
The dashboard includes a structured analytics framework designed for logistics startups.
Inside the template you will find:
✅ Overview Page – High-level summary of logistics performance
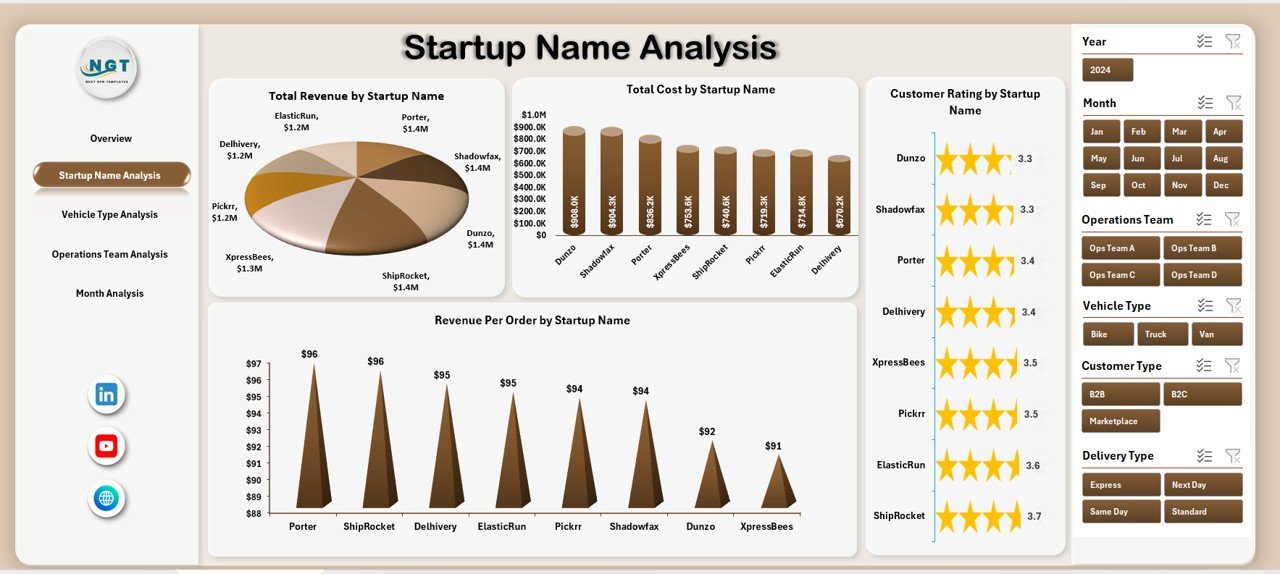
✅ Startup Name Analysis Page – Performance comparison between startup brands
✅ Vehicle Type Analysis Page – Fleet performance insights
✅ Operations Team Analysis Page – Operational efficiency comparison
✅ Month Analysis Page – Time-based logistics performance trends
✅ Support Sheet – Backend calculations and helper tables
✅ Data Sheet – Raw logistics dataset used for dashboard analytics
The dashboard typically tracks data fields such as:
Order ID
Delivery Type
Startup Name
Vehicle Type
Operating Team
City
Customer Rating
Revenue
Cost
Month
Because the dashboard uses structured pivot tables, users can update the source data and refresh insights easily.
⚙️ How to Use the E-logistics Startups Dashboard in Excel
Using this dashboard is simple and requires only basic Excel knowledge.
1️⃣ Enter logistics operational data in the Data Sheet.
2️⃣ Ensure each record contains delivery type, startup name, vehicle type, cost, revenue, and customer rating.
3️⃣ Refresh pivot tables to update charts.
4️⃣ Use slicers to filter logistics data by startup name, vehicle type, team, or month.
5️⃣ Analyze operational performance across different dashboard pages.
Within seconds, managers gain a clear view of logistics operations and performance trends.
Because the dashboard automates calculations and visual insights, teams can focus on decision-making instead of manual reporting.
👥 Who Can Benefit from This E-logistics Startups Dashboard in Excel
This dashboard is designed for professionals involved in logistics operations and delivery management.
It is particularly useful for:
🚚 E-logistics Startup Founders
📦 Delivery Operations Managers
📊 Logistics Analysts
💰 Finance Teams
⭐ Customer Experience Teams
🚗 Fleet Management Teams
Because the dashboard combines operational, financial, and customer insights, multiple departments can use it simultaneously.
💡 Why This Dashboard Improves Logistics Startup Performance
✔ Centralized monitoring of logistics operations
✔ Faster identification of operational inefficiencies
✔ Better cost control across delivery operations
✔ Improved vehicle and fleet management
✔ Clear comparison between startup divisions and teams
✔ Data-driven decision-making for logistics planning
✔ Improved customer satisfaction monitoring
✔ Stronger business performance analysis
Instead of relying on fragmented reports, logistics startups gain real-time operational insights through visual analytics.
This dashboard transforms delivery data into actionable insights that support smarter logistics management and business growth.
### Click here to read the Detailed blog post
Visit our YouTube channel to learn step-by-step video tutorials
Youtube.com/@PKAnExcelExpert