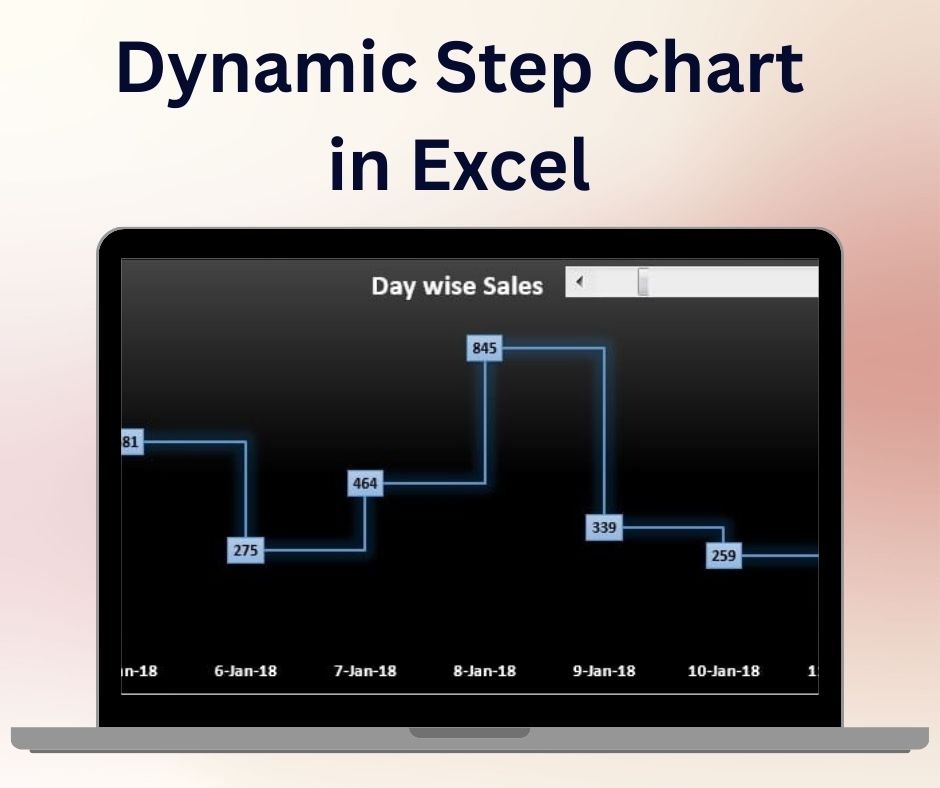
The Dynamic Step Chart in Excel is an innovative and versatile tool designed to help you track and visualize changes in data over time. Ideal for displaying data trends, milestones, and stepwise progressions, this dynamic chart allows you to clearly represent fluctuating values, making it perfect for business, financial, or project tracking.
The chart’s step-like design makes it easy to visualize significant changes in metrics, whether you’re monitoring sales growth, project milestones, or performance shifts. With this tool, you can provide stakeholders with clear and actionable insights, backed by a chart that automatically updates as new data is entered, ensuring that your data is always up to date.
Key Features of the Dynamic Step Chart in Excel:
📊 Visualize Stepwise Changes
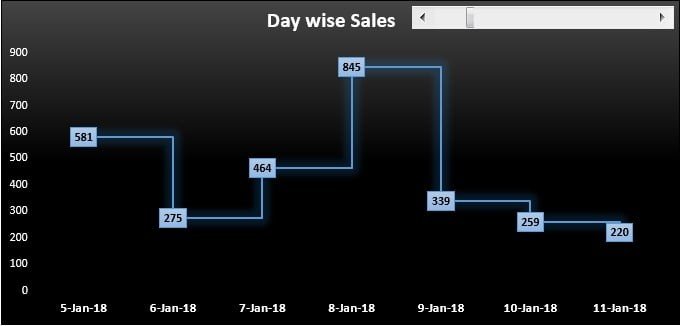
Easily track data changes over time, such as sales growth, budget changes, or project progress, using the step chart format that displays data in distinct intervals.
⚙️ Dynamic and Real-Time Updates
This chart automatically updates as you input or modify data, ensuring your visualizations are always current and accurate.
🎨 Customizable Design
Adjust the chart’s appearance, such as color schemes and labels, to match your business’s branding or personal preferences. Customize the chart to highlight key milestones or metrics.
📈 Clear, Stepwise Data Representation
The step chart design makes it easy to identify significant changes in the data, helping you spot trends and track performance with ease.
🔄 Easy Data Management
The chart is simple to set up and use. Input your data into the chart’s cells, and watch the chart dynamically update and provide clear visual insights.
Why You’ll Love the Dynamic Step Chart in Excel:
✅ Track Changes Over Time – The step chart format helps you easily track changes in data at specific intervals, making it ideal for monitoring progress and performance. ✅ Real-Time Insights – The chart updates automatically as new data is entered, giving you up-to-date insights into your business or project performance. ✅ Customizable and Flexible – Tailor the chart’s appearance and data inputs to suit your specific needs, whether you’re tracking sales, budgets, or project milestones. ✅ Easy-to-Understand Visualization – The step chart design offers a clear and intuitive way to represent fluctuating data trends. ✅ Perfect for Presentations – Use this dynamic chart in presentations or reports to visually represent key milestones and changes in your data, making it easier to communicate insights to stakeholders.
What’s Inside the Dynamic Step Chart in Excel:
- Stepwise Data Representation – Clearly visualize changes in data at regular intervals.
- Real-Time Data Updates – Automatically adjust the chart as data is updated, ensuring accurate and up-to-date insights.
- Customizable Design – Adjust the colors, labels, and data points to meet your specific needs.
- Easy Setup – The chart is simple to set up and manage in Excel, allowing you to quickly start tracking and visualizing data.
How to Use the Dynamic Step Chart in Excel:
1️⃣ Download the Template – Get instant access to the Excel file after purchase. 2️⃣ Input Your Data – Enter your values for each step, such as sales data, project milestones, or performance metrics. 3️⃣ Customize the Chart – Adjust the chart’s appearance to reflect your desired look, including colors and labels. 4️⃣ Track and Visualize Progress – Use the chart to monitor trends and make data-driven decisions.
Who Can Benefit from the Dynamic Step Chart in Excel:
- Business Owners
- Financial Analysts
- Project Managers
- Sales Teams
- Marketing Teams
- Data Analysts
- Anyone who needs to track and visualize data trends over time
The Dynamic Step Chart in Excel is the perfect tool to monitor and present fluctuating data in a clear and visually engaging way. Whether you’re tracking financial performance, project milestones, or other key metrics, this chart helps you communicate progress and insights effectively.
Click here to read the Detailed blog post
https://www.pk-anexcelexpert.com/dynamic-step-chart-in-excel/


Reviews
There are no reviews yet.